
ABSTRACT
Evolved metabolic thriftiness in humans is a proposed contributor to the obesity epidemic. Insect models have been shown to evolve both ‘metabolic thrift’ in response to rearing on high-protein diets that promote leanness, and ‘obesity resistance’ when reared on fattening high-carbohydrate, low-protein foods. Despite the hypothesis that human obesity is caused by evolved metabolic thrift, genetic contributions to this physiological trait remain elusive. Here we conducted a pilot study to determine whether thrift and obesity resistance can arise under laboratory based ‘quasi-natural selection’ in the genetic model organism Drosophila melanogaster. We found that both these traits can evolve within 16 generations. Contrary to predictions from the ‘thrifty genotype/phenotype’ hypothesis, we found that when animals from a metabolic thrift inducing high-protein environment are mismatched to fattening high-carbohydrate foods, they did not become ‘obese’. Rather, they accumulate less triglyceride than control animals, not more. We speculate that this may arise through as yet un-quantified parental effects – potentially epigenetic. This study establishes that D. melanogaster could be a useful model for elucidating the role of the trans- and inter-generational effects of diet on the genetics of metabolic traits in higher animals.
Introduction
Animal species that evolved in environments prone to energy limitation and unreliability are theorized to have a heightened physiological capacity to sequester and store dietary energy in their adipose tissue compared with animals from environments with consistent or abundant energy supply [Citation1]. Work in model species has shown that animals are capable of evolving this metabolic phenotype, often termed ‘metabolic thrift’, when confined for successive generations to dietary environments where access to non-protein energy is limited relative to protein [Citation2,Citation3].
Studies have demonstrated that insect populations are also capable of evolving the opposite phenotype to metabolic thrift, known as ‘obesity resistance’. This occurs when the animals are reared in nutritional environments where diets have a low concentration of protein relative to non-protein energy [Citation2,Citation3]. These dietary circumstances drive excess energy intake as insects attempt to achieve a target intake of protein [Citation4], a phenomenon termed protein-leverage [Citation5]. Upon initial exposure to such protein-dilute diets, excess energy intake is associated with the development of excess adiposity. However, when maintained for several generations on low-percentage protein, high-carbohydrate diets, the tendency to store the extra calories consumed as body fat diminishes [Citation2,Citation3]. This is likely to occur because of the well-described fitness costs associated with being obese [Citation6–9].
Metabolic thrift in humans is often proposed a contributor to the obesity epidemic [Citation10,Citation11]. According to theory, human metabolic thrift (a hypothesized adaptation to past caloric scarcity) is evolutionarily mismatched to modern industrialized food environments [Citation1,Citation12,Citation13], which are replete with high-calorie, low-protein, and highly palatable processed foods [Citation14,Citation15]. There are several iterations of the theory. The ‘thrifty genotype hypothesis’ of Neel (1962) [Citation12], posits that obesity (and concomitant Type II diabetes [T2D]) is caused by a human genetic predisposition to efficiently store excess calories consumed as body fat. The theory is usually restated such that discrete genes are responsible, and that all humans should possess them due to our shared evolutionary origins [Citation16]. Hales and Baker’s [Citation17] ‘thrifty phenotype hypothesis’ develops this idea further. They theorize that a person’s metabolism and metabolic organs are programmed for thriftiness following insufficient early life nutrition. Obesity and T2D follow when in adulthood, an energy abundant food environment is encountered. Both ideas have been criticized, as no heredity mechanism for thrift has been identified, however, Stoger [Citation1] has attempted to resolve this by suggesting all animals possess a ‘thrifty epigenome’. He argues no specific genes conferring a thrifty phenotype exist because thrift is likely controlled through complex epigenetic means involving multiple gene-networks. He theorizes that people with obesity (and T2D) have unfortunately exposed themselves to the consequences of their thrifty epigenome through their feeding behaviour – eating calorie rich food excess to requirement [Citation1].
Despite the proposed evolutionary origins of human obesity, any genetic or physiological mechanisms conferring metabolic thrift remain elusive [Citation18,Citation19], leading some authors to propose other novel physiological drivers of human obesity [Citation19–21]. While monogenic studies in mice and Drosophila melanogaster have identified candidate genes and gene products that confer obesity resistance [Citation22–28], their potential involvement in regulating metabolic thrift has not been examined. Nor have any manipulative studies been conducted to investigate the metabolic consequences of mismatch between past vs. experienced nutritional environments on adipose physiology in genetic model organisms.
Here we have used D. melanogaster and nutritionally defined diets to 1) verify that both metabolic thrift and obesity resistance can evolve in the species (see [Citation2]); and 2) if and when these metabolic traits evolve, to investigate the consequences of nutritional environmental mismatch on fly adipose stores. We used D. melanogaster to test these concepts due to the species ease of rearing, short generation time, and the high degree of evolutionary conservation between insect and mammalian metabolic pathways and genes [Citation29]. Through this pilot work we hope to establish a Drosophila model system for studying the potential evolutionary bases of obesity.
Materials and methods
1) Aims and hypotheses
For our main selection experiment (see Materials and Methods, 4a, Selection experiment, no control for parental effects), we have a preliminary hypothesis that over generations of quasi-natural selection, the pupal lipid storage expressed by individuals maintained on an ‘obesogenic’ low-protein diet and those on a high-protein ‘leanness’ inducing diet will converge towards those expressed by insects from our ancestral food environment. We predict this, as according to the evolutionary theory of natural selection, those from the ancestral line will, over hundreds of preceding generations of selection, have adapted to the ancestral diet, and thus express an optimized metabolic phenotype as appropriate for the species maximal fitness. Over experimental time, we predict that our test animals, being members of the same species (after being subjected to multiple generations of dietary stress) will also adapt and converge towards the optimized lipid storage displayed by ancestral line individuals.
Accompanying this main experiment, we also analyse the potential contribution of parental intergenerational effects vs genetic effects, on lipid storage (see Materials and Methods 4b, Selection experiment, control for parental effects).
In our next experiments, (see Materials and Methods 5a, Mis-match, no control for parental effects) we test for consequences of dietary mismatch between the selection regimes by rearing individuals from the long-term ‘lean’ environment in the ‘obesogenic” environment and vice versa. Following the ‘thrifty geno/phenotype’ hypothesis, we predict individuals maintained for many generations on the leanness inducing high-protein diet would contain greater lipid reserves (relative to those maintained in the ancestral environment) when fed the obesogenic food for the larval period. And vice versa, we predict that individuals raised for many generations in the obesogenic environment will have low (or varying) lipid storage (relative to the ancestral-line pupae) when fed the ‘lean’ diet.
Here we also test for the contribution of intergenerational parental vs. genetic effects (see Materials and Methods 5b, Mis-match, control for parental effects).
2) Flies and rearing
In the generations immediately prior to the selection experiments D. melanogaster (Canton-S flies sourced from the Bloomington Stock Centre in 2006) were maintained in culture for 20 generations on a 1 protein (P):5 carbohydrate (C) ‘ancestral’ diet with over-lapping generations (see ingredients below). Flies were kept at densities of ~200 individuals per bottle, with ten bottles maintained at each generation. ‘Bottles’ were sterilized, 237 mL glass vials. The culture was maintained, and subsequent experiments conducted, at 25°C, under a 12 L:12D light cycle, with lights on at 0700 h. Prior to this, the colony had been raised on a diet with the same macro-nutrient composition (though formulated using complex foods including semolina and golden syrup), under similar populations densities and the above conditions.
3) Experimental diets
Drosophila melanogaster larvae demonstrate pronounced protein leverage, hence they over consume total energy and develop excess adiposity on low-protein to carbohydrate (P:C) diets. In contrast, they under-consume total energy and develop a lean phenotype when confined to high P:C diets [Citation4]. To elicit the potential for obesity resistance to evolve, we raised flies on a 1 P:9 C diet, which contained a substantially higher percentage of carbohydrate than the ancestral diet (1 P:5 C). To induce metabolic thrift, we maintained flies on a 6 P:1 C diet which was much lower in carbohydrate than the ancestral diet.
The two treatment diets (1 P:9 C and 6 P:1 C) and the ancestral diet (1 P:5 C) were iso-caloric, and formulated from hydrolysed baker’s yeast (P = 45%, C = 24%, Lowan Whole Foods, Glendenning, NSW, Australia), sucrose (S9378, Sigma-Aldrich, Castle Hill, NSW, Australia), casein (P = 73%, C = 0.03%, C7078, Sigma-Aldrich, Castle Hill, NSW, Australia), and agar (P = 0.06%, C = 75%, A9799, Sigma-Aldrich, Castle Hill, NSW, Australia). Ingredients were mixed together to reach a 200 kcal.500 g−1 energy density. The 1 P:9 C diet recipe was 7 g casein, 33 g yeast, 167 g sugar, 8 g agar, 285 mL distilled water; 1 P:5 C was 9 g casein, 60 g yeast, 146 g sugar, 8 g agar, 277 mL distilled water; 6 P:1 C was 200 g casein, 56 g yeast, 9 g sugar, 8 g agar, 228 mL distilled water. Diets were boiled for 3 min and following cooling, 0.25 g.L−1 of antifungal methylparaben ‘Nipagin’ (H5501, Sigma-Aldrich, Castle Hill, NSW, Australia) was added. Before setting, 20 mL of each diet were poured into sterilized 237 mL glass bottles, fitted with sterilized foam stoppers.
4) Selection experiment
A) Selection experiment, no control for parental effects
We established five replicate population bottles for each diet and raised flies concurrently in each environment for 16 generations (see supplementary material figure SM1). Parent flies were not mixed across replicate population bottles at the end of each generation. We aimed to assess how the animals subjected to selection on the treatment diets would respond relative to those maintained simultaneously in the ancestral environment. We controlled for any contribution of temporal effects on variation in lipid storage across treatments by maintaining the population of flies fed the ancestral-diet across the 16 generations simultaneously to the other treatments.
To establish experimental populations, parent flies (≤5 days post-eclosion) were obtained from five of the long-term ‘ancestral’ culture bottles (as described in Flies and Rearing). Parents were lightly anesthetised under CO2, and 100 females and 100 males (selected haphazardly from different stock bottles) were transferred to five sterile 300 mL plastic fly bottles. These bottles were closed with a Petri dish containing an oviposition medium topped with ~0.5 g yeast paste. The oviposition medium was 1.8 g agar, 100 mL distilled water mixed with 1 g golden syrup (CSR, Yarraville, VIC, Australia). To age-stage larvae, after 24 h the oviposition medium and yeast were replaced, and after another 12 h, all first-instar larvae were removed by from the Petri dishes using sterilized, fine-tipped dissection probes under a dissecting microscope [see Citation30]. After a further 3 h, 100 first-instar larvae (all ≤3 h old) were introduced into each of the selection environment bottles using a clean, fine-tipped metal probe [as in Citation30]. A generation within a bottle was defined as the time from being introduced to the experimental diet as a first-instar hatchling, through to five days after the first adults emerged in the bottle. At the end of a generation all adults present within a bottle were lightly anesthetised under CO2 and fifty female adults (chosen haphazardly) from each bottle were transferred to a fresh selection-regime appropriate bottle. Female flies were left to oviposit directly into the fresh diet for 12 h and then removed. The density of resultant larvae was not controlled, though visual observation indicated both this and fecundity were similar across treatments. This means of establishing subsequent generations is ‘quasi-natural selection’. This differs from artificial selection as the experimenter does not screen the parent flies and then select individuals possessing a particular phenotype or suite of phenotypes, for breeding.
To assess changes in lipid-storage over time, we sampled 3 to 6 pupae from each replicate bottle from each environment at the end of generations one, four, eight and sixteen. Pupae within the first 24 h of pupariation were chosen for analysis (this stage is when individuals experience their energy storage peak [Citation31]). Due to the non-comprehensive, pilot nature of this study, pupae were not sexed. Pupae were placed in individual 1.5 mL centrifuge tubes, snap-frozen in liquid-nitrogen, and immediately transferred to −80oC for storage. We measured pupal lipid content as triglycerides (TAG) per unit pupal protein content. All regimes and replicate bottles were maintained across the generations concurrently as where subsequent experiments. For example, the ancestral line reached its ‘generation four’ at the same time as the obesogenic 1 P:9 C line. Please note that as flies developed slightly more quickly in the ancestral and 6 P:1 C environments than in the high-carbohydrate 1 P:9 C environment, there may have been a higher number of younger flies contributing to subsequent generations in the 1 P:9 C regime over-time.
B) Selection experiment, control for parental effects
We also analysed the response of pupae which had potential parental intergenerational effects on lipid-storage expression controlled – thus identifying whether lipid storage was controlled by genetic or un-quantified ‘parental’ effects (e.g. epigenetic – see figure SM1). After 4, 8, and 16 generations of selection in each environment, we raised flies from all environments for an additional generation on the ancestral 1 P:5 C food. We then reared their offspring from hatchling to pupariation back in their designated selection environment and measured lipid storage from resulting pupae. We followed the above protocols for establishing the additional experimental generations. Here we predicted that if parental effects conferred offspring adaptation to the selection regime food (rather than genetic effects) then following this additional generation of rearing on the ancestral diet, any similarity of the lipid storage phenotype of the 1 P:9 C and/or 6 P:1 C line animals to the ancestral line animals would decrease, or be absent.
We commenced these comparisons after four generations of selection in the treatment of nutritional environments to allow some time for adaption to occur.
5) Environmental mismatch between the experienced nutritional environment and that of the recent evolutionary past
A) Mismatch, no control for parental effects
After 16 generations of rearing in the 6 P:1 C selection and 1 P:5 C ancestral environments, we raised flies from first-instar hatchling to pupariation on the 1 P:9 C diet and measured their TAG levels. We also performed the complementary experiment and measured TAG in pupae derived from flies from the 1 P:9 C and ancestral environmental lines that were switched to the 6 P:1 C diet. At generation 16, mated females were collected (as for the previous experiment) from each of the replicate 6 P:1 C or 1 P:9 C bottles five days after the first adults emerged. Without mixing flies from across replicate bottles, fifty 6 P:1 C-raised females were then transferred to five separate bottles containing the 1 P:9 C food, and vice versa. Females were permitted to oviposit for 12 h and then removed. Larvae were allowed to develop to pupariation, and pupae were collected as described above.
B) Mismatch, control for parental effects
These tests were then repeated after controlling for parental effects using the above method. For flies from each rearing environment (1 P:9 C, 6 P:1 C, and 1 P:5 C) at the end of generation 16, an additional generation of flies was reared on the ancestral food, and their offspring’s response to the appropriate test diet was measured. We hypothesized that if parental effects, rather than genetic, were influencing adaptation in either the high-protein or high-carbohydrate environments (as observed in experiment 5a), then the response of pupae from these selection lines would be equivalent to those from the ancestral line.
6) Total body triglycerides (TAG) and body protein
Samples from the selection and mismatch experiments were all stored at −80°C until all described experiments were complete. Pupal triglyceride (TAG) concentration per unit pupal protein concentration was measured for individual pupae using a spectrophotometric method modified from Citation32. Individual pupae were analysed, and we did not use a free-glycerol control (when estimating lipid storage, future workers should quantify animal mono- and diacylglycerides as well as TAG, see [Citation33]). Pupae were homogenized for 40 s over ice in 300 µL of 0.1% Tween-20 solution (a surfactant) in 1.5 mL centrifuge tubes using sterile plastic pestles and a hand-held motorized tissue grinder. To denature endogenous enzymes, samples were then shaken down briefly and placed in a 70°C water bath for 5 min. Samples were then chilled on ice for 2 min, and following cooling, spun down for 2 min at 10 000 g. Approximately 250 µL of the supernatant was removed and transferred to a sterile 1.5 mL centrifuge tube. Next, samples were vortexed for 20 s and then dispensed in 50 µL duplicates into each of two sterile 96-well microplates (Thermo Scientific, EW-01930-13; one plate was for pupal TAG analyses, the other for protein). Pupal TAG levels were measured using the Infinity Triglycerides reagent (Sigma, T2449, St. Louis, USA). Briefly, 200 µL of reagent was added to 50 µL of crushed sample and incubated for 20 min. TAG concentrations were determined at 20 min by comparing absorbance at 540 nm against standard curves formulated using a Sigma TAG analytical standard (Sigma 17,811–1AMP, St. Louis, USA). The TAG concentration for each pupa was subsequently expressed as mg/mL per mg/mL of the pupa’s total body protein. Pupal protein levels were measured using the bicinchoninic acid (BCA) reaction. 200 µL of Pierce BCA Protein Assay reagent (Thermo Scientific, 23,227, Waltham, USA) was added to each 50 µL of sample, and samples were incubated for 30 min. Protein concentrations were measured against curves derived from a bovine serum albumin analytical standard (provided in BCA kit). Protein absorbance was measured at 562 nm. For all spectroscopy work, samples were inter-mixed such that a haphazard subset were analysed during any spectroscopy session reducing temporal bias. Standard curves were re-determined at the beginning of each spectroscopy session (e.g. at the beginning of the day, after lunch, etc.) or whenever a new bottle of lipid or protein standard was opened. Spectroscopy measures were made using a SpectraMax Plus 384 microplate reader (Molecular Devices, Australia).
7) Statistical analyses
For the selection experiments (described in Materials and Methods 4a and b) we used mixed ANOVA in SPSS (ver. 24) and post-hoc sequential t-tests in R (ver. 3.4.0) to test for statistical differences in pupal TAG associated with generation and selection environment (referred to as rearing regime in analyses) and their interaction (generation*rearing regime). Specifically, we tested for whether the selection line individuals commenced the experiment statistically different to those from the ancestral environment at each generational time point, and whether they became statistically equivalent to the ancestral line pupae over time. This approach also controlled for any natural, temporal intergenerational fluctuations in individual TAG levels, that were not strictly due to diet, across the rearing lines. For the selection experiments where parental effects were controlled (see Materials and Methods 4b), we compared ancestral line vs. 1 P:9 C, and ancestral vs. 6 P:1 C responses in two separate ANOVA due to unequal sample sizes between treatment groups at generation 8 (unfortunately numerous partially processed 6 P:1 C samples were dropped in the laboratory, reducing sample size to 3).
For the mismatch experiments (see Materials and Methods 5a and b), we used t-tests in R (ver. 3.4.0) to compare the TAG levels of pupae from different treatment groups.
Prior to conducting the above analyses, modelling indicated that within each selection environment, there was little between population-vial variation (see supplementary material), therefore we treated individual pupae as the unit of replication (also increasing statistical power).
Results
Selection experiment
Selection experiment, no control for parental effects
As predicted, pupal TAG levels in the obesogenic 1 P:9 C high-carbohydrate environment, and the high-protein environment 6 P:1 C initially differed. At the beginning of the experiment, pupae from the 1 P:9 C environment had higher TAG levels than those from the 6 P:1 C line and ancestral (1 P:5 C) diet pupae, which displayed intermediate TAG levels. Over 16 generations of selection, TAG levels from both the 1 P:9 C and 6 P:1 C lines converged towards the ancestral value ().
Figure 1. A) Pupal triglyceride content changes over 16 generations of selection on one of three iso-caloric diets. Triglycerides were measured as total body TAG mg/ml per mg/ml of total body protein. Open triangles show 1 P:9 C (obesogenic diet) raised individuals, open diamonds show those from the lean phenotype inducing 6 P:1 C environment, and black squares show the ancestral (1 P:5 C) environment. Note how the triglyceride content of pupae from treatment strains has converged towards that of the ancestral-strain (black squares) by generation 16. Points show mean ± standard error. B) Triglyceride content of pupae following raised for 16 generations on either the 1 P:9 C, 6 P:1 C or ancestral diet following control for intergenerational parental effects. By generation 16, the pupal triglyceride content of the treatment lines had converged towards the ancestral regime. The 1P:9 C strain triglyceride levels were statistically indistinguishable from the ancestral line from generation 4, however, despite a trend towards convergence, the 6 P:1 C and ancestral line pupae remained significantly different to those from the ancestral group across the experiment. Points show the mean ± standard error
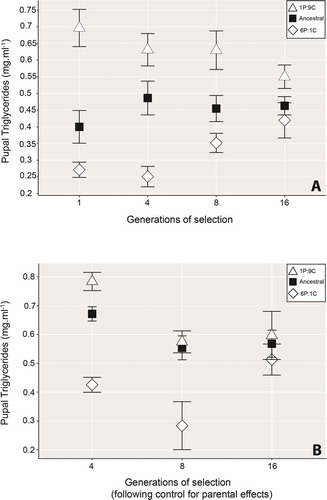
Mixed ANOVA showed that pupal TAG levels significantly differed according to selection regime (Rearing regime: F(2,54)=43.3, P< .001, ). The way the selection regimes differed from one another also changed over generations of selection (Generation*rearing regime: F(6,162)=3.3, P= .004, ). Over time, 1 P:9 C-reared pupae did, as predicted, become ‘obesity resistant’. Following generations of rearing in their high-carbohydrate nutritional environment, TAG reserves were decreased such that by generation 16, they were statistically equivalent to ancestral-line individuals (Generation 16: t= −1.96, df = 31.6, adjusted α = 0.125, P= 0.06, ). The 6 P:1 C selection environment pupal TAG levels showed the opposite pattern, increasing in their TAG levels over time (). While the 6 P:1 C flies appeared to take longer to respond to their treatment diet than the 1 P:9 C line, by generation 16 the 6 P:1 C line pupal TAG was statistically indistinguishable from flies raised on the ancestral food (Generation 16: t= 0.73, df = 31.8, adjusted α = 0.125, P= 0.47, ).
Table 1. Mixed ANOVA comparing changes in pupal TAG content over 16 generation of selection on treatment (1 P:9 C, 6 P:1 C) and ancestral (1 P:5 C) diets with no control for parental effects
Table 2. Sequential Holm alpha-adjusted Welch two sample t-test comparisons showing significant differences in TAG content across 16 generations between a) ancestral vs. 1 P:9 C diets, and b) ancestral vs. 6 P:1 C diets
Selection experiment, control for parental effects
Pupal TAG levels in the high-carbohydrate environment reared animals, that were returned to the ancestral diet for an entire generation after 4, 8, and 16 generations of selection on the 1 P:9 C diet, decreased over time, and converged on the ancestral line pupal TAG by generation 8 (). Statistically, the 1 P:9 C and ancestral regime TAG levels were already equivalent at generation 4, and remained so at generation 8 (Rearing regime: F(1,32)=1.66, P= .207, ; Generation*Rearing regime: F(1.34,42.9)=0.345 P= .62, ).
Table 3. Pupal triglycerides mixed ANOVA analysis comparing flies raised for 16 generations on the 1 P:9 C selection environment vs. the 1 P:5 C ancestral diet (with control for potential parental epigenetic effects). Greenhouse-Geisser corrected degrees of freedom were used, as Mauchly’s test showed significant data sphericity
Pupal TAG levels from flies maintained on the 6 P:1 C diet showed limited convergence towards ancestral-line TAG levels over time (), and remained statistically different to the ancestral line TAG levels across generational time (Generation*Rearing regime: F(1,36)=4.03, P= .052, ).
Table 4. Mixed ANOVA comparing pupal triglycerides levels between ancestral strain flies and those raised on the 6 P:1 C treatment diet over 16 generations (with control for parental effects). Note only generation 4 and 16 data were included in the analysis as 6 P:1 C treatment group N for generation 8 was only 3
Nutritional environment mismatch experiment
Mismatch, no control for parental effects
Despite 16 generations of selection in the 1 P:9 C environment, when fed the 6 P:1 C diet, TAG levels in pupae from both the 1 P:9 C and the ancestral nutritional environment, were statistically equivalent, both demonstrating a lean phenotype (, t= 0.39, df = 15.9, P= .699, ).
Table 5. T-tests results for the mismatch, no control for parent effects experiement comparing a) triglyceride content of pupae fed the 6 P:1 C diet from hatchling to pupariation, following 16 generations of rearing on either the 1 P:9 C treatment diet, or the 1 P:5 C ancestral diet, and b) pupal triglycerides from individuals reared for the previous 16 generations on either a 6 P:1 C diet or the ancestral 1 P:5 C diet, and then fed the 1 P:9 C diet from hatchling to pupariation
Figure 2. A) Triglyceride content of pupae raised from hatch to pupariation on the 6P:1 C diet following 16 generations of rearing in either the 1 P:9 C (open triangles) or the ancestral environment (black squares). Despite being exposed to different food environments for 16 generations of quasi-natural selection, there was no significant difference between the strains in their response to the low-protein food. B) Pupal triglyceride storage response of individuals raised for 16 generations in either the 6 P:1 C selection environment (open diamonds) or the ancestral environment (black squares), who were then raised from hatch to pupariation on the high-carbohydrate 1 P:9 C food. Contrary to our prediction, rather than being significantly ‘fatter’ than the ancestral-strain pupae, individuals from the 6 P:1 C environment subsequently fed the ‘obesogenic’ food were significantly leaner than their ancestral-line counterparts. In both panels, points show the mean ± standard error
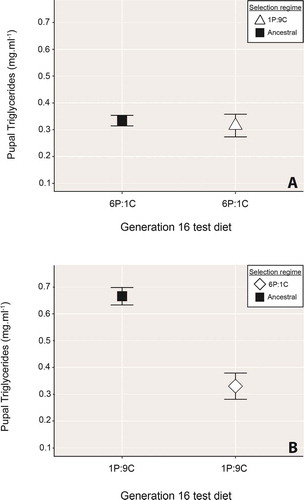
Results for those flies raised for 16 generations on the ‘metabolic thrift’ promoting 6 P:1 C diet were counter to predictions from ‘thrifty geno/phenotype’ hypotheses. Flies raised for 16 generations on the 6 P:1 C food, and then fed (from hatch to pupariation) on the ‘obesogenic’ 1 P:9 C food were significantly leaner than their ancestral-line counterparts, rather than ‘fatter’ as theory would have predicted (, t= 5, .7, df = 20.2, P< .0001, ).
Mismatch, control for parental effects
We found no difference between ancestral-line flies and those raised for 16 generations in the 1 P:9 C environment in pupal TAG levels following feeding on the 6 P:1 C food after controlling for parental effects (, t= −0.59, .7, df = 38.7, P= .5565, ).
Table 6. T-test results for mismatch, control for parental effects comparison of a) pupal triglycerides from individuals raised for 16 generations on either the 1 P:9 C food or the ancestral diet and, following control for parental effects, fed the 6 P:1 C food from hatch, and b) the triglyceride level of pupae similarly tested but raised for 16 generations on the 6 P:1 C diet instead
Figure 3. Triglyceride levels from pupae raised for 16 generations in either the 1 P:9 C (open triangles) or the 6 P:1 C (open diamonds) selection environment and then tested for their response to the 6 P:1 C or 1 P:9 C food, respectively. Panel a) shows the response of 1 P:9 C raised individuals compared to those of the ancestral line (black squares), while b) compares the response of pupae from the 6 P:1 C environment against ancestral-line reared pupae. In neither experiment did the treatment selection regime pupae differ significantly in their responses to flies from the ancestral environment. For both panels, data points show the mean ± standard error
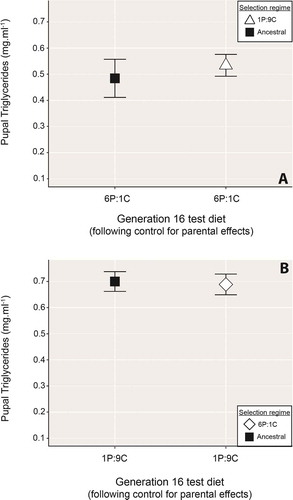
Similarly, there was no significant difference between the 16 generation-reared ancestral line and 6 P:1 C strain flies in their pupal TAG following
feeding on the 1 P:9 C diet (, t= 0.20, df = 49.99, P= .8401, ). Considering this result in conjunction with the associated experiment where long-term 6 P:1 C reared flies were fed the ‘obesogenic’ 1 P:9 C food without control for parent effects (), indicates parental effects may be necessary for conferring leanness under high-carbohydrate feeding in long-term 6 P:1 C reared D. melanogaster.
DISCUSSION
Our results confirm that both metabolic thrift and obesity resistance can evolve in Drosophila. Over the course of 16 generations, the initially lean population maintained in the 6 P:1 C nutrient environment re-gained ancestral-line equivalent fat reserves. The 1 P:9 C population meanwhile became progressively ‘thinner’ despite their continual exposure to an obesogenic high-carbohydrate, low-protein nutritional environment.
The convergence of the triglyceride levels of both treatment groups onto that of the long-term ancestral diet raised flies, suggests that D. melanogaster has an optimal, target adipose content for pupae. This result also indicates the species has adaptive homoeostatic systems that are responsive to physiological costs imposed by stressful nutritional environments, and that these systems are capable of mitigating those costs over evolutionary time [Citation34].
While these preliminary findings require further study, the results are similar to those of Warbrick-Smith et al.[Citation3]. The fat levels of selection regime animals converged slightly towards those of the ancestral line flies when parental effects were controlled (), suggesting obesity-resistance and metabolic thrift could be under some genetic control, though a contribution of intergenerational parental effects seems likely. Recent work on a range of animal species indicates TOR [Citation35–37] and insulin signalling [Citation37,Citation38] in response to dietary stressors can alter fatty acid synthase expression and TAG accumulation [Citation39,Citation40]. Future studies working with Drosophila as a model should focus on these pathways when investigating the genetic and epigenetic mechanistic underpinnings of the responses reported here.
Contrary to our prediction derived from the ‘thrifty genotype’ or ‘thrifty phenotype’ hypotheses for human obesity [Citation1,Citation10], when flies from the metabolic thrift inducing 6 P:1 C environment were mismatched to the fattening 1 P:9 C food, they did not become obese. In fact, they accumulated less triglyceride than control animals, not more. This may indicate multiple generations of high-protein rearing induces habitual leanness, irrespective of diet at the next generation. Interestingly, this response was lost after a single generation of rearing on an ancestral diet, possibly indicating the role of a predictive adaptive response [PAR, see Citation41, Citation42] to the mismatch, and physiological avoidance of the fitness costs associated with obesity – again this potential requires further investigation.
Our study shows that metabolic thrift and is ‘opposite’ phenotype, obesity resistance can evolve. However, according to our experiments, these evolved physiological traits do not become handicaps in terms of animal adipose health following nutritional environmental mismatches. While we are not suggesting our study is a test of any of the thrifty genotype, phenotype or epigenome hypotheses, our work does reject these hypotheses’ inherent idea that contemporaneous exposure to a ‘fattening’ environment, following multi-generational exposure to one inducing leanness, predisposes animals to obesity. Our findings support the work of authors looking for alternative explanations to the concept of nutritional environment ‘mismatch’ for the obesity epidemic [e.g. Citation21].
Note that it is important that future studies incorporate sex as a separate factor when assessing intergenerational effects of diet on Drosophila metabolism. Recent work on Diptera species demonstrates that larval and adult diets interact with sex in complex ways. Larval Queensland fruit-fly reared on sucrose-based diets, rather than maltose or lactose based foods, exhibit a female-biased emergence, and sucrose-reared females eclose earlier than those raised on other diets [Citation43]. This also occurs in D. suzukii where those developing on cherries rather than on strawberries exhibit earlier, female-biased emergence [Citation44]. Drosophila melanogaster larvae fed very high-carbohydrate foods of similar composition to our obesogenic diet, displayed delayed developmental time, and high-mortality as compared to those reared on iso-caloric high-protein foods [Citation45]. While emergent fly sex or survival was not measured here, if similar sex-by-diet interactions occurred in our system, it is possible that at different time-points within each experimental generation (which we designated as five days following the first adult eclosion) that the sex-ratio, age-profile, and total number of each sex differed across our diet-treatments. Future work should quantify these potential differences, as adult mating age is already known to impact offspring sex-ratio and performance in flies [Citation46,Citation47]. How these un-quantified interaction effects might accrue across generations, and their potential influence on metabolism and lipid-storage phenotypes, is unknown.
It should also be stressed that while we treated individual larvae as the unit of replication in these pilot analyses, there were some minor replicate population (bottle) effects (see supplementary material). This suggested that despite originating from extremely closely related parental stock, our laboratory populations still possessed capacity for disparate evolution in response to equivalent selection environments. Future workers should incorporate replicate rearing lines as covariates in their analyses.
Conclusions
We have demonstrated that obesity resistance and metabolic thrift can evolve in Drosophila, highlighting the utility of the fly as a model for investigating the evolutionary and molecular bases of obesity. We have also shown that contrary to the predictions of the ‘thrifty genotype/phenotype’ hypotheses, evolving a thrifty metabolism does not predispose animals to high adiposity when they are subsequently fed fattening food. In our study, high-protein selection instead induced preserving leanness in the face of high-carbohydrate feeding, which appeared to be under some important degree of control by parental effects.
DATA AVAILABILITY
Please contact corresponding author for data access.
Supplemental Material
Download MS Word (135.1 KB)Acknowledgments
LJG would like to thank A. Gray, H. Walters, A. Belay, M. Renner, V. Pham, X. Clark, T. Pulpitel, F. Ponton, and A. Cease.
Supplemental material
Supplemental data for this article can be accessed here.
Additional information
Funding
References
- Stöger R. The thrifty epigenotype: an acquired and heritable predisposition for obesity and diabetes? Bioessays. 2008;30(2):156–166.
- Kristensen TN, Overgaard J, Loeschcke V, et al. Dietary protein content affects evolution for body size, body fat and viability in Drosophila melanogaster. Biol Lett. 2011;7(2):269–272.
- Warbrick-Smith J, Behmer ST, Lee KP, et al.. Evolving resistance to obesity in an insect. Proc Nat Acad Sci. 2006;103(38):14045–14049.
- De Carvalho MJA, Mirth CK. Food intake and food choice are altered by the development transition at critical weight in Drosophila melanogaster. Animal Behaviour. 2017;126: 195–208. DOI:https://doi.org/10.1016/j.anbehav.2017.02.005
- Simpson SJ, Raubenheimer D. Obesity: the protein leverage hypothesis. Obesity Rev. 2005;6(2):133–142.
- Brand-Miller JC, Holt SHA, Pawlak DB, et al.. Glycemic index and obesity. Am J Clin Nutr. 2002;76(1):281S–285S.
- Kusminski CM, Bickel PE, Scherer PE. Targeting adipose tissue in the treatment of obesity-associated diabetes. Nat Rev Drug Discov. 2016;15:639–660.
- Llewellyn A, Simmonds M, Owen CG, et al.. Childhood obesity as a predictor of morbidity in adulthood: a systematic review and meta-analysis. Obesity Rev. 2016;17(1):56–67.
- Zheng R, Zhou D, Zhu Y. The long-term prognosis of cardiovascular disease and all-cause mortality for metabolically healthy obesity: a systematic review and meta-analysis. Epidemiology & Community Health. 2016;70(10):1024–1031. DOI:https://doi.org/10.1136/jech-2015-206948
- Power ML, Schulin J. The Evolution of Obesity. The John Hopkins University Press: Baltimore, Maryland, USA; 2009.
- Wells JCK. The evolution of human adiposity and obesity: where did it all go wrong?. Dis Model Mech. 2012;5(5):595–607.
- Neel V. Diabetes mellitus: a “thrifty” genotype rendered detrimental by “progress”?. Am J Hum Genet. 1962;14:353–362.
- Prentice AM, Rayco-Solon P, Moore SW. Insights from the developing world: thrifty genotypes and thrifty phenotypes. Proc Nutr Soc. 2005;64(2):153–161.
- Raubenheimer D, Machovsky-Capuska GE, Gosby AK, et al.. Nutritional ecology of obesity: from humans to companion animals. Br J Nutr. 2015;113(S1):S26–S39.
- Raubenheimer D, Simpson SJ. Nutritional ecology and human health. Annu Rev Nutr. 2016;36(1):603–626.
- Speakman JR, Westerterp KR. A mathematical model of weight loss under total starvation: evidence against the thrifty-gene hypothesis. Dis Models Mech. 2013;6(1):236–251.
- Hales CN, Barker DJ. Type 2 (non-insulin-dependent) diabetes mellitus: the thrifty phenotype hypothesis. Diabetologia. 1992;35(7):595–601.
- Prentice AM, Hennig BJ, Fulford AJ. Evolutionary origins of the obesity epidemic: natural selection of thrifty genes or genetic drift following predation release?. Int J Obesity. 2008;32(11):1607–1610.
- Speakman JR. Thrifty genes for obesity, an attractive but flawed idea, and an alternative perspective: the ‘drifty gene’ hypothesis. Int J Obesity. 2008;32(11):1611–1617.
- Krams I, Rantala MJ, Luoto S, et al.. Fat is not just an energy store. J Exp Biol. 2018;221(12):jeb183756.
- Speakman JR. The evolution of body fatness: trading off disease and predation risk. J Exp Biol. 2018;221(Suppl 1):jeb167254.
- Elchebly M, Payette P, Michaliszyn E, et al.. Increased insulin sensitivity and obesity resistance in mice lacking the protein tyrosine Phosphatase-1B gene. Science. 1999;283(5407):1544–1548.
- Liu J, Li T, Yang D, et al.. Synphilin-1 alters metabolic homeostasis in a novel Drosophila obesity model. Int J Obesity. 2012;36(12):1529–1536.
- Pelleymounter MA, Cullen MJ, Baker MB, et al.. Effects of the obese gene product on body weight regulation in ob/ob mice. Science. 1995;269(5223):540–543.
- Rankinen T, Zuberi A, Chagnon YC, et al.. The human obesity gene map: the 2005 update. Obesity. 2006;14(4):529–644.
- Smith SJ, Cases S, Jensen DR, et al.. Obesity resistance and multiple mechanisms of triglyceride synthesis in mice lacking Dgat. Nat Genet. 2000;25(1):87–90.
- Tateishi K, Okada Y, Kallin EM, et al.. Role of Jhdm2a in regulating metabolic gene expression and obesity resistance. Nature. 2009;458(7239):757–761.
- Ugrankar R, Liu Y, Provaznik J, et al.. Lipin is a central regulator of adipose tissue development and function in Drosophila melanogaster. Mol Cell Biol. 2011;31(8):1646–1656.
- Brookheart RT, Duncan JG. Drosophila melanogaster: an emerging model of transgeneration effects of maternal obesity. Mol Cell Endocrinol. 2016;435:20–28.
- Anreiter I, Vasquez OE, Allen AM, et al.. Foraging Path-length Protocol for Drosophila melanogaster larvae. J Visualized Exp. 2016;110:e53980.
- Butterworth FM, Bodenstein D, King RC. Adipose tissue ofDrosophila melanogaster. I. An experimental study of larval fat body. J Exp Zool. 1965;158(2):141–154.
- Kaun KR, Chakaborty-Chatterjee M, Sokolowoski MB. Natural variation in plasticity of glucose homeostasis and food intake. J Exp Biol. 2008;211(19):3160–3166.
- Tennessen JM, Barry WE, Cox J, et al.. Methods for studying metabolism in Drosophila. Methods. 2014;68(1):105–115.
- Raubenheimer D, Simpson SJ, Le Couteur DG, et al.. Nutritional ecology and the evolution of aging. Exp Gerontol. 2016;86:50–61.
- Arganda A, Bouchebti A, Bazazi S, et al.. Parsing the life-shortening effects of dietary protein: effects of individual amino acids. Proc R Soc B. 2017;284(1846):20162052.
- Lynch CJ, Adams SH. Branch-chain amino acids in metabolic signalling and insulin resistance. Nat Rev Endocrinol. 2014;10(12):723–736.
- Xiao F, Yu J, Guo Y, et al.. Effects of individual branch-chain amino acids deprivation on insulin sensitivity and glucose metabolism in mice. Metabolism. 2014;63(6):841–850.
- Fontana L, Cummings NE, Arriola Apelo SI, et al.. Decreased consumption of branched-chain amino acids improves metabolic health. Cell Rep. 2016;16(2):520–530.
- Birse RT, Choi J, Reardon K, et al.. High-fat-diet-induced obesity and heart dysfunction are regulated by the TOR pathway in Drosophila. Cell Metab. 2010;12(5):533–544.
- Diop SB, Bisharat-Kernizan J, Birse RT, et al.. PGC-1/Spargel counteracts high-fat-diet induced obesity and cardiac lipotoxicity downstream of TOR and Brummer ATGL lipase. Cell Rep. 2015;10(9):1572–1584.
- Bateson P, Gluckman P, Hanson M. The biology of developmental plasticity and the predictive adaptive response hypothesis. J Physiol. 2014;592(11):2357–2368.
- Gluckman PD, Hanson MA. The developmental origins of the metabolic syndrome. Trends Endocrinol Metab. 2004;15(4):183–187.
- Morimoto J, Nguyen B, Lundbäck I, et al.. Effects of carbohydrate types on larval development and adult traits in a polyphagous fruit fly. J Insect Physiol. 2020;120:103969.
- Mendonca LP, Oliveira EE, Andreazza F, et al.. Host potential and adaptive responses of Drosophila suzukii (Diptera: drosophilidae) to Barbados cherries. J Econ Entomol. 2019;116(6):3002–3006.
- Kim K, Jang T, Min K-J, et al.. Effects of dietary protein:carbohydrate balance on life-history traits in six laboratory strains of Drosophila melanogaster. Entomol Exp Appl. 2019;168(6–7):482–491.
- Long TAF, Pischedda A. Do female Drosophila melanogaster adaptively bias offspring sex ratios in relation to the age of their mate? 2005;272:1781–1787. Proceedings of the Royal Society: B.
- Nguyen B, Ponton F, Than A, et al.. Interactions between ecological factors in the developmental environment modulate pupal and adult traits in a polyphagous fly. Ecol Evol. 2019;9(11):6342–6352.