
ABSTRACT
To maintain homoeostasis, cells must degrade damaged or misfolded proteins and synthesize functional replacements. Maintaining a balance between these processes, known as protein turnover, is necessary for stress response and cellular adaptation to a changing environment. Damaged mitochondria must also be removed and replaced. Changes in protein and mitochondrial turnover are associated with aging and neurodegenerative disease, making it important to understand how these processes occur and are regulated in cells. To achieve this, reliable assays of turnover must be developed. Several methods exist, including pulse-labelling with radioactive or stable isotopes and strategies making use of fluorescent proteins, each with their own advantages and limitations. Both cell culture and live animals have been used for these studies, in systems ranging from yeast to mammals. In vivo assays are especially useful for connecting turnover to aging and disease. With its short life cycle, suitability for fluorescent imaging, and availability of genetic tools, Drosophila melanogaster is particularly well suited for this kind of analysis.
Decreased protein and mitochondrial turnover during aging
Cellular proteins are susceptible to numerous types of damage, including hydrolysis, oxidative damage, glycation, cross-linking, denaturation and aggregation [Citation1,Citation2]. Damaged, denatured and aggregated proteins are toxic to the cell (proteotoxicity) through loss of protein function, disruption of membrane structure and trafficking, production of reactive oxygen species, and other mechanisms, often leading to cell death [Citation3]. Degradation of damaged proteins is therefore essential for normal cell function and cell survival in response to both extrinsic and intrinsic stress. In addition, many cellular proteins are inherently short-lived, even in the absence of damage. These short-lived proteins include multiple signalling pathway components and transcription factors, thereby enabling the cell to rapidly respond to a changing environment [Citation4,Citation5]. Protein turnover rates are regulated by primary sequence motifs of the native protein (degrons) which are recognized by degradation pathway components, as well as by the expression levels of degradation pathway components in the cell, and the susceptibility of the protein to damage and denaturation which in turn acts as a signal for degradation [Citation6–8]. Even under normal conditions, a significant fraction of newly synthesized proteins fail to fold correctly and are rapidly degraded. As a consequence, selection for efficient protein synthesis and folding appears to be a major driver of coding sequence evolution [Citation9].
Cytosolic proteins are degraded by the proteasome [Citation7,Citation10,Citation11], autophagy and chaperone-mediated autophagy (CMA) pathways [Citation12,Citation13], as well as by import into the mitochondria and degradation by Lon protease [Citation14,Citation15]. Peripheral and embedded mitochondrial outer membrane proteins are also degraded by the proteasome, whereas internal mitochondrial proteins are degraded by resident mitochondrial proteases including Lon, CLPXP, i-AAA and m-AAA [Citation16,Citation17]. Finally, the degradation of whole or fragmented mitochondria is mediated by a macroautophagy pathway, often called mitophagy [Citation13,Citation18].
The dynamic regulation of protein synthesis, degradation, conformation, quaternary structure and localization has been termed proteostasis [Citation19]. Molecular chaperones, including the heat shock proteins (Hsps), facilitate protein folding, maintenance of tertiary and quarternary structure and facilitate entry of denatured and damaged proteins into degradation pathways [Citation20–22]. Disruptions of proteostasis, including decreased activity of degradation pathways and misregulation of protein folding, are increasingly implicated in aging and aging–associated disease [Citation23–25]. Indeed, the accumulation of abnormal proteins, as indicated by inactive enzymes, was one of the first molecular changes characterized for aging metazoans [Citation26]. Since then, a decreased rate of protein synthesis and degradation has been found to be a common feature of aging across species [Citation27,Citation28]. Hsp genes are induced in response to the accumulation of denatured proteins, and induction of fluorescent Hsp transgenic reporters in young, unstressed animals is predictive of shorter remaining life span in both Drosophila and C. elegans [Citation29,Citation30]. Importantly, the aging-associated diseases Alzheimer’s disease, Parkinson’s disease, Huntington disease and amyotrophic lateral sclerosis each involve accumulation of abnormally processed and/or aggregated proteins and consequent proteotoxicity [Citation31].
The target of rapamycin (TOR) pathway has been found to be a conserved regulator of protein metabolism. The mammalian TOR (mTOR) complex 1 (mTORC1) increases protein synthesis by activating translation, and inhibits protein breakdown by inhibiting autophagy and lysosome biogenesis [Citation32]. Notably, inhibition of the conserved TOR pathway has been found to increase life span in multiple species, including yeast, C. elegans, Drosophila, and mice [Citation33]. The increased life span due to TOR pathway inhibition has been hypothesized to be due to reduced translation, and therefore reduced toxicity due to co-translational protein misfolding and aggregation, and the consequent increased availability of chaperones and protein degradation components [Citation20,Citation21,Citation34–36]. Inhibition of the TOR pathway is also hypothesized to increase life span by increasing autophagy, and therefore the clearance of toxic protein aggregates and damaged mitochondria [Citation37,Citation38]. Consistent with this idea, the autophagy pathway is required for life span extension caused by multiple interventions, including dietary restriction (DR), decreased insulin/IGF-1 signalling (IIS) and mitochondrial ETC gene mutations [Citation39–41]. In summary, the decreased rate of protein synthesis and degradation observed during aging appears to be toxic, whereas decreased protein synthesis in young animals caused by inhibition of the TOR pathway appears to be beneficial, in part due to concomitant upregulation of autophagic degradation mechanisms. Recently, the rate of protein turnover has been implicated in regulating differences in the timing of development across species [Citation42,Citation43], and is reported to be negatively correlated with species differences in life span [Citation44].
The mitochondria have emerged as a key regulator of aging and aging-associated proteostasis disruption [Citation17,Citation45]. Mitochondrial gene expression progressively declines with age across multiple species, including Drosophila and humans [Citation46,Citation47]. This is associated with decreased basal metabolic rate and decreased rate of protein and mitochondrial turnover, leading to longer-lived and more damage-prone proteins and mitochondria. In addition, increased oxidative stress from damaged mitochondria further exacerbates protein damage [Citation48]. The abundance of mitochondria, as indicated by mtDNA copy number, has emerged as a determinant in human disease [Citation49].
Critical to the study of protein homoeostasis and aging are methods for assaying protein half-life in vivo in young and old animal tissues. Here we review the determinants of protein turnover and the methods for assay of protein half-life, with an emphasis on methods applicable to whole animals, including the model organism Drosophila melanogaster.
Mechanisms of protein and mitochondrial turnover
Protein turnover refers to the balance of synthesis of new proteins and degradation of old or damaged ones. Proteins are degraded by two main cellular systems: the ubiquitin-proteasome system (UPS) and the lysosomal system/autophagy. In order to be degraded, proteins must be recognized and transported to a compartment where they are broken down by proteases. In the case of UPS, this is the proteasome; for autophagy, it is the lysosome. UPS tends to operate with more precision, and mostly targets short-lived proteins [Citation50]. It can target proteins in the cytosol as well as within the mitochondria and endoplasmic reticulum.
Proteins are targeted to the proteasome by the addition of ubiquitin, a small and highly conserved protein. The system utilizes three different families of enzymes to accomplish this. First, an E1 enzyme activates ubiquitin in an ATP-dependent reaction. The activated ubiquitin is then transferred to the active site of an E2 ubiquitin-conjugating enzyme, which binds to an E3. Finally, this E3 ubiquitin ligase is directly responsible for transferring ubiquitin to the protein target. There exists a wide variety of E3 ligases with specificity for different protein targets and types of ubiquitin chains, discussed further below. Ubiquitin generally attaches to a lysine; however, when this is not possible it can also be conjugated to the amino terminus of a protein. Because ubiquitin itself contains seven lysines, ubiquitin molecules can attach to each other to form polyubiquitin chains. Typically, chains of four or more lysines are preferred for recognition by the proteasome, but lengths can vary. The position at which ubiquitin molecules attach to each other also varies, and these differences can affect both the efficiency of recognition by the proteasome as well as the kinetics of degradation. Linkage at K48 is both the most common and the most rapidly recognized and degraded.
The 26S proteasome is composed of two major parts: the core particle and the regulatory particle [Citation10]. The 20S core particle is the catalytic core where degradation takes place. Within the core particle, two outer alpha rings control entry into the inner portion, which is formed by two beta rings with proteolytic active sites in the interior. One or both ends of the core particle are capped by a 19S regulatory particle. The regulatory particle unfolds substrate proteins and transfers them into the core particle [Citation51]. Most substrates are recognized by ubiquitin receptors at the regulatory particle, though there are also shuttle factors which transport more distant substrates. These contain ubiquitin-associated and ubiquitin-like domains which interact with the substrate and the proteasome, respectively. In the regulatory particles, deubiquitinating enzymes (DUBs) disassemble the polyubiquitin chain, recycling ubiquitin before the protein reaches the catalytic core.
The lysosomal system is less selective than UPS, and is associated with bulk degradation of proteins and whole organelles [Citation50]. There are different types of autophagy, though all involve delivery of degradation targets to the lysosome. A lysosome is a single-membraned vesicle containing a variety of hydrolases, including proteases, which function optimally in the acidic environment of its lumen. The method of delivery varies and is classified as follows: in macroautophagy, a region of the cytosol is enclosed in a double-membraned vesicle called an autophagosome, which then fuses with the lysosome. The resulting fused compartment is called the autophagolysosome. In microautophagy, a portion of the cytosol is sequestered directly by the lysosome in a single-membraned vesicle. Finally, a third type known as chaperone-mediated autophagy involves recognition of a substrate by chaperone proteins in the cytosol. A translocation complex forms at the lysosomal surface to transport individual proteins to the interior. This is a mechanism by which autophagy can occur with higher specificity. Proteins are unfolded in the process of translocation. Chaperone-mediated autophagy is upregulated under stressful conditions.
The degradation of whole mitochondria, known as mitophagy, is a subtype of macroautophagy [Citation18]. This process eliminates damaged or dysfunctional mitochondria. Because the mitochondria naturally incur oxidative damage over time, this process is vital to ensure continuing mitochondrial function. One pathway for mitophagy is triggered by cellular stress and mediated by phosphate and tensin (PTEN) homologue-induced kinase 1 (PINK1) and Parkin [Citation52]. PINK1 is constitutively produced, but under normal conditions it is translocated into the mitochondria and processed by the mitochondrial proteases mitochondrial processing peptidase (MPP) and presenilin-associated rhomboid-like protein (PARL), and then retrotranslocated to the cytosolic side of the outer membrane where it is degraded by the 26S proteasome [Citation53,Citation54]. Cellular stress or mitochondrial malfunction causes depolarization of the outer mitochondrial membrane which prevents translocation of PINK1, resulting in its stabilization. Accumulated PINK1 phosphorylates outer mitochondrial membrane proteins. These targets include mitofusin 2 (Mfn2), which recruits the ubiquitin ligase Parkin to the mitochondria, where it too is phosphorylated by PINK1. Parkin then ubiquitinates outer mitochondrial membrane proteins, including proteins involved in fusion. Parkin also recruits autophagy adaptor proteins that facilitate interaction between the autophagosome and the target mitochondrion. Mitophagy requires promotion of mitochondrial fission and prevention of fusion; proteins that promote fusion are ubiquitinated and destroyed as part of this process, while fission is an essential step in mitophagy [Citation55]. There is also evidence of constitutive mitophagy in the absence of mitochondrial damage, and this can proceed independently of PINK1 and Parkin [Citation56].
Individual mitochondrial proteins can be degraded with higher specificity; as a result, mitochondrial proteins differ in their rate of turnover [Citation57,Citation58]. This can be mediated by mitochondrial proteases or proteasomal degradation. Peripheral and embedded mitochondrial outer membrane proteins are degraded by the proteasome, whereas internal mitochondrial proteins are degraded by resident mitochondrial proteases. The i-AAA protease is localized to the inner mitochondrial membrane, and degrades damaged and misfolded proteins from the inner mitochondrial membrane, the intermembrane space, and the outer mitochondrial membrane. The m-AAA protease is localized to the inner mitochondrial membrane and degrades damaged and misfolded proteins from the inner mitochondrial membrane and the mitochondrial matrix. Finally, the LON and CLPXP proteases are localized to the mitochondrial matrix and degrade damaged and misfolded matrix proteins [Citation16,Citation17],
Primary sequence determinants of protein turnover
While it is not currently possible to predict half-life from sequence alone, and there are many environmental factors influencing half-life in vivo, there are nonetheless identifiable sequence determinants of protein half-life. Known as degrons, these sequences are recognized by recognins, often E3 ubiquitin ligases. Different recognins have specificity for different degrons. A sequence is considered a degron when it is sufficient for degradation; when a degron from a short-lived protein is added to a longer-lived one, it confers a shorter half-life [Citation59]. The first degrons to be discovered were located at the N-terminal end of short-lived proteins. Initially, it was thought that only certain residues at the N-terminus could act as degradation signals. However, degrons can also be found at the C-terminus or an internal location [Citation6]. Also, contrary to earlier beliefs, it was later found that any of the 20 amino acids can act as part of a degron in the right sequence context.
Multiple components comprise a degron. The primary recognition determinant is the region which interacts directly with the corresponding recognin. Ubiquitin is often attached to lysine, so the presence of a nearby lysine residue is also important for proper degradation. Degrons often begin as pro-degrons, which are converted into working degradation signals by cleavage (e.g. removal of an N-terminal methionine) or post-translational modification (e.g. acetylation, deamidation, arginylation, leucylation or formylation) [Citation6]. When degrons that are normally inaccessible to recognins are revealed, for example, by a protein becoming unfolded or a complex disassembling, they can be recognized. This is a mechanism by which unfolded or misfolded proteins are removed by the cell. There are a number of distinct pathways which target different classes of degrons. These can be characterized by the location of their target (N-terminus, C-terminus, or internal) and distinguishing features of the pathway. For example, the Arg/N-degron pathway targets degrons at the N-terminus and includes a step of arginylation of the N-terminal residue [Citation60].
Protein turnover analyses and modelling
The different procedures for measuring protein half-life involve different solutions to two basic requirements – a method to detect the protein, and a method to create a pulse of protein expression or protein marking to allow assay of decay kinetics. Once the protein concentration has been determined over multiple time points of the decay period, the half-life can be determined. Originally, this was done by plotting log protein concentration versus time and conducting a linear regression with the least-squares approach, and more recently, by fitting the data to the exponential decay equation using a non-linear least squares approach. Pioneering studies used cell extracts and enzyme activity as the assay. These studies showed that protein half-lives vary greatly, that the same protein can have different half-lives in different tissues, and that different proteins from the same organelle, such as the mitochondria, can have different half-lives [Citation61]. In vivo studies have used a variety of approaches to solve the problem of protein marking in time and space [Citation62].
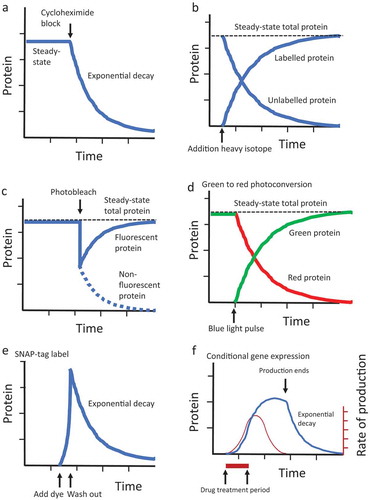
Cycloheximide is a powerful way to stop further protein production and enable assay of decay rate in vivo (). For example, by using an antibody to mark in situ ftz protein abundance in Drosophila embryos, injection of cycloheximide revealed an initial half-life for ftz protein of approximately 6 minutes [Citation63]. One potential limitation of the cycloheximide approach is that it stops production of all proteins, including ones regulating turnover, and might therefore alter normal turnover rates.
Figure 1. Overview of methods for calculating protein half-life in cells and organisms
Another approach is to pulse-label the protein, for example, with radioactive or heavy-isotope precursor. In a pioneering study, Maynard-Smith and co-workers analysed protein half-life in adult male Drosophila that were pulse-labelled with tritiated leucine. They reported that the rate of protein turnover was greatest in the wall of the mid-gut, with an average half-life of approximately 10 days, and relatively undetectable in thoracic flight muscle [Citation64]. One potential problem with pulse-label is the potential recycling and re-incorporation of the label after protein degradation, which can lead to an over-estimation of protein half-life for short-lived proteins [Citation61]. One way to decrease this effect is to follow the pulse with a chase consisting of a large concentration of unlabelled precursor (the ‘pulse-chase’ approach), which will decrease the chances for re-incorporation of labelled precursor.
Continuous feeding of cultured cells or intact animals with a heavy-isotope labelled precursor allows for incorporation of heavy isotope into newly synthesized proteins. Isolation and purification of protein from the cells or tissues followed by mass spectrometry allows for identification of the protein, and determination of the ratio of unlabelled to labelled protein. The assay of the ratio across multiple time points, and fitting the data to the exponential decay equation, allows calculation of the half-life for each protein [Citation44,Citation65] (); alternatively, relative protein turnover rates can be expressed as the time it takes for half the protein to become labelled [Citation66]. One limitation of this approach is that for dividing cells, protein half-life typically cannot be measured for proteins that turn over more slowly than the cell division rate [Citation67].
Fluorescent proteins inherently solve the problem of protein detection because they absorb light at one wavelength and emit light at another wavelength. The fluorescence can be quantified in cells or tissues using fluorescence microscopy or video imaging, enabling non-destructive and non-invasive read-out of protein abundance. The pioneering protein was green fluorescent protein (GFP) which absorbs blue light and emits green [Citation68,Citation69]. Since then a rainbow of fluorescent proteins have been developed with a large variety of specific absorption and emission spectra [Citation70,Citation71], and with a wide variety of half-lives within the cell. For example, in cultured Drosophila S2 cells, DsRED half-life is approximately 8.1 days, whereas eGFP half-life is approximately 3.8 days [Citation72].
One way to mark proteins to enable an assay of turnover is to conditionally activate or inactivate fluorescence of the protein by altering its structure [Citation73]. For example, in one application of the ‘bleach-chase’ approach, an endogenous cellular protein is tagged by the insertion of YFP sequences into an internal exon [Citation67]. A pulse of light inactivates the YFP fluorophore in a subset of the protein molecules, resulting in fluorescent and non-fluorescent protein fractions. The amount of unlabelled protein is calculated by subtracting the observed fluorescence values for bleached and unbleached cells. As the unbleached protein is degraded and replaced by a newly synthesized fluorescent protein, the fluorescence of the cell increases, and the rate of increase across time points allows for the calculation of protein half-life (). The bleach-chase approach has been used to determine a half-life of 2.77 hours for the Hth protein in developing Drosophila eye tissues [Citation74].
Similarly, certain proteins can be marked by fluorescence by photoactivation or photoconversion. Illumination of the protein with light of a specific wavelength causes the spectral properties of the protein to change. For example, the activation of the Dendra protein with blue light causes the protein to convert from green fluorescence to red fluorescence [Citation75]. The assay of the ratio of red/green fluorescence by time-lapse fluorescence microscopy allows assay of the decay rate of red protein and the rate of synthesis of new green protein (). Dendra has been used in Drosophila to characterize the low turnover rates of septate junction proteins in larvae, by fusing the proteins to Dendra [Citation76].
Protein fluorescence can also be activated using the SNAP-tag method [Citation77]. SNAP-tag is an engineered version of the DNA repair enzyme O6-alkylguanine DNA-alkyltransferase (AGT) that can be fused to endogenous proteins by knock-in, or expressed as transgenic fusions. AGT will attach to benzylguanine (BG) derivatives that have been linked to a fluorescent molecule. The fluorescent BG derivative is cell-permeable, and therefore exposing cells or tissues with the derivative fluorescently labels the protein, and the decay rate of the protein can then be assayed by time-lapse fluorescence microscopy (). SNAP-tag using an infrared fluorescent probe enabled the assay of protein half-life in vivo in adult mouse tissues [Citation78], and SNAP-tag readily labels proteins in adult Drosophila tissues [Citation79].
Fluorescent timer proteins change colour over time due to the kinetics of maturation of the component chromophore(s). Since rates of chromophore maturation are determined ahead of time, the assay of the ratio of the two colours indicates the average age of the total protein pool. For example, a fusion of the slowly maturing red-fluorescent mCherry protein to the fast-maturing version of GFP (super-folder GFP, or sfGFP) produces a fluorescent timer protein [Citation80]. With this protein, the degradation rate can be inferred from the ratio of red/green fluorescence at steady state. Due to the slow maturation rate of mCherry, a relatively faster degradation rate for the fusion protein will produce a lower ratio of red/green fluorescence, independent of the rate of protein synthesis. Fluorescent timer proteins have been used to investigate gene expression changes in Drosophila intestinal stem cells [Citation81].
Finally, conditional transgenic systems provide a powerful way to control the temporal and spatial expressions of fluorescent proteins, and are particularly amenable to analysis of whole animals. Several artificial transcription factors have been generated that are inactive until they bind a small-molecule drug that alters their conformation. For example, in the Tet-ON system, the reverse tetracycline transactivator (rtTA) is composed of the Tet repressor DNA binding protein from E. coli transposon Tn10 fused to the transcriptional activation domain from the herpes simplex virus protein VP16. A four amino acid mutation in the Tet repressor moiety causes the rtTA to change conformation and bind Tet operator (tetO) sequences only in the presence of the drug doxycycline (DOX). In one transgenic construct (the ‘driver’), a tissue-general or tissue-specific promoter is used to drive the expression of rtTA. In a second transgenic construct (the ‘target’), tetO sequences are fused to a minimal promoter, and drive expression of a protein of interest. In this way, administration of DOX to cells or transgenic animals for a short period can be used to produce a pulse of expression of fluorescent protein () [Citation82,Citation83,Citation84] One important consideration for using this approach to study protein turnover is that the investigator must estimate when production of the target construct protein has ended before beginning calculation of the half-life (). Additional binary systems include Gene-Switch, where the artificial transcription factor called Gene–Switch is activated by binding the synthetic steroid mifepristone [Citation85–87], and Cre-ER/Lox, where the engineered recombinase Cre-ER is inactive until it binds a metabolite of the triphenylethylene compound tamoxifen, and then catalyzes the recombination and activation/inactivation of a target gene [Citation88].
Mitochondrial turnover analyses and modelling
Similar to the assay of protein half-life discussed above, the procedures for measuring mitochondrial half-life involve solutions to two basic requirements– a method to mark the mitochondria, and a method to create a pulse of marking to allow assay of degradation kinetics. Stable, mitochondrial-targeted proteins whose fluorescence is altered by acidic pH have been used to detect entry of the mitochondria into the acidic environment of the lysosome during mitophagy, as well as to follow the kinetics of mitochondrial degradation as indicated by loss of protein fluorescence.
One such method is mtRosella. The Rosella protein is a fusion of a pH-insensitive DsRed (DsRed.T3) with a pH-sensitive GFP variant (pHluorin). It can be targeted to the mitochondria by fusion of the mitochondrial targeting sequence of citrate synthase to its N-terminus [Citation89,Citation90]. Under mitophagy, the low pH of the lysosome quenches the green fluorescence of Rosella while leaving the red fluorescence undisturbed. Mitophagy can thus be identified by a reduction in the green/red fluorescence ratio. The Rosella autophagy sensor was developed in yeast, but has also been successfully used to measure mitophagy in C. elegans [Citation91]. The system was used to demonstrate a relationship between mitophagy and longevity in long-lived C. elegans mutants, namely, knockdown of mitophagy-related genes DCT-1, PINK-1 and PDR-1 reduced not only the elevated autophagy levels but also the characteristic long lifespans of daf-2 mutants. In contrast, knocking down these genes affected neither basal autophagy nor lifespan in wild-type worms. The mtRosella system has also been used to investigate the role of mitochondrial dynamics in a Drosophila model of Friedreich’s ataxia [Citation92].
Another fluorescent tool is mito-QC, a tandem mCherry-GFP tag fused to a mitochondrial targeting sequence from human FIS1 [Citation93]. Similar to mtRosella, this construct normally fluoresces green and red, but the green element is selectively quenched by the acidic lysosomal environment to leave red-only fluorescence. The mito-QC system was developed in mice, based on a similar strategy used in human cell culture [Citation93,Citation94]. This construct was introduced into transgenic Drosophila and used to assay mitophagy in both larval and adult tissues. Interestingly, these studies found that basal mitophagy was abundant in nervous tissue but was not detected in muscle tissue. Moreover, the neuronal mitophagy was unaffected by null mutations of Pink1 and parkin genes [Citation56].
The Keima protein is derived from coral. It fluoresces green until exposed to low pH, whereupon it shifts to red. Keima can be targeted to the inner mitochondrial membrane by fusion to a tandem repeat of the COX VIII targeting presequence to create mt-Kiema. Similar to mtRosella, a reduced ratio of green to red fluorescence from mt-Kiema indicates entry of the protein into the lysosome. The protein’s resistance to lysosomal proteases allows the fluorescent signal to persist. This construct has been successfully used in mice to assess in vivo alterations in mitophagy under a variety of conditions, including reduced mitophagy in aging mice [Citation95]. It has also been used in Drosophila to assess mitophagy under various environmental and genetic conditions [Citation96]. Developmental stage, inhibition of TOR signalling and hypoxia all affected the strength of the mitophagy signal. In both flies and mice, mt-Keima also revealed differences in levels of basal mitophagy among different tissues.
The DsRed-mutant DsRed1-E5, known as Timer, fluoresces green when newly synthesized, but shifts to a more stable red configuration as it matures. Specifically, this alteration is driven by the oxidation of its Tyr-67 residue. Timer can be targeted to the inner mitochondrial membrane by fusion of the COX VIII targeting sequence with its N terminus; the resulting construct has been dubbed MitoTimer. Due to its irreversible wavelength shift over time, MitoTimer can be used to differentiate between older and newer mitochondria, as well as to sense conditions of increased oxidation. It has been used as a reporter of oxidative stress in Drosophila as well as C. elegans, mice, and mouse cell culture [Citation97]. Inducible MitoTimer expression has been used to investigate changes in the age distribution of mitochondria in MEFs, and to visualize mitochondrial biogenesis in human embryonic kidney cells [Citation98,Citation99]. In transgenic Drosophila, MitoTimer has been used to visualize altered mitochondrial morphology and mitophagy in the heart and flight-muscle of flies with disrupted autophagy gene expression [Citation100].
Finally, isotope labelling has been used to assess the rate of bulk mitochondrial protein synthesis. In one approach, 35S-methionine was fed to adult flies, the mitochondria were isolated, and then the radioactive label incorporation was quantified by liquid scintillation [Citation101]. In a second approach, cultured human cells were treated with emetine to inhibit cytosolic protein synthesis, and then 35S-methionine was added to specifically label mitochondrial translation products, which were then quantified by SDS-PAGE and phosphorimager [Citation102]. In a third approach, adult mice were given heavy water for 6 weeks to label the total protein, mitochondria were isolated from dissected tissues, and the fraction of labelled mitochondrial protein was quantified using gas chromatography/mass spectrometry [Citation103]. By following the isotope labelling with a chase of unlabelled precursor, and assaying at subsequent time points, these methods could be adapted to measure bulk mitochondrial protein half-life. As mentioned above, individual mitochondrial proteins can have different half-lives [Citation57,Citation58]; however, pulse-chase of bulk mitochondrial protein might be used as a measure of mitochondrial turnover.
Individual variation in protein and mitochondrial turnover
Aging phenotypes, including life span, vary between individual cells and between individual animals for reasons that remain unclear [Citation104]. This observation holds true even for inbred animals maintained in highly homogeneous environments. Interestingly, protein turnover rates also vary between individual cells and animals. For example, Alber et al. tagged endogenous proteins in mouse embryonic stem cells with a tandem fluorescent timer [Citation77]. This enabled the assay of synthesis and degradation rates in single cells using time-lapse fluorescence microscopy. These studies revealed that inter-cellular variability in protein half-life was caused by cell-specific rather than gene-specific variation, and was correlated with the cell-specific expression of a proteasome component. In pioneering studies, trout and carp fish were assayed at multiple adult time points for individual variation in protein consumption and growth rate, and then injected with tritiated phenylalanine and sacrificed after several hours to measure protein synthesis rates. Comparison of individual growth rates and protein synthesis rates indicated that greater growth efficiency results from a reduced rate of protein turnover [Citation105]. Feeding adult humans 13C-labelled leucine enabled assay of individual variation in protein synthesis and degradation by measuring plasma metabolites and 13CO2 excretion, and suggested individual variation in insulin-mediated inhibition of proteolysis [Citation106]. Adult Drosophila have been assayed for proteasomal protease activity in individual fly extracts, revealing inter-individual variation and greater average activity in females compared to males [Citation107]. Mitochondrial turnover may also show inter-individual variation. For example, the assay of mitophagy markers and mitochondrial abundance in adult human peripheral blood mononuclear cells revealed inter-individual variability that correlated with pre-diabetes and diabetes status [Citation108]. Many of the assays described here, particularly fluorescence imaging, can be applied to individual animals and individual cells. The mechanisms and consequences of inter-individual variation in protein and mitochondrial turnover will be an important area for future research.
Drosophila and potential advantages
Drosophila has several advantages that make it an ideal system for in vivo analysis of protein and mitochondrial turnover during aging. Drosophila is the most powerful invertebrate model with well-differentiated tissues, including brain, eye, heart, somatic stem cells and kidney-related tissues. This feature is particularly important given the large differences in protein half-life often observed for different tissues. Because of the many powerful genetic and molecular biological tools available, combined with a rapid life cycle, Drosophila is a particularly well-developed model for aging studies, including tissue-specific, sex-specific and environment-specific effects [Citation109,Citation110]. Drosophila is also a well-developed model for fluorescence imaging [Citation73]. The translucent character of the Drosophila cuticle enables the assay of internal tissues in live adult Drosophila by fluorescence microscopy. Assay of individual adult flies containing reporters composed of innate immune-response gene promoters driving GFP, or Hsp gene promoters driving GFP or DsRED, yielded biomarkers partially predictive of remaining life span [Citation29,Citation46]. Fluorescence video analysis of free-moving adult Drosophila allows quantification of fluorescent protein abundance in internal tissues, including the nervous system, and can be readily adapted to assay protein degradation rates () [Citation111,Citation112]. In summary, Drosophila has great potential for utilizing the methods and reagents described above for the in vivo analysis of tissue-specific protein and mitochondria turnover in aging flies, including analysis of individual variation.
Figure 2. Fluorescent protein synthesis and turnover in free-moving adult Drosophila. (a) Neuronal expression of eGFP. The tissue-general Actin-Gene-Switch[255B] driver strain [Citation87] was crossed to the multi-copy UAS-eGFP strain (‘ultra-GFP’ [Citation29]), and six male progenies were placed in a glass vial with media supplemented with 160 μg/ml mifepristone (RU486). GFP fluorescence was quantified continuously using video and FluoreScore software, and is expressed in relative units (figure adapted from [Citation111]). Light green indicates average GFP intensity per minute and dark green is the LOESS curve. (b) Decay rate of GFP targeted to the mitochondrial matrix. mitoGFP is a mitochondria-targeted form of eGFP created by fusing the human COX VIII mitochondrial targeting signal to the N terminus of eGFP [Citation113]. In a proof-of-principle experiment, the tissue-general Actin-Gene-Switch[255B] driver strain was crossed to the UAS–mitoGFP[AP3] strain [Citation113], and male progeny (1–5 days of age) were placed in vials with media supplemented with 160 μg/ml mifepristone (RU486) or on control media. After 48 hours, all flies were transferred to glass culture vials with control media, at 6 flies per vial, using three replicate vials for drug treated flies and three replicate vials for controls (time 0). The flies were then assayed for GFP fluorescence at the indicated time points using 4 minute videos and FluoreScore software, and the average and SD of the three vials is plotted for each of (-) drug and (+) drug groups. The data suggests an in vivo half-life for mitoGFP of ~3 days
![Figure 2. Fluorescent protein synthesis and turnover in free-moving adult Drosophila. (a) Neuronal expression of eGFP. The tissue-general Actin-Gene-Switch[255B] driver strain [Citation87] was crossed to the multi-copy UAS-eGFP strain (‘ultra-GFP’ [Citation29]), and six male progenies were placed in a glass vial with media supplemented with 160 μg/ml mifepristone (RU486). GFP fluorescence was quantified continuously using video and FluoreScore software, and is expressed in relative units (figure adapted from [Citation111]). Light green indicates average GFP intensity per minute and dark green is the LOESS curve. (b) Decay rate of GFP targeted to the mitochondrial matrix. mitoGFP is a mitochondria-targeted form of eGFP created by fusing the human COX VIII mitochondrial targeting signal to the N terminus of eGFP [Citation113]. In a proof-of-principle experiment, the tissue-general Actin-Gene-Switch[255B] driver strain was crossed to the UAS–mitoGFP[AP3] strain [Citation113], and male progeny (1–5 days of age) were placed in vials with media supplemented with 160 μg/ml mifepristone (RU486) or on control media. After 48 hours, all flies were transferred to glass culture vials with control media, at 6 flies per vial, using three replicate vials for drug treated flies and three replicate vials for controls (time 0). The flies were then assayed for GFP fluorescence at the indicated time points using 4 minute videos and FluoreScore software, and the average and SD of the three vials is plotted for each of (-) drug and (+) drug groups. The data suggests an in vivo half-life for mitoGFP of ~3 days](/cms/asset/c0920afa-5345-453d-85c9-4e8f2e84e2ad/kfly_a_1911286_f0002_oc.jpg)
Acknowledgments
This work was funded by the National Institute on Aging under grant AG057741 to JT. HB was supported in part by T32-GM118289.
Disclosure statement
No potential conflict of interest was reported by the authors.
Data availability statement
The authors confirm that the data supporting the findings of this study are available within the article and its supplementary materials.
Additional information
Funding
References
- Stadtman ER. Protein oxidation and aging. Free Radic Res. 2006;40(12):1250–1258.
- Chaudhuri J, Bains Y, Guha S, et al. The role of advanced glycation end products in aging and metabolic diseases: bridging association and causality. Cell Metab. 2018;28(3):337–352.
- Mogk A, Bukau B, Kampinga HH. Cellular handling of protein aggregates by disaggregation machines. Mol Cell. 2018;69(2):214–226.
- Hochstrasser M, Kornitzer D. Ubiquitin-dependent degradation of transcription regulators. In: Peters JM, Harris JR, Finley D, editors. Ubiquitin and the biology of the cell. Boston, MA: Springer; 1998. p. 279–302.
- Belle A, Tanay A, Bitincka L, et al. Quantification of protein half-lives in the budding yeast proteome. Proc Natl Acad Sci U S A. 2006;103(35):13004–13009.
- Varshavsky A. N-degron and C-degron pathways of protein degradation. Proc Natl Acad Sci U S A. 2019;116(2):358–366.
- Pickering AM, Davies KJ. Degradation of damaged proteins: the main function of the 20S proteasome. Prog Mol Biol Transl Sci. 2012;109:227–248.
- Ella H, Reiss Y, Ravid T. The hunt for degrons of the 26S proteasome. Biomolecules. 2019;9(6):230.
- Drummond DA, Wilke CO. Mistranslation-induced protein misfolding as a dominant constraint on coding-sequence evolution. Cell. 2008;134(2):341–352.
- Bard JAM, Goodall EA, Greene ER, et al. Structure and function of the 26S proteasome. Annu Rev Biochem. 2018;87(1):697–724.
- Rousseau A, Bertolotti A. Regulation of proteasome assembly and activity in health and disease. Nat Rev Mol Cell Biol. 2018;19:697–712.
- Kaushik S, Cuervo AM. The coming of age of chaperone-mediated autophagy. Nat Rev Mol Cell Biol. 2018;19(6):365–381.
- Galluzzi L, Baehrecke EH, Ballabio A, et al. Molecular definitions of autophagy and related processes. EMBO J. 2017;36(13):1811–1836.
- Li Y, Liu L, Zhu Y, et al. Mitochondria organize the cellular proteostatic response and promote cellular senescence. Cell Stress. 2019;3(4):110–114.
- Ruan L, Zhou C, Jin E, et al. Cytosolic proteostasis through importing of misfolded proteins into mitochondria. Nature. 2017;543(7645):443–446.
- Song J, Herrmann JM, Becker T. Quality control of the mitochondrial proteome. Nat Rev Mol Cell Biol. 2021;22:54–70.
- Moehle EA, Shen K, Dillin A. Mitochondrial proteostasis in the context of cellular and organismal health and aging. J Biol Chem. 2019;294(14):5396–5407.
- Chen G, Kroemer G, Kepp O. Mitophagy: an emerging role in aging and age-associated diseases. Front Cell Dev Biol. 2020;8:200.
- Balch WE, Morimoto RI, Dillin A, et al. Adapting proteostasis for disease intervention. Science. 2008;319(5865):916–919.
- Tower J. Heat shock proteins and Drosophila aging. Exp Gerontol. 2011;46(5):355–362.
- Tower J. Hsps and aging. Trends Endocrinol Metab. 2009;20(5):216–222.
- Kastle M, Grune T. Interactions of the proteasomal system with chaperones: protein triage and protein quality control. Prog Mol Biol Transl Sci. 2012;109:113–160.
- Higuchi-Sanabria R, Frankino PA, Paul JW 3rd, et al. Protein quality control and the stress of aging. Dev Cell. 2018;44:139–163.
- Hipp MS, Kasturi P, Hartl FU. The proteostasis network and its decline in ageing. Nat Rev Mol Cell Biol. 2019;20:421–435.
- Kaushik S, Cuervo AM. Proteostasis and aging. Nat Med. 2015;21(12):1406–1415.
- Gershon H, Gershon D. Detection of inactive enzyme molecules in ageing organisms. Nature. 1970;227(5264):1214–1217.
- Ward W, Richardson A. Effect of age on liver protein synthesis and degradation. Hepatology. 1991;14(5):935–948.
- Rattan SI. Synthesis, modifications, and turnover of proteins during aging. Exp Gerontol. 1996;31(1–2):33–47.
- Yang J, Tower J. Expression of hsp22 and hsp70 transgenes is partially predictive of Drosophila survival under normal and stress conditions. J Gerontol A Biol Sci Med Sci. 2009;20(8):828–838.
- Yee Z, Lim SHY, Ng LF, et al. Inhibition of mTOR decreases insoluble proteins burden by reducing translation in C. elegans. Biogerontology. 2021;22(1):101–118.
- Ciechanover A, Kwon YT. Protein quality control by molecular chaperones in neurodegeneration. Front Neurosci. 2017;11:185.
- Liu GY, Sabatini DM. mTOR at the nexus of nutrition, growth, ageing and disease. Nat Rev Mol Cell Biol. 2020;21:183–203.
- Kapahi P, Chen D, Rogers AN, et al. With TOR, less is more: a key role for the conserved nutrient-sensing TOR pathway in aging. Cell Metab. 2010;11(6):453–465.
- Hipkiss AR. On why decreasing protein synthesis can increase lifespan. Mech Ageing Dev. 2007;128(5–6):412–414.
- Kaeberlein M, Kennedy BK. Protein translation. Aging Cell. 2007;6(6):731–734.
- Kapahi P. Protein synthesis and the antagonistic pleiotropy hypothesis of aging. Adv Exp Med Biol. 2010;694:30–37.
- Maruzs T, Simon-Vecsei Z, Kiss V, et al. On the fly: recent progress on autophagy and aging in Drosophila. Front Cell Dev Biol. 2019;7:140.
- Lapierre LR, Kumsta C, Sandri M, et al. Transcriptional and epigenetic regulation of autophagy in aging. Autophagy. 2015;11(6):867–880.
- Markaki M, Palikaras K, Tavernarakis N. Novel insights into the anti-aging role of mitophagy. Int Rev Cell Mol Biol. 2018;340:169–208.
- Hansen M, Rubinsztein DC, Walker DW. Autophagy as a promoter of longevity: insights from model organisms. Nat Rev Mol Cell Biol. 2018;19(9):579–593.
- Toth ML, Sigmond T, Borsos E, et al. Longevity pathways converge on autophagy genes to regulate life span in Caenorhabditis elegans. Autophagy. 2008;4(3):330–338.
- Matsuda M, Hayashi H, Garcia-Ojalvo J, et al. Species-specific segmentation clock periods are due to differential biochemical reaction speeds. Science. 2020;369:1450–1455. doi:https://doi.org/10.1126/science.aba7668
- Rayon T, Stamataki D, Perez-Carrasco R, et al. Species-specific pace of development is associated with differences in protein stability. Science. 2020;369. doi:https://doi.org/10.1126/science.aba7667
- Swovick K, Firsanov D, Welle KA, et al. Interspecies differences in proteome turnover kinetics are correlated with lifespans and energetic demands. Mol Cell Proteomics. 2020. DOI:https://doi.org/10.1074/mcp.RA120.002301.
- Tower J. Mitochondrial maintenance failure in aging and role of sexual dimorphism. Arch Biochem Biophys. 2015;576:17–31.
- Landis GN, Abdueva D, Skvortsov D, et al. Similar gene expression patterns characterize aging and oxidative stress in Drosophila melanogaster. Proc Natl Acad Sci U S A. 2004;101(20):7663–7668.
- Frenk S, Houseley J. Gene expression hallmarks of cellular ageing. Biogerontology. 2018;19(6):547–566.
- Korovila I, Hugo M, Castro JP, et al. Proteostasis, oxidative stress and aging. Redox Biol. 2017;13:550–567.
- Filograna R, Mennuni M, Alsina D, et al. Mitochondrial DNA copy number in human disease: the more the better? FEBS Lett. 2020. DOI:https://doi.org/10.1002/1873-3468.14021
- Wong E, Cuervo AM. Integration of clearance mechanisms: the proteasome and autophagy. Cold Spring Harb Perspect Biol. 2010;2(12):a006734.
- Finley D. Recognition and processing of ubiquitin-protein conjugates by the proteasome. Annu Rev Biochem. 2009;78(1):477–513.
- Basisty N, Meyer JG, Schilling B. Protein turnover in aging and longevity. Proteomics. 2018;18(5–6):e1700108.
- Stotland A, Gottlieb RA. Mitochondrial quality control: easy come, easy go. Biochim Biophys Acta, Mol Cell Res. 2015;1853(10):2802–2811.
- Bowling JL, Skolfield MC, Riley WA, et al. Temporal integration of mitochondrial stress signals by the PINK1:parkin pathway. BMC Mol Cell Biol. 2019;20(1):33.
- Twig G, Elorza A, Molina AJ, et al. Fission and selective fusion govern mitochondrial segregation and elimination by autophagy. EMBO J. 2008;27(2):433–446.
- Lee JJ, Sanchez-Martinez A, Martinez Zarate A, et al. Basal mitophagy is widespread in Drosophila but minimally affected by loss of Pink1 or parkin. J Cell Biol. 2018;217(5):1613–1622.
- Kim TY, Wang D, Kim AK, et al. Metabolic labeling reveals proteome dynamics of mouse mitochondria. Mol Cell Proteomics. 2012;11(12):1586–1594.
- Vincow ES, Thomas RE, Merrihew GE, et al. Autophagy accounts for approximately one-third of mitochondrial protein turnover and is protein selective. Autophagy. 2019;15(9):1592–1605.
- Ravid T, Hochstrasser M. Diversity of degradation signals in the ubiquitin–proteasome system. Nat Rev Mol Cell Biol. 2008;9(9):679–690.
- Varshavsky A. The N-end rule pathway and regulation by proteolysis. Protein Sci. 2011;20:1298–1345.
- Goldberg AL, Dice JF. Intracellular protein degradation in mammalian and bacterial cells. Annu Rev Biochem. 1974;43(1):835–869.
- Chan XC, Black CM, Lin AJ, et al. Mitochondrial protein turnover: methods to measure turnover rates on a large scale. J Mol Cell Cardiol. 2015;78:54–61.
- Kellerman KA, Mattson DM, Duncan I. Mutations affecting the stability of the fushi tarazu protein of Drosophila. Genes Dev. 1990;4(11):1936–1950.
- Maynard Smith J, Bozcuk AN, Tebbutt S. Protein turnover in adult Drosophila. J Insect Physiol. 1970;16(4):601–613.
- Wang L, Davis SS, Borch Jensen M, et al. JNK modifies neuronal metabolism to promote proteostasis and longevity. Aging Cell. 2019;18(3):e12849. doi:https://doi.org/10.1111/acel.12849
- Visscher M, De Henau S, Wildschut ME, et al. Proteome-wide changes in protein turnover rates in C. elegans models of longevity and age-related disease. Cell Rep. 2016;16(11):3041–3051.
- Eden E, Geva-Zatorsky N, Issaeva I, et al. Proteome half-life dynamics in living human cells. Science. 2011;331(6018):764–768.
- Chalfie M, Tu Y, Euskirchen G, et al. Green fluorescent protein as a marker for gene expression. Science. 1994;263(5148):802–805.
- Wang S, Hazelrigg T. Implications for bcd mRNA localization from spatial distribution of exu protein in Drosophila oogenesis. Nature. 1994;369(6479):400–403.
- Trauth J, Scheffer J, Hasenjager S, et al. Strategies to investigate protein turnover with fluorescent protein reporters in eukaryotic organisms. AIMS Biophysics. 2020;7(2):90–118.
- Chudakov DM, Matz MV, Lukyanov S, et al. Fluorescent proteins and their applications in imaging living cells and tissues. Physiol Rev. 2010;90(3):1103–1163.
- Verkhusha VV, Kuznetsova IM, Stepanenko OV, et al. High stability of discosoma DsRed as compared to aequorea EGFP. Biochemistry. 2003;42(26):7879–7884.
- Dunst S, Tomancak P. Imaging flies by fluorescence microscopy: principles, technologies, and applications. Genetics. 2019;211(1):15–34.
- Fried P, Sanchez-Aragon M, Aguilar-Hidalgo D, et al. A model of the spatio-temporal dynamics of Drosophila eye disc development. PLoS Comput Biol. 2016;12(9):e1005052.
- Gurskaya NG, Verkhusha VV, Shcheglov AS, et al. Engineering of a monomeric green-to-red photoactivatable fluorescent protein induced by blue light. Nat Biotechnol. 2006;24(4):461–465.
- Babatz F, Naffin E, Klambt C. The Drosophila blood-brain barrier adapts to cell growth by unfolding of pre-existing septate junctions. Dev Cell. 2018;47(6):697–710 e693.
- Alber AB, Paquet ER, Biserni M, et al. Single live cell monitoring of protein turnover reveals intercellular variability and cell-cycle dependence of degradation rates. Mol Cell. 2018;71(6):1079–1091 e1079.
- Bojkowska K, Santoni De Sio F, Barde I, et al. Measuring in vivo protein half-life. Chem Biol. 2011;18(6):805–815.
- Kohl J, Ng J, Cachero S, et al. Ultrafast tissue staining with chemical tags. Proc Natl Acad Sci U S A. 2014;111(36):E3805–3814.
- Khmelinskii A, Keller PJ, Bartosik A, et al. Tandem fluorescent protein timers for in vivo analysis of protein dynamics. Nat Biotechnol. 2012;30(7):708–714.
- He L, Binari R, Huang J, et al. In vivo study of gene expression with an enhanced dual-color fluorescent transcriptional timer. eLife. 2019;8. DOI:https://doi.org/10.7554/eLife.46181.
- Gossen M, Freundlieb S, Bender G, et al. Transcriptional activation by tetracyclines in mammalian cells. Science. 1995;268:1766–1769.
- Kistner A, Gossen M, Zimmermann F, et al. Doxycycline-mediated quantitative and tissue-specific control of gene expression in transgenic mice. Proc Natl Acad Sci U S A. 1996;93:10933–10938.
- Bieschke ET, Wheeler JC, Tower J. Doxycycline-induced transgene expression during Drosophila development and aging. Molecular & general genetics : MGG. 1998;258:571–579.
- Roman G, Davis RL. Conditional expression of UAS-transgenes in the adult eye with a new gene-switch vector system. Genesis. 2002;34(1–2):127–131.
- Wang Y, O’Malley BW Jr., Tsai SY, et al. A regulatory system for use in gene transfer. Proc Natl Acad Sci U S A. 1994;91:8180–8184.
- Ford D, Hoe N, Landis GN, et al. Alteration of Drosophila life span using conditional, tissue-specific expression of transgenes triggered by doxycyline or RU486/Mifepristone. Exp Gerontol. 2007;42(6):483–497.
- Hayashi S, McMahon AP. Efficient recombination in diverse tissues by a tamoxifen-inducible form of Cre: a tool for temporally regulated gene activation/inactivation in the mouse. Dev Biol. 2002;244(2):305–318.
- Mijaljica D, Prescott M, Devenish RJ. A fluorescence microscopy assay for monitoring mitophagy in the yeast saccharomyces cerevisiae. J Vis Exp. 2011;(53). DOI:https://doi.org/10.3791/2779.
- Rosado CJ, Mijaljica D, Hatzinisiriou I, et al. Rosella: a fluorescent pH-biosensor for reporting vacuolar turnover of cytosol and organelles in yeast. Autophagy. 2008;4(2):205–213.
- Palikaras K, Lionaki E, Tavernarakis N. Coordination of mitophagy and mitochondrial biogenesis during ageing in C. elegans. Nature. 2015;521(7553):525–528.
- Edenharter O, Schneuwly S, Navarro JA. Mitofusin-dependent ER stress triggers glial dysfunction and nervous system degeneration in a Drosophila model of Friedreich’s ataxia. Front Mol Neurosci. 2018;11:38.
- McWilliams TG, Prescott AR, Allen GF, et al. mito-QC illuminates mitophagy and mitochondrial architecture in vivo. J Cell Biol. 2016;214(3):333–345.
- Allen GF, Toth R, James J, et al. Loss of iron triggers PINK1/Parkin-independent mitophagy. EMBO Rep. 2013;14(12):1127–1135.
- Sun N, Yun J, Liu J, et al. Measuring in vivo mitophagy. Mol Cell. 2015;60(4):685–696.
- Kim YY, Um JH, Yoon JH, et al. Assessment of mitophagy in mt-Keima Drosophila revealed an essential role of the PINK1-Parkin pathway in mitophagy induction in vivo. FASEB J. 2019;33(9):9742–9751.
- Laker RC, Xu P, Ryall KA, et al. A novel MitoTimer reporter gene for mitochondrial content, structure, stress, and damage in vivo. J Biol Chem. 2014;289(17):12005–12015.
- Ferree AW, Trudeau K, Zik E, et al. MitoTimer probe reveals the impact of autophagy, fusion, and motility on subcellular distribution of young and old mitochondrial protein and on relative mitochondrial protein age. Autophagy. 2013;9(11):1887–1896.
- Hernandez G, Thornton C, Stotland A, et al. MitoTimer: a novel tool for monitoring mitochondrial turnover. Autophagy. 2013;9:1852–1861.
- Xu P, Damschroder D, Zhang M, et al. Atg2, Atg9 and Atg18 in mitochondrial integrity, cardiac function and healthspan in Drosophila. J Mol Cell Cardiol. 2019;127:116–124.
- Carvalho GB, Drago I, Hoxha S, et al. The 4E-BP growth pathway regulates the effect of ambient temperature on Drosophila metabolism and lifespan. Proc Natl Acad Sci U S A. 2017;114(36):9737–9742.
- Johnson MA, Vidoni S, Durigon R, et al. Amino acid starvation has opposite effects on mitochondrial and cytosolic protein synthesis. PLoS One. 2014;9(4):e93597.
- Miller BF, Robinson MM, Bruss MD, et al. A comprehensive assessment of mitochondrial protein synthesis and cellular proliferation with age and caloric restriction. Aging Cell. 2012;11(1):150–161.
- Mendenhall AR, Martin GM, Kaeberlein M, et al. Cell-to-cell variation in gene expression and the aging process. Geroscience. 2021. DOI:https://doi.org/10.1007/s11357-021-00339-9
- McCarthy ID, Houlihan DF, Carter CG, et al. Variation in individual food consumption rates of fish and its implications for the study of fish nutrition and physiology. Proc Nutr Soc. 1993;52(3):427–436.
- Fereday A, Gibson NR, Cox M, et al. Variation in the apparent sensitivity of the insulin-mediated inhibition of proteolysis to amino acid supply determines the efficiency of protein utilization. Clin Sci (Lond). 1998;95(6):725–733.
- Hansen TO, Sarup P, Loeschcke V, et al. Age-related and sex-specific differences in proteasome activity in individual Drosophila flies from wild type, longevity-selected and stress resistant strains. Biogerontology. 2012;13(4):429–438.
- Bhansali S, Bhansali A, Walia R, et al. Alterations in mitochondrial oxidative stress and mitophagy in subjects with prediabetes and type 2 diabetes mellitus. Front Endocrinol (Lausanne). 2017;8:347.
- Partridge L, Tower J. Yeast, a feast: the fruit fly Drosophila as a model organism for research into aging. In: Guarente LP, Partridge L, Wallace DC, editors. Molecular biology of aging. Cold Spring Harbor: Cold Spring Harbor Laboratory Press; 2008. p. 267–308.
- Katewa SD, Kapahi P. Role of TOR signaling in aging and related biological processes in Drosophila melanogaster. Exp Gerontol. 2011;46(5):382–390.
- Ardekani R, Huang YM, Sancheti P, et al. Using GFP video to track 3D movement and conditional gene expression in free-moving flies. PLoS One. 2012;7(7):e40506.
- Tower J, Agrawal S, Alagappan MP, et al. Behavioral and molecular markers of death in Drosophila melanogaster. Exp Gerontol. 2019;126:110707.
- Cox RT, Spradling AC. A Balbiani body and the fusome mediate mitochondrial inheritance during Drosophila oogenesis. Development. 2003;130(8):1579–1590.