
 ?Mathematical formulae have been encoded as MathML and are displayed in this HTML version using MathJax in order to improve their display. Uncheck the box to turn MathJax off. This feature requires Javascript. Click on a formula to zoom.
ABSTRACT
The Drosophila melanogaster brain is a complex organ with various cell types, orchestrating the development, physiology, and behaviors of the fly. While each cell type in Drosophila brain is known to express a unique gene set, their complete genetic profile is still unknown. Advances in the RNA sequencing techniques at single-cell resolution facilitate identifying novel cell type markers and/or re-examining the specificity of the available ones. In this study, exploiting a single-cell RNA sequencing data of Drosophila optic lobe, we categorized the cells based on their expression pattern for known markers, then the genes with enriched expression in astrocytes were identified. CG11000 was identified as a gene with a comparable expression profile to the Eaat1 gene, an astrocyte marker, in every individual cell inside the Drosophila optic lobe and midbrain, as well as in the entire Drosophila brain throughout its development. Consistent with our bioinformatics data, immunostaining of the brains dissected from transgenic adult flies showed co-expression of CG11000 with Eaat1 in a set of single cells corresponding to the astrocytes in the Drosophila brain. Physiologically, inhibiting CG11000 through RNA interference disrupted the normal development of male D. melanogaster, while having no impact on females. Expression suppression of CG11000 in adult flies led to decreased locomotion activity and also shortened lifespan specifically in astrocytes, indicating the gene’s significance in astrocytes. We designated this gene as ‘deathstar’ due to its crucial role in maintaining the star-like shape of glial cells, astrocytes, throughout their development into adult stage.
Introduction
The Drosophila melanogaster nervous system is a powerful model to study development [Citation1–4], physiology [Citation4–6], and behaviors [Citation7,Citation8] of other organisms, including human, due to their great homology at cellular and molecular levels [Citation9–12]. The Drosophila brain is composed of various cell types which are recognized primarily by their morphology and spatial organization [Citation13–15], hence necessitating the study of this organ deeper at single-cell resolution.
In neuroscience, several classical cell type markers are commonly used to indicate and/or target a particular population of cells, considered to be the cells of a single type [Citation16,Citation17]. At least six main types of neural cells have been identified in D. melanogaster, each characterized by the expression of a unique set of genes known as their molecular markers [Citation16]. These cell types include perineurial glia (PNG), sub-perineurial glia (SPG), cortex glia (CG), astrocyte-like glia (ALG or astrocytes), ensheathing glia (EG) and neurons (Neu), each possesses its own genetic driver lines [Citation16].
Since expression pattern of a single or multiple genes could not represent the full genetic profile of a particular cell [Citation18,Citation19], additional analyses are required for cell type identification. Also, besides the previously known molecular markers for each cell type, novel and/or uncharacterized genes may exist in D. melanogaster such that a specific cell type can be discerned with. With the advent of single-cell RNA sequencing (scRNA-seq), analysis of the entire transcriptome of an individual cell is feasible, which facilitates determination of the identity of the cells in all organisms including D. melanogaster. By providing the full genetic profile of individual cells, scRNA-seq is a convenient strategy to identify novel cell types [Citation20–22] and to re-examine the specificity of the pre-existing molecular markers in the respective cell types [Citation23,Citation24].
In this study, we take the advantages of the availability of the scRNA-seq data of Drosophila brain to perform clustering of the sequenced single cells of Drosophila brain based on their known molecular markers as well as their entire transcriptome, then seeking for novel genes with differential expression pattern across the clusters. Thereafter, the predicted expression pattern and functional role of the candidate genes are assessed experimentally.
Materials and methods
Datasets
A single-cell RNA-sequencing (scRNA-seq) data belonging to the Drosophila optic lobe was obtained from the NCBI Gene Expression Omnibus (GEO) database (accession number: GSE103771), which covered the expression profile of 17,272 Drosophila genes in a population of 120,000 single cells from optic lobe [Citation25].
Another single-cell RNA-sequencing (scRNA-seq) data was from the Drosophila mid-brain and was obtained from the NCBI Sequence Read Archive (SRA) database (accession number: SRP128516), which covered the expression profile of 12,868 Drosophila genes in a population of 28,695 single cells from mid-brain [Citation26].
Two bulk RNA-sequencing data of Drosophila whole brain were obtained from the NCBI GEO: one contained the expression profile of all D. melanogaster genes across four different developmental stages (days 5, 20, 30, and 40 posteclosion; accession number: GSE107049) [Citation27] and another one contained the expression profile of all D. melanogaster genes across three different developmental stages of the fly (days 3, 7, and 14 posteclosion; accession number: GSE199164).
Bioinformatics analyses
In order to have a set of clusters comprising the main neural cell types of D. melanogaster (i.e. PNG, SPG, CG, EG, ALG, and neurons), first, the expression matrix belonging to the scRNA-seq data of Drosophila optic lobe in the study of Konstantinides et al.. (accession number: GSE103771) [Citation25] was downloaded and used for downstream analyses. Then, this matrix was analyed in accordance with the expression pattern of the previously known Drosophila marker genes specific to PNG, SPG, CG, EGN, EGT, ALG, and neuronal cell types and the single cells expressing the markers of a respective cell type and negative for the expression of the markers of other cell types were identified and presented as a heatmap of expression level using the online tool Heatmapper [Citation28] with color codes (red and black colors refer to positive and negative expression for the markers, respectively).
To confirm the above-mentioned cell type classification, hierarchical clustering was performed in accordance with the similarities between the identified single cells based on their transcriptome profile and expressed as a heatmap with color codes for the Pearson correlation coefficient, using the ggplot2 [Citation29] and pheatmap [Citation30] packages in R. Also, principal component analysis (PCA) was performed to distinguish the cells/clusters with distinct transcriptome profile, using R program.
The lists of differentially expressed genes (DEGs) between clusters of interest were identified by the R package limma [Citation31], considering the log2fold-change (log2FC) ≥ 1 and P-value <0.05 as the significance cutoff.
To confirm the differential expression pattern of the candidate genes in a particular cell type/cluster, the unpaired t-test method [Citation32] was applied considering adjusted P-values (Benjamini–Hochberg correction) < 0.01 and log2FC ≥1 as the significance cutoff. Venn diagram was performed for obtaining the list of common DEGs between the examined clusters, using the web-based tool Venny [Citation33]. Pairwise alignment between the transcripts of CR34335 and CR40469 genes was performed in ClustalW [Citation34,Citation35].
Fly stocks and crosses
All the D. melanogaster lines in this study were obtained from the Bloomington Drosophila Stock Center (BDSC) and Vienna Drosophila Resource Center (VDRC). After being subjected to stocks, they were cultured in standard conditions (standard cornmeal-agar yeast fly food at 25°C in a 12 h light:12 h dark condition) following the previous description [Citation36]. CO2 served as an anesthetic.
For the crosses of fluorescence labeling experiments, the two binary systems GAL4/UAS-mCD8RFP and LexA/LexAop-mCD8GFP were employed simultaneously in individual male and female flies. The ALG cells of Drosophila CNS were labeled in accordance with the expression of a membrane-bound GFP (mCD8GFP) under the control of Eaat1 gene promoter, fused to the sequence of LexA (Eaat1-LexA) (BDSC#: 52719). Transgenic fly lines carrying the CG11000 (deathstar)-GAL4 were used to drive the expression of a membrane-bound RFP (mCD8RFP) in progenies (both in female and male) under the control of deathstar gene promoter (BDSC#: 72713, 23416, 91441). Therefore, the expression pattern of RFP will reflect the pattern of deathstar promoter activity across the Drosophila single cells. lists the fly stocks and the crossing scheme for immunostaining experiments.
Table 1. Crossing scheme for imaging experiments of the Drosophila brain. The line a contains RFP and GFP reporter genes under the control of UAS and LexAop sequences, respectively. Line B expresses LexA protein in an ALG-specific manner driven by Eaat1 promoter. The fly line C (of F1 generation) was generated by crossing the lines a and B (parents), and then it was crossed to the CG11000-GAL4 line (i.e. D) to produce F2 generation. Among the flies of F2 generation, the males and females that lacked balancer chromosomes but contain the complete components of the two binary systems UAS/GAL4 and LexA/LexAop were selected for brain dissection. The females (♀) of all crosses were virgin.
For functional analysis of the genes, the GAL4/UAS-RNAi system [Citation37] was employed to deplete the function of genes of interest in a cell type-specific manner. summarizes the fly stocks (parents) together with their crossing schemes, ensuring progenies to express the deathstar RNAi in a cell type-specific manner. In detail, the virgin females transgenic for the UAS- deathstar RNAi constructs (BDSC#: 51918, VDRC#: v107504, v102061) were crossed to different male driver lines expressing GAL4 under the control of the promoter of a set of cell type-specific genes (). The promoter of shn gene drives GAL4 expression in PNG, Mdr65 in SPG, wrapper in CG, CG9657 in EGN, CG34340 (Drgx) in EGT, CG5264 in ALG, repo in all glia, and nSyb drives GAL4 expression in neurons [Citation16,Citation23,Citation38]. After crossing the flies, the progenies with complete components of the GAL4/UAS binary system (i.e. x-GAL4 > UAS-deathstar RNAi) were collected based on their phenotypes () and functional analyses of deathstar gene were performed for them.
Table 2. Summary of the crosses and experimental genotypes for behavioral analyses. To generate the transgenic flies with expression of CG11000-RNAi in cell type-specific manner, the male flies of different GAL4 driver lines were crossed to the females harboring UAS-CG11000-RNAi in their genome (BDSC#: 51918). All the females (♀) for the above-mentioned crosses were virgin. Among the progenies of the above-described crosses, the flies with proper genotypes (harboring both cell type-specific expression of GAL4 and UAS-CG11000-RNAi) were selected based on the absence of balancer chromosomes (e.g. CyO, TM3, and TM6B). Three RNAi lines (BDSC# 51918, VDRC# v107504 and VDRC# v102061) have been used to confirm the functional role of deathstar gene in astrocytes.
As the control group of the experiment, flies without expression of deathstar RNAi but with the same genetic background were used. In fact, the flies of the control group contained the UAS- deathstar RNAi construct in their genome but lacked any expression of GAL4 proteins. Thus, no functional RNAi will be produced in this group.
Immunostaining and imaging
Immunostaining was performed according to the previously-reported protocols [Citation39,Citation40]. In brief, brains were dissected from adults 5 days after eclosion, fixed with 4% formaldehyde for 30 min at room temperature, washed with 1X PBST (1X PBS containing 0.5% Triton-X100) three times (30 min each) and blocked in 5% normal donkey serum for 30 min. The brains were then incubated with primary antibodies in 1X PBST at 4°C overnight, followed by incubation with fluorophore-conjugated secondary antibodies for 1 hour at room temperature. Subsequently, brains were mounted with antifade mounting solution (Invitrogen, catalog number S2828) on slides for imaging.
The primary antibodies were chicken polyclonal anti-GFP (Aves Labs, catalogue number GFP-1010, 1:1000 diluted), rabbit polyclonal anti-RFP (Invitrogen, catalog number 710,530, 1:250 diluted) and mouse monoclonal anti-Bruchpilot (nc82) (DSHB, ID AB-2314866, 1:50 diluted). The applied fluorophore-conjugated secondary antibodies comprised Alexa Fluor 488-conjugated goat anti-chicken (Invitrogen, catalog number A32931, 1:100 diluted), RRX-conjugated donkey anti-rabbit (Jackson Laboratory, catalog number AB-2340613, 1:100 diluted), and Dylight 405-conjugated donkey anti-mouse (Jackson Laboratory, catalogue number AB-2340839, 1:100 diluted). Fluorescence imaging with maximum projections of z-stacks was performed under a confocal laser scanning microscope (Zeiss LSM 7 MP) and the acquired images were processed using the NIH ImageJ [Citation41], and presented by Adobe Illustrator CC 2023 for Mac.
Colocalization analysis
To perform colocalization analysis of multicolor fluorescence microscopy images, the ImageJ software was used. Initially, the individual channels of the fluorescence image were merged to create a composite view. Then, in the ‘Image’ menu, we selected ‘Type’, and then selected ‘RGB Color’ to ensure the images are displayed in the correct color format. Next, we navigated to ‘Image’, then ‘Adjust’ and selected ‘Color Threshold’, and adjusted the threshold settings to isolate the yellowish pixels indicative of colocalization, and confirmed the selection by clicking the ‘Select’ button. Subsequently, we proceeded to ‘Analyze’, and ‘Measure’ bottons. This action will open a new window displaying the measurement data for the selected area. The ‘Area’ value provided in the measurement window was recorded, as it corresponds to the area of colocalization between the two fluorophores. To calculate the percentage of the colocalized area relative to the total area of the fluorophore of interest (e.g. GFP or RFP), we readjusted the threshold settings to encompass the entire fluorophore area, then clicked on ‘Select’ again. Afterward, we repeated the measurement process by going to ‘Analyze’ and then ‘Measure’ options. This will yield the total area value for the respective fluorophore. Finally, to determine the colocalization percentage, the area values of the colocalized regions were divided by the total area values of total GFP or RFP regions. This calculation provides the colocalization level within the specified region. A representative image of three independent fluorescence imaging experiments with their colocalization regions were then presented. Also, the images were processed with ImageJ software using a threshold function to differentiate fluorescence from background. All specimens were imaged under identical conditions.
Developmental assay
To assess the possible function of deathstar gene in the development of D. melanogaster from pupae to adulthood stage, the newly eclosed D. melanogaster of the crosses in was collected and counted based on their genotypes. After counting, data were presented as the percentage of male and female flies expressing deathstar RNAi to the total number of eclosed flies.
Locomotion assay
We recorded locomotion behaviors of the flies expressing deathstar RNAi in astrocytes, and their behaviors were compared to the control group. For this purpose, three different deathstar RNAi lines were tested, and the flies without expression of deathstar RNAi but with the same genetic background were used as control groups (). To restrict the expression of RNAi in adult flies, we raised them at 18°C before they eclosed and then transferred them to 29°C following eclosion for locomotion tests. To image fly locomotion, a custom LED array was placed under the stage to serve as backlight. A 2-mm transparent acrylic board sheet was placed on top of the LED array to produce homogeneous illumination. Fly behaviors were recorded using a camera with 1920 × 1080 30 Hz (1080p30). Behavioral arenas were custom built from opaque transparent acrylic board sheets. Chambers were 30 mm in diameter and 2 mm in height. Each fly group was aspirated into a separate chamber and placed on the stage. Flies were observed for 30 min to ensure that no gross motor defects were present before video acquisition was initiated.
Video acquisition and tracking
Videos were acquired using camera at 1920 × 1080 30 Hz (1080p30). Image segmentation was performed by the custom software Fly Trajectory Dynamics Tracking (FlyTrDT) in python; First, FlyTrDT identifies and quantifies fruit flies into elliptical pixels, and we extracted 2 main features from the videos: 1) The average forward speed and 2) The trajectory map of the fly group in each chamber. For the average forward speed of each group, FlyTrDT records the moving speed of each indoor fruit fly and analyzes the average speed of 10 fruit flies per second. For the trajectory map, FlyTrDT records the movement of each indoor fruit fly, then analyzes and plots the movement trajectories of 10 fruit flies in each chamber, including the movement trajectories of the entire group and the movement trajectories of each fruit fly in the group [Citation42,Citation43].
Lifespan assay
Lifespan was measured at room temperature according to the standard protocols [Citation44]. In brief, newly ecloded flies (0 to 3 days) were collected (50 per genotype) and then placed in two vials (25 flies per vial), and transferred to fresh vials every two days. Survival was recorded for each genotype (sum of two vials). We scored flies stacked in the food as death events in all the vials analyzed. The survival curves was created with Prism version 10 (GraphPad Software, San Diego, CA, USA) using the method of Kaplan and Meier [Citation45]. For statistical significance of the experiment, one-way ANOVA method was used, and the death rate of each genotype was compared to control group which contained the flies without expression of deathstar RNAi but with the same genetic background. P-values <0.01 indicated the differences that achieved statistical significance.
Statistical analysis
Statistical analysis and graphic representations were conducted using Prism 10 for Mac (GraphPad Software, San Diego, CA, USA). Unpaired t-test or one-way ANOVA (using the Bonferroni’s multiple comparison) were applied, which was dependent on the measurements analyzed in the corresponding experiment. The averages with ± SEM in all cases were plotted. P-values were determined through two-tailed unpaired Student’s t-test, unless otherwise specified, using GraphPad Prism 10 software. *P < 0.05; **P < 0.01; ***P < 0.001, and ****P < 0.0001.
Results
Cell-type identification of single cells in the Drosophila optic lobe
Each cell type of Drosophila central nervous system is characterized by expression of a unique set of genes, known as their molecular markers [Citation15,Citation16,Citation46]. We used these markers () to identify the type of single cells in the Drosophila optic lobe, sequenced by Konstantinides et al. [Citation25], so that a particular cell type is positive for expression of its markers while negative for expression of the markers of other cell types. Based on these criteria, 156 single cells were identified as neurons, being positive for nSyb [Citation47,Citation48] and elav expression [Citation49] while negative for all glial markers; 80 single cells were identified as ALG, positive for expression of five astrocytic markers (Eaat1 [Citation10,Citation50], alrm [Citation51,Citation52], Gs2 [Citation51,Citation53], ebony [Citation50,Citation54] and Gat [Citation10,Citation55]) and lacking the expression of the markers of other glia and neurons. Also, expression pattern analysis of the markers specific to PNG: CG4797 [Citation25,Citation56], shn [Citation16] and gem [Citation25], SPG: Mdr65 [Citation9] and moody [Citation57,Citation58]), CG: Cyp4g15 [Citation59,Citation60] and wrapper [Citation25,Citation56] and EG: CG9657 [Citation50,Citation61,Citation62] and CG34340 [Citation16,Citation62], has identified 56 single cells, we assigned them all as non-ALG glia or other glia ().
Figure 1. Cell type identification of single cells in Drosophila optic lobe. (a) the list of molecular markers used in this study for cell type identification. (b) Classified single cells of D. melanogaster optic lobe based on their expression pattern for the markers. Red color denotes ‘expression,’ and black color denotes ‘no expression.’ A row Z-score was used to represent the expression level of each marker. (c) The principal component analysis (PCA) plot distinguishing the ALG single cells (red dots) from single cells of other cell types (labeled as non-ALG, green dots) based on their entire transcriptome profile. (d) Hierarchical clustering categorized ALG cells into four different clusters, all exhibiting distinct global transcriptome profile form other cell types. (e) Venn diagram illustrates the number of the genes upregulated in each ALG cluster. The table lists the common upregulated genes between all ALG clusters. Bold-face fonts represent the genes with cell type-specificity reports in previous studies. If the genes were previously attributed to a particular cell type cluster by Konstantinides et al. [Citation25], the features of the clusters are presented in the table. (f) Venn diagram illustrates the number of downregulated genes in each ALG cluster. The table lists the common downregulated genes in all ALG clusters. Also, the clustering information of Konstantinides et al. study is presented for each gene. (g) Sequence homology between CR40469 and CR34335 transcripts using ClustalW. Both sequences are shown in 5‘ → 3’ orientation. (h) Positive expression correlation of CR40469 and CR34335 genes in Drosophila optic lobe (n = 120,000 single cells). (i) Increased expression of deathstar gene in Eaat1-expressing (Eaat1+) cells in Drosophila optic lobe.
![Figure 1. Cell type identification of single cells in Drosophila optic lobe. (a) the list of molecular markers used in this study for cell type identification. (b) Classified single cells of D. melanogaster optic lobe based on their expression pattern for the markers. Red color denotes ‘expression,’ and black color denotes ‘no expression.’ A row Z-score was used to represent the expression level of each marker. (c) The principal component analysis (PCA) plot distinguishing the ALG single cells (red dots) from single cells of other cell types (labeled as non-ALG, green dots) based on their entire transcriptome profile. (d) Hierarchical clustering categorized ALG cells into four different clusters, all exhibiting distinct global transcriptome profile form other cell types. (e) Venn diagram illustrates the number of the genes upregulated in each ALG cluster. The table lists the common upregulated genes between all ALG clusters. Bold-face fonts represent the genes with cell type-specificity reports in previous studies. If the genes were previously attributed to a particular cell type cluster by Konstantinides et al. [Citation25], the features of the clusters are presented in the table. (f) Venn diagram illustrates the number of downregulated genes in each ALG cluster. The table lists the common downregulated genes in all ALG clusters. Also, the clustering information of Konstantinides et al. study is presented for each gene. (g) Sequence homology between CR40469 and CR34335 transcripts using ClustalW. Both sequences are shown in 5‘ → 3’ orientation. (h) Positive expression correlation of CR40469 and CR34335 genes in Drosophila optic lobe (n = 120,000 single cells). (i) Increased expression of deathstar gene in Eaat1-expressing (Eaat1+) cells in Drosophila optic lobe.](/cms/asset/c8143754-411c-4d97-a0c1-b8e61e9ba5e2/kfly_a_2368336_f0001_oc.jpg)
Analysis of the global transcriptome profile of the identified cells through principal component analysis (PCA) illustrated a clear separation of ALG single cells from single cells of other cell types (). Further classification of the identified single cells was performed via hierarchical clustering based on the correlation coefficient of their transcriptome profile, and results illustrated four different clusters for ALG cells (clusters 1–4), three clusters for neuronal cells, and two additional clusters which were mixes of neurons and non-ALG glia ().
To identify the ALG-enriched genes, differential gene expression analysis was performed between each ALG cluster and all clusters of other cell types. Results showed that among all sets of differentially expressed genes (DEGs), the differential expression pattern of 17 genes was common between all ALG clusters, of which eleven genes showed enrichment (), while six genes showed depletion () in ALG. In fact, the ALG clusters 1 to 4 all showed the enriched expression of some previously known glial markers such as CR34335 [Citation63], Inx2 [Citation64–66], and Nrv2 [Citation23,Citation26,Citation67] and also enriched expression of the astrocyte markers CG9394 [Citation51], Eaat1 [Citation25,Citation50,Citation68], Gat [Citation50], Gs2 [Citation25,Citation69], and CG1552 [Citation51] (; table), while they exhibited the depleted expression of the markers of other cell types (e.g. gem and CG4797 (the PNG markers), moody (a SPG marker), wrapper (a CG marker), and CG34340 (a EG marker)) (; table), supporting the identity of the clusters 1 to 4 as astrocytes. The full list of DEGs is presented in Supplemental file S1.
Among the identified ALG-enriched genes (; table), CR40469 and Eaat1 were previously classified by Konstantinides et al. in neuronal clusters (clusters # 23, 43, and 45 in their study) [Citation25], while Eaat1 is a well-characterized marker for astrocytes [Citation6,Citation10,Citation51,Citation68,Citation70,Citation71], and no cell type-specificity was reported yet for CR40469 gene.
Sequence analysis of CR40469 transcript (GenBank No: NR_003723.2) demonstrated that it has 96.73% identity with the transcript of the glial marker CR34335 (GenBank No: NR_133508.1) (), raising the hypothesis that the expression level reported for the CR40469 in Drosophila optic lobe single cells could be influenced by this high-degree sequence homology, hence both transcripts similarly map against Drosophila genome leading to highly similar expression counts for both genes. Expression correlation analysis of these genes across all sequenced single cells of Drosophila optic lobe (n = 120,000 cells) showed a remarkable positive correlation between their expression level (R2 = 0.93, P < 0.0001), strengthening this hypothesis ().
Eaat1 is a known glial marker which is predominantly expressed in astrocytes [Citation72]. To study which gene(s) is/are co-expressed with it, first the sequenced single cells of the Drosophila optic lobe [Citation25] were categorized based on their expression pattern for Eaat1, then differential gene expression analysis was performed between the cells ‘with’ and ‘without’ Eaat1 expression (assigned them as Eaat1+ and Eaat1− cells, respectively). Results highlighted the differential expression of an uncharacterized gene CG11000 whose expression was significantly higher in Eaat1+ cells (2.43 folds increase, P-value <0.0001) (), suggesting potential astrocytic function of this gene (similar to Eaat1 gene). The full list of the upregulated genes in Eaat1+ cells is presented in the supplemental file S2.
Positive expression correlation of deathstar with Eaat1 in Drosophila brain
The gene CG11000 was named ‘deathstar’ due to its crucial role in determining the fate of star-shaped astrocytes in fruit flies, referencing the iconic space station from Star Wars. The deathstar gene is implicated in the regulation of cell differentiation, predicted to be located in the membrane, and expressed in the adult head [Citation73]. Given the increased expression level of deathstar gene in Eaat1+ cells, its expression pattern was compared to the expression pattern of the previously known cell type markers of D. melanogaster across full set of single cells in the Drosophila optic lobe. Results showed a positive expression correlation between deathstar and Eaat1 genes, as well as the coclustering pattern of these genes in the resultant heatmap (n = 120,000 cells) (). The positive expression correlation of deathstar and Eaat1 genes was also observed in the single cells of Drosophila mid-brain (n = 28,695 cells), sequenced by Croset et al. [Citation26] ().
Figure 2. Positive expression correlation of deathstar with Eaat1. a) Heatmap analysis based on the Pearson correlation coefficient between deathstar and known molecular markers of Drosophila nervous system across sequenced single cells of Drosophila optic lobe (n = 120,000 cells). deathstar is co-clustered with the ALG markers including Eaat1 (dotted circle). b) Heatmap analysis based on the Pearson correlation coefficient between deathstar and known molecular markers of Drosophila nervous system across sequenced single cells of Drosophila mid-brain (n = 28,695). Two dotted circles in the heatmap point to the positive expression correlation of deathstar with Eaat1, among other markers. c-d) Correlation analysis of deathstar and Eaat1 expression level using a bulk RNA-seq data of developing whole brain from female D. melanogaster (n = 12 flies). e-f) Correlation analysis of deathstar and Eaat1 expression using a bulk RNA-seq data of developing whole brain of male D. melanogaster (n = 11 flies). g-j) Significant expression correlation between deathstar and Eaat1 genes across developmental time-points of female (g-h), and male (i-j) D. melanogaster, obtained from the bulk RNA-seq data analysis of developing whole brain of the flies.
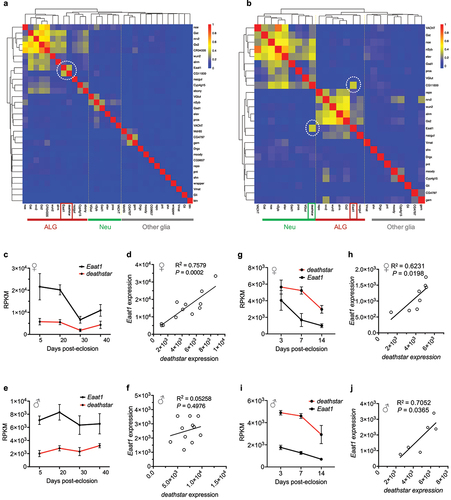
Moreover, the expression level of deathstar and Eaat1 genes was examined in a bulk RNA-seq data of developing Drosophila whole brain (GSE107049) [Citation27] and results consistently demonstrated a significant positive correlation between the expression level of these genes in females (R2 = 0.7579, P-value = 0.0002) () and at a nonsignificant level in males (R2 = 0.05258, P-value = 0.4976) (). However, the positive expression correlation of these genes was evident in both females () and males () of an additional bulk RNA-seq data from the developing whole brain of D. melanogaster (GSE199164), supporting the positive correlation between expression level of deathstar and Eaat1 genes.
Coexpression of deathstar and Eaat1 genes in Drosophila brain
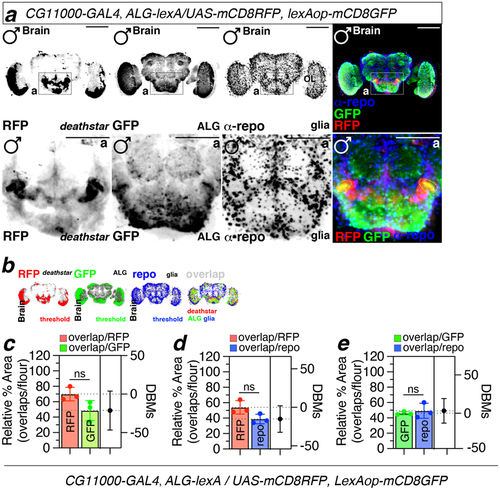
To test whether deathstar gene is co-expressed with Eaat1 in single cells of Drosophila brain, the driver lines expressing GAL4 and LexA proteins under the control of deathstar and Eaat1 promoters have been used. For this purpose, the male flies expressing GAL4 under the control of deathstar promoter and expressing LexA under the control of Eaat1 promoter were crossed to the virgin females transgenic for both UAS-mCD8RFP and lexAop-mCD8GFP constructs (), so that the expression pattern of RFP and GFP in progenies will depict the expression pattern of deathstar and Eaat1 genes, respectively. Results illustrated that the fluorescent signals corresponding to the deathstar expression (RFP) were overlapped with the Eaat1 signals (GFP) in a defined set of single cells in Drosophila midbrain (). For this experiment, Eaat1 and repo genes were used for astrocytes (green signals) and all glia (blue signals), respectively (). Quantification of data from three independent experiments showed that 64% of deathstar fluorescence signal overlapped with Eaat1 signals (), suggesting colocalized expression of these genes in Drosophila brain. These ALG cells (coexpressing deathstar and Eaat1 genes) comprised an average of 45.7% of all astrocytes in the Drosophila brain (). Also, 46% of the deathstar signals were overlapped with repo-expressing cells (). This population of glia (co-expressing deathstar and repo genes) composed an average of 33.9% of all glia in the Drosophila brain (). Using another deathstar-GAL4 line in an additional fluorescence imaging experiment also showed coexpression of deathstar and Eaat1 genes in a set of ALG cells in the Drosophila optic lobe (Supplemental file S4). These data altogether pinpoint a set of ALG single cells in the Drosophila brain, coexpressing the deathstar and Eaat1 genes.
Figure 3. Coexpression of deathstar and Eaat1 in the Drosophila brain. a) Overlapping fluorescence signals correspond to the deathstar (RFP, red) and Eaat1 (GFP, green) expression, was shown in the midbrain of D. melanogaster (denoted as yellow dotted lines in the lower panel). Anti-repo antibody (α-repo) was used for labeling the glia in the Drosophila brain (blue). Scale bars = 50 µm. b) Results of the threshold function in ImageJ to differentiate real fluorescence signals from background for optimal quantification of overlapping fluorescent signals. Red signals denote deathstar (BDSC#: 91441), green signals denote Eaat1 (BDSC#: 52719), and blue signals denote repo expression. c-e) Quantification data of the overlapping signals between deathstar and Eaat1 (c), between deathstar and Repo (d), and between Eaat1 and Repo genes (e).
Sex-biased developmental effects of deathstar gene in D. melanogaster
For functional analysis of deathstar gene, its expression was suppressed using a specific RNAi expressed in female and male flies in a cell type-specific manner. To this end, virgin females transgenic for deathstar-RNAi construct were crossed to a set of male GAL4 driver lines, enabling their progenies to express the deathstar-RNAi in different neural cell types of D. melanogaster. We took advantage to use recently developed subtype glial-GAL4 drivers which are feasibly expressed both in larval and adult subtype glial populations to determine which subtypes of glia is responsible for this phenotype [Citation16,Citation74]. The flies with the same genetic background but without deathstar-RNAi expression were used as the control group of this experiment ().
Through counting the eclosed flies of the crosses, unexpectedly, we observed a sex-biased eclosion rate for the progenies expressing deathstar-RNAi, wherein most males expressing deathstar-RNAi did not develop into adult flies (), while the females with the same genotypes normally developed into adults (), suggesting a male-specific developmental function for deathstar.
Figure 4. The effects of deathstar knock-down on normal development of D. melanogaster. a) In comparison with the control group, the majority of male progenies with deathstar knock-down did not develop into adults, indicated by significant reduction in eclosion rate (%). b) Deathstar knock-down in females did not show any developmental defects. Differences between the eclosion rates (%) of control group and the progenies with cell type-specific deathstar knock-down were not statistically significant (ns = nonsignificant). c-d) Eclosion rate of the progenies expressing an off-target RNAi, targeting the Drosophila CG15765 gene but not deathstar. The eclosion rate (%) was similar for all groups in both males and females.
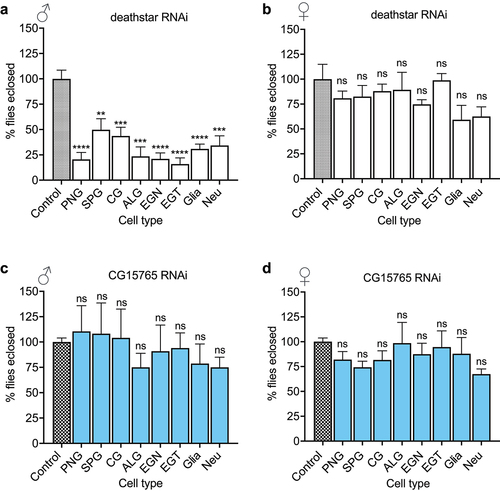
A parallel experiment with the same procedure was carried out using an off-target RNAi, which targets the Drosophila gene CG15765 (but not deathstar), and the results showed a standard ratio of males over females (~1) for all progenies which expressed CG15765-RNAi (, supporting the specificity of deathstar RNAi to impede development of male progenies.
Deathstar affects locomotion and lifespan in D. melanogaster
As revealed by this study, the expression level of deathstar and Eaat1 are positively correlated. On the other hand, Eaat1 is a well-known astrocytic marker whose expression in astrocytes was shown to be critical to locomotion activities in D. melanogaster [Citation68]. To investigate if deathstar could also affect locomotion in D. melanogaster, locomotion assay was performed on adult flies which expressed deathstar-RNAi specifically in astrocytes. Results showed that the flies with the expression of deathstar-RNAi in their astrocytes had defects in their locomotion activity in comparison with the control group, shown by reduced forward velocity values per second in a 200-second time course (). Also, the average forward velocity rate of these flies revealed remarkable decreases in the locomotion activity of the flies expressing deathstar RNAi in their astrocytes (), suggesting the crucial role of deathstar in astrocytes.
Figure 5. The effects of deathstar knock-down on the locomotion and lifespan of adult flies. a) Expression suppression of deathstar in astrocytes of male flies resulted in the decreased level of forward velocity per second, in a 200-second time course, in comparison with the control groups which do not express any RNAi (denoted as grey/black lines). b) Average velocity rate of the flies with suppressed deathstar expression in comparison with the control group (P-value <0.0001). c) Expression suppression of deathstar in astrocytes of female flies resulted in the decreased level of forward velocity per second, in a 200-second time course, in comparison with the control groups which lacked RNAi expression. d) Average velocity rate of the flies with suppressed deathstar expression in comparison with the control group (P-value <0.0001). e) Trajectory map analysis of the flies in the RNAi groups versus control groups, illustrating impeded locomotion activities in both male and female flies with suppressed expression level of deathstar using three different RNAi lines. f–g) ALG-specific reduction of lifespan in both male and female D. melanogaster, under expression suppression of deathstar gene.
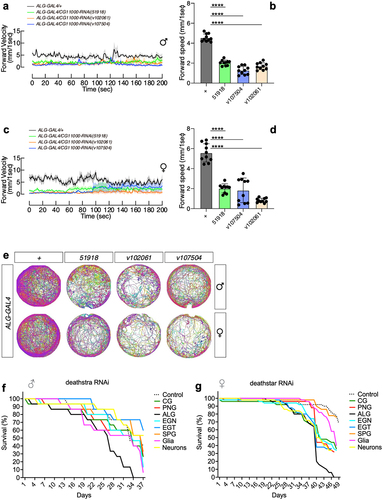
Moreover, trajectory map analysis illustrated the reduced locomotion activity of the flies under suppression of deathstar expression in astrocytes, which was confirmed by using different independent RNAi lines (). The astrocyte-specific effects of deathstar-RNAi on locomotion behaviors of D. melanogaster were identified in both male ( and female ( flies, suggesting that the function of deathstar gene on Drosophila locomotion is not sexually dimorphic.
To test the possible function of deathstar gene in D. melanogaster lifespan, we supressed its expression in different cell types through expressing the deathstar RNAi under regulation of cell type-specific GAL4 expression, then their lifespan for 40 ~ 50 days was measured. The most remarkable decreases in the lifespan were identified for the flies expressing the deathstar-RNAi specifically in their ALG cells (, supporting the astrocytic function of deathstar in shortening the lifespan of D. melanogaster. The ALG-specific effects of deathstar-RNAi on lifespan was also identified in both male () and female () flies, suggesting that the function of deathstar gene on Drosophila lifespan is not sexually dimorphic.
Discussion
Like other metazoans, the D. melanogaster brain is formed by a large number of neurons and glia, each with distinct transcriptome profile conferring them unique structural and/or functional characteristics [Citation63,Citation75]. Cells do not act individually in brain but instead they make several clusters of single cells (known as cell types [Citation10]) with specialized function and/or organization within neural circuits [Citation76–78]. PNG, SPG, CG, EG and neurons are the main well-characterized cell types in the Drosophila nervous system [Citation9,Citation15,Citation16,Citation79,Citation80].
Moreover, establishing and maintaining the identity of these cell types throughout the lifespan of the fly require expression of unique set of genes, known as molecular markers [Citation9,Citation15,Citation16,Citation23]. These markers are mostly the genes whose expression implements particular molecular pathways to specialize the development and/or function of the respective cell types [Citation81,Citation82]. In this study, we used the previously known cell type-specific markers () to classify the sequenced single cells of Drosophila optic lobe into their corresponding cell types. At least, two different molecular markers per each cell type were used for this purpose. These markers were among the best well-characterized ones in D. melanogaster, whose GAL4/UAS driver lines were also used frequently in previous studies for characterization, mapping and functional analysis of the respective cell types [Citation9,Citation15,Citation16,Citation25,Citation79,Citation80].
On the other hand, availability of the transcriptome profile of Drosophila brain at single-cell level enabled us to re-examine the identity of our classified cells, based on their similarities in their entire transcriptome. As the result, the single cells belonging to the ALG cell type (astrocytes) exhibited a far distinctive transcriptome profile versus PNG, SPG, CG, EG and neurons when they were classified based on the expression pattern of their markers (). Differential gene expression analysis showed significant enrichment of 11 genes while depletion of 6 genes in the identified ALG clusters (). In addition, while most of these identified ALG-enriched genes were among the previously reported ALG-enriched/specific markers, the Eaat1 and CR40469 genes were determined as neuronal markers by Konstantinides et al. [Citation25]. These findings led us to focus on these genes which we found them as the top ALG-enriched genes (Supplemental file S1), and also myriad number of previous studies characterized the Eaat1 as an astrocytic marker [Citation10], and no cell type specificity was reported for CR40469, yet.
CR40469 (also known as lncRNA:CR40469) spans a region of 213 kb on the X chromosome of D. melanogaster (NCBI GenBank, 2024 update). This gene is known to encode a long noncoding RNA (lncRNA) with 214 nucleotides with unknown function [Citation83–85]. Moreover, due to the high sequence identity rate between CR40469 gene and the glial marker CG34335, functional study of CR40469 via RNAi-based strategies will be challenging. In a study by Rois et al. [Citation86], a genomic knock-out of this gene in D. melanogaster was constructed and through differential gene expression analysis the greatest expression level alterations were found for the genes located on the Drosophila chromosome X, nearby the CR40469 locus (e.g. CG42259, png, and CG4313 genes). According to this data, a trans-acting function was attributed to the CR40469 lncRNA, by which it regulates the expression of its neighboring genes on chromosome X [Citation86]. Here we found that the expression pattern of CR40469 across the single cells of Drosophila optic lobe resembled that of CR34335 gene which is consistent with previous studies which reported the CR34335 gene as a glial marker [Citation63]. Also, consistent with our results for ALG-enrichment of CG40469 lncRNA, it was found by Croset et al. [Citation26] as a glial and astrocyte-enriched gene, suggesting its pivotal role in these cell types. However, further functional studies are required to elucidate the mechanistic role of CR40469 in its corresponding cell types.
Unlike CR40469 gene, Eaat1 is a well-characterized gene crucial for the development, physiology, and behaviors of D. melanogaster. When we categorized the sequenced single cells of Drosophila optic lobe based on their expression for Eaat1, we found the differential expression of an uncharacterized gene, named CG11000 (we renamed it deathstar), which was significantly higher in Eaat1+ cells versus the single cells without Eaat1 expression (). This preliminary data compelled us to investigate the expression correlation of Eaat1 and deathstar genes in Drosophila brain. Interestingly, the positive correlation was existed between these genes across the total set of single cells in Drosophila optic lobe and mid-brain, as well as across all developmental stages of Drosophila whole brain (). Beside positive correlation, deathstar was clustered in the ALG cells of Drosophila optic lobe (), while clustered in the neuronal cluster in the mid-brain () suggesting some non-ALG expression for this gene. In support of the positive expression correlation of deathstar and Eaat1 genes, their expression level in the single-cell collection of Drosophila adult brain was analyzed in SCope database [Citation87], and a significant positive correlation was observed (R2 = 0.661, P < 0.0001; supplemental file S3).
Our data also provide a comparative assessment between two approaches of cell type identification: 1-cell type identification based on the predefined set of molecular markers, and 2- cell type identification based on the similarities in whole transcriptome profile.
Since a set of multiple marker genes could not represent the complete genetic profile of a respective cell type, and on the other hand, different cell types may have similar transcriptome profile but differ only in the expression pattern of a limited number of genes, each of the above-mentioned approaches has its own pros and cons that should be considered for cell type identification purposes. For instance, Eaat1 expression pattern per se could not distinguish ALG cells from other cell types since Eaat1 was shown to be expressed also in a subset of neurons [Citation25]. Similarly, some clusters in the Konstantinides et al. study were identified as neurons based on their entire transcriptome profile (clusters # 4 and 14), while they were positive for the glial marker repo [Citation25], which necessitate testing additional markers on these clusters to reveal their actual identity. Also, studies have shown that while Repo protein is a good marker for glial cells [Citation88,Citation89], its transcripts are lowly expressed and often not detected in glial clusters [Citation90], which challenges the use of repo gene as a glial marker in RNA-seq data analyses.
In Drosophila research, the binary systems such as GAL4/UAS and LexA/LexAop are powerful genetic tools to map the expression pattern of a gene-of-interest against different cell types [Citation14]. Here, we used these systems to trace the distribution of mCD8RFP and mCD8GFP signals across the Drosophila optic lobe driven by deathstar and Eaat1 promoters, respectively. The overlapped fluorescent signals of these genes illustrated their co-expression in a set of single cells in Drosophila midbrain and optic lobe ( and supplemental file S4). However, some single cells in the Drosophila brain did not show such co-expression pattern which is consistent with the observed expression pattern of the deathstar and Eaat1 genes in a cluster of single cells in adult Drosophila brain obtained from SCope, wherein some single cells express deathstar transcripts while negative for Eaat1 expression (Supplemental file S3).
Functional analysis of deathstar revealed a male-specific developmental function of this gene which was not cell type-specific (). Such sex-biased developmental effect of the gene gene could suggest that deathstar may exert its functional role in the development of D. melanogaster through cellular and/or molecular pathways, which act differently in males and females. Further functional studies are required to elucidate the molecular mechanisms underlying the sex-biased effects of deathstar knock-down.
However, deathstar knock-down in adult flies resulted in a reduced locomotion activity in both sexes (males and females), suggesting that the effect of deathstar gene on locomotion behaviours of the fly is not sexually dimorphic ().
Besides changing the locomotion activities, deathstar knock-down resulted in shortened lifespan of both males and females in an ALG-specific manner (. This result highlights the crucial role of deathstar gene in normal lifespan of D. melanogaster, which is not sexually dimorphic.
Taken together, this study for the first time delineated the expression pattern and crucial role of the deathstar gene in normal development, locomotion and lifespan of D. melanogaster, which is an initial step toward further functional characterization of this gene.
Supplemental file S3_May 21 2024.docx
Download MS Word (1.5 MB)Supplemental file S4_May 21 2024.docx
Download MS Word (643.7 KB)Supplemental file S2_May 21 2024.xls
Download MS Excel (49 KB)Response to the comments_June 8 2024.docx
Download MS Word (17.9 KB)Supplemental file S1_May 21 2024.xls
Download MS Excel (53 KB)Acknowledgments
The stocks used in this study were from the Bloomington Drosophila Stock Center (NIH P40OD018537). We thank Khoi-Nguyen Ha Nguyen for his assistance in the experiments performed in this study. Special thanks to Hongyu Miao and Yanan Wei for their invaluable assistance. Their insights and support have greatly enriched its content.
Disclosure statement
No potential conflict of interest was reported by the author(s).
Data availability statement
The authors confirm that the data supporting the findings of this study are available within the article and its supplementary materials.
Supplemental material
Supplemental data for this article can be accessed online at https://doi.org/10.1080/19336934.2024.2368336
References
- Tolwinski NS. Introduction: Drosophila—A model system for developmental biology. MDPI; 2017. p. 9.
- Spindler SR, Hartenstein V. The Drosophila neural lineages: a model system to study brain development and circuitry. Dev Genes Evol. 2010;220(1–2):1–18. doi: 10.1007/s00427-010-0323-7
- Zhu B, Pennack JA, McQuilton P, et al. Drosophila neurotrophins reveal a common mechanism for nervous system formation. PLoS Biol. 2008;6(11):e284. doi: 10.1371/journal.pbio.0060284
- Neckameyer WS, Argue KJ. Comparative approaches to the study of physiology: Drosophila as a physiological tool. Am J Physiol Regul Integr Comp Physiol. 2013;304(3):R177–R88. doi: 10.1152/ajpregu.00084.2012
- Shin M, Copeland JM, Venton BJ. Drosophila as a model system for neurotransmitter measurements. ACS Chem Neurosci. 2018;9(8):1872–1883. doi: 10.1021/acschemneuro.7b00456
- Kim T, Song B, Lee I-S. Drosophila glia: models for human neurodevelopmental and neurodegenerative disorders. Int J Mol Sci. 2020;21(14):4859. doi: 10.3390/ijms21144859
- Devineni AV, Scaplen KM. Neural circuits underlying behavioral flexibility: insights from Drosophila. Front Behav Neurosci. 2022;15:821680. doi: 10.3389/fnbeh.2021.821680
- Huser A, Rohwedder A, Apostolopoulou AA, et al. The serotonergic central nervous system of the Drosophila larva: anatomy and behavioral function. PLOS ONE. 2012;7(10):e47518. doi: 10.1371/journal.pone.0047518
- Yildirim K, Petri J, Kottmeier R, et al. Drosophila glia: Few cell types and many conserved functions. Glia. 2019;67(1):5–26. doi: 10.1002/glia.23459
- Bittern J, Pogodalla N, Ohm H, et al. Neuron–glia interaction in the Drosophila nervous system. Dev Neurobiol. 2021;81(5):438–452. doi: 10.1002/dneu.22737
- Mayer F, Mayer N, Chinn L, et al. Evolutionary conservation of vertebrate blood–brain barrier chemoprotective mechanisms in Drosophila. J Neurosci. 2009;29(11):3538–3550. doi: 10.1523/JNEUROSCI.5564-08.2009
- DeSalvo MK, Hindle SJ, Rusan ZM, et al. The Drosophila surface glia transcriptome: evolutionary conserved blood-brain barrier processes. Front Neurosci. 2014;8:113393. doi: 10.3389/fnins.2014.00346
- Pfeiffer BD, Jenett A, Hammonds AS, et al. Tools for neuroanatomy and neurogenetics in Drosophila. Proc Natl Acad Sci USA. 2008;105(28):9715–9720. doi: 10.1073/pnas.0803697105
- Luan H, Diao F, Scott RL, et al. The Drosophila split Gal4 system for neural circuit mapping. Front Neural Circuits. 2020;14:603397. doi: 10.3389/fncir.2020.603397
- Freeman MR. Drosophila central nervous system glia. Cold Spring harbor perspectives in biology. Cold Spring Harbor Perspect Biol. 2015;7(11):a020552. doi: 10.1101/cshperspect.a020552
- Kremer MC, Jung C, Batelli S, et al. The glia of the adult D rosophila nervous system. Glia. 2017;65(4):606–638. doi: 10.1002/glia.23115
- Jenett A, Rubin GM, Ngo T-T, et al. A GAL4-driver line resource for Drosophila neurobiology. Cell Rep. 2012;2(4):991–1001. doi: 10.1016/j.celrep.2012.09.011
- Weaver LN, Ma T, Drummond-Barbosa D. Analysis of Gal4 expression patterns in adult Drosophila females. G3: Genes Genomes Genetics. 2020;10(11):4147–4158. doi: 10.1534/g3.120.401676
- Chen Y-C, Chen Y-C, Rajesh R, et al. Using single-cell RNA sequencing to generate predictive cell-type-specific split-GAL4 reagents throughout development. Proc Natl Acad Sci USA. 2023;120(32):e2307451120. doi: 10.1073/pnas.2307451120
- Yeung K, Bollepogu Raja KK, Shim Y-K, et al. Single cell RNA sequencing of the adult drosophila eye reveals distinct clusters and novel marker genes for all major cell types. Commun Biol. 2022;5(1):1370. doi: 10.1038/s42003-022-04337-1
- Bollepogu Raja KK, Yeung K, Shim Y-K, et al. A single cell genomics atlas of the drosophila larval eye reveals distinct photoreceptor developmental timelines. Nat Commun. 2023;14(1):7205. doi: 10.1038/s41467-023-43037-0
- Fu Y, Huang X, Zhang P, et al. Single-cell RNA sequencing identifies novel cell types in drosophila blood. J Genet Genome. 2020;47(4):175–186. doi: 10.1016/j.jgg.2020.02.004
- Henry GL, Davis FP, Picard S, et al. Cell type–specific genomics of drosophila neurons. Nucleic Acids Res. 2012;40(19):9691–9704. doi: 10.1093/nar/gks671
- Palmateer CM, Artikis C, Brovero SG, et al. Single-cell transcriptome profiles of Drosophila fruitless-expressing neurons from both sexes. Elife. 2023;12:e78511. doi: 10.7554/eLife.78511
- Konstantinides N, Kapuralin K, Fadil C, et al. Phenotypic convergence: distinct transcription factors regulate common terminal features. Cell. 2018;174(3):622–35. e13. doi: 10.1016/j.cell.2018.05.021
- Croset V, Treiber CD, Waddell S. Cellular diversity in the Drosophila midbrain revealed by single-cell transcriptomics. Elife. 2018;7:e34550. doi: 10.7554/eLife.34550
- Pacifico R, MacMullen CM, Walkinshaw E, et al. Brain transcriptome changes in the aging Drosophila melanogaster accompany olfactory memory performance deficits. PLOS ONE. 2018;13(12):e0209405. doi: 10.1371/journal.pone.0209405
- Babicki S, Arndt D, Marcu A, et al. Heatmapper: web-enabled heat mapping for all. Nucleic Acids Res. 2016;44(W1):W147–W53. doi: 10.1093/nar/gkw419
- Wickham H. ggplot2: Elegant Graphics for Data Analysis. Use R!. Springer International Publishing, Cham; 2016. p. 203–220. doi: 10.1007/978-3-319-24277-4_10
- Kolde R, Kolde MR. Package ‘pheatmap’. R Package. 2015;1(7):790.
- Ritchie ME, Phipson B, Wu D, et al. limma powers differential expression analyses for RNA-sequencing and microarray studies. Nucleic Acids Res. 2015;43(7):e47–e. doi: 10.1093/nar/gkv007
- Schober P, Vetter TR. Two-sample unpaired t tests in medical research. Anesthesia Analgesia. 2019;129(4):911. doi: 10.1213/ANE.0000000000004373
- Oliveros JV. An interactive tool for comparing lists with Venn’s diagrams. 2007–2015. 2016 [cited 2021 Jul 15].
- Sievers F, Wilm A, Dineen D, et al. Fast, scalable generation of high‐quality protein multiple sequence alignments using clustal omega. Mol Syst Biol. 2011;7(1):539. doi: 10.1038/msb.2011.75
- Goujon M, McWilliam H, Li W, et al. A new bioinformatics analysis tools framework at EMBL–EBI. Nucleic Acids Res. 2010;38(suppl_2):W695–W699. doi: 10.1093/nar/gkq313
- Guo A, Li L, Xia S, et al. Conditioned visual flight orientation in Drosophila: dependence on age, practice, and diet. Learn Memory. 1996;3(1):49–59. doi: 10.1101/lm.3.1.49
- Brand AH, Perrimon N. Targeted gene expression as a means of altering cell fates and generating dominant phenotypes. Development. 1993;118(2):401–415. doi: 10.1242/dev.118.2.401
- Hawley HR, Roberts CJ, Fitzsimons HL. Comparison of neuronal GAL4 drivers along with the AGES (auxin-inducible gene expression system) and TARGET (temporal and regional gene expression targeting) systems for fine tuning of neuronal gene expression in Drosophila. MicroPubl Biol. 2023;2023. doi: 10.17912/micropub.biology.000885
- Kim WJ, Jan LY, Jan YN. A PDF/NPF neuropeptide signaling circuitry of male Drosophila melanogaster controls rival-induced prolonged mating. Neuron. 2013;80(5):1190–1205. doi: 10.1016/j.neuron.2013.09.034
- Wu JS, Luo L. A protocol for dissecting Drosophila melanogaster brains for live imaging or immunostaining. Nat Protoc. 2006;1(4):2110–2115. doi: 10.1038/nprot.2006.336
- Schneider CA, Rasband WS, Eliceiri KW. NIH Image to ImageJ: 25 years of image analysis. Nat Methods. 2012;9(7):671. doi: 10.1038/nmeth.2089
- Mi K, Li Y, Yang Y, et al. DVT: a high-throughput analysis pipeline for locomotion and social behavior in adult Drosophila melanogaster. Cell Biosci. 2023;13(1):187. doi: 10.1186/s13578-023-01125-0
- Scaplen KM, Mei NJ, Bounds HA, et al. Automated real-time quantification of group locomotor activity in drosophila melanogaster. Sci Rep. 2019;9(1):4427. doi: 10.1038/s41598-019-40952-5
- Linford NJ, Bilgir C, Ro J, et al. Measurement of Lifespan in Drosophila melanogaster. J Vis Exp. 2013 71;(71):e50068. doi: 10.3791/50068-v
- Stalpers LJ, Kaplan EL, Edward L. Kaplan and the Kaplan-Meier survival curve. BSHM Bull: J Br Soc For the Hist Off Math. 2018;33(2):109–135. doi: 10.1080/17498430.2018.1450055
- Brunet Avalos C, Maier GL, Bruggmann R, et al. Single cell transcriptome atlas of the Drosophila larval brain. Elife. 2019;8:e50354. doi: 10.7554/eLife.50354
- McLaughlin CN, Brbić M, Xie Q, et al. Single-cell transcriptomes of developing and adult olfactory receptor neurons in Drosophila. Elife. 2021;10:e63856. doi: 10.7554/eLife.63856
- Deitcher DL, Ueda A, Stewart BA, et al. Distinct requirements for evoked and spontaneous release of neurotransmitter are revealed by mutations in theDrosophila gene neuronal-synaptobrevin. J Neurosci. 1998;18(6):2028–2039. doi: 10.1523/JNEUROSCI.18-06-02028.1998
- Robinow S, White K. Characterization and spatial distribution of the ELAV protein during drosophila melanogaster development. J Neurobiol. 1991;22(5):443–461. doi: 10.1002/neu.480220503
- Peco E, Davla S, Camp DM, et al. Drosophila astrocytes cover specific territories of the CNS neuropil and are instructed to differentiate by Prospero, a key effector of Notch. Development. 2016;143(7):1170–1181. doi: 10.1242/dev.133165
- Huang Y, Ng FS, Jackson FR. Comparison of larval and adult drosophila astrocytes reveals stage-specific gene expression profiles. G3. Genes Genomes Genetics. 2015;5(4):551–558. doi: 10.1534/g3.114.016162
- Doherty J, Logan MA, Taşdemir ÖE, et al. Ensheathing glia function as phagocytes in the adult Drosophila brain. J Neurosci. 2009;29(15):4768–4781. doi: 10.1523/JNEUROSCI.5951-08.2009
- Sinakevitch I, Grau Y, Strausfeld NJ, et al. Dynamics of glutamatergic signaling in the mushroom body of young adult Drosophila. Neural Dev. 2010;5(1):10–20. doi: 10.1186/1749-8104-5-10
- Suh J, Jackson FR. Drosophila ebony activity is required in glia for the circadian regulation of locomotor activity. Neuron. 2007;55(3):435–447. doi: 10.1016/j.neuron.2007.06.038
- Stork T, Sheehan A, Tasdemir-Yilmaz OE, et al. Neuron-glia interactions through the Heartless FGF receptor signaling pathway mediate morphogenesis of Drosophila astrocytes. Neuron. 2014;83(2):388–403. doi: 10.1016/j.neuron.2014.06.026
- Dillon N, Cocanougher B, Sood C, et al. Single cell RNA-seq analysis reveals temporally-regulated and quiescence-regulated gene expression in Drosophila larval neuroblasts. Neural Dev. 2022;17(1):1–18. doi: 10.1186/s13064-022-00163-7
- Schwabe T, Bainton RJ, Fetter RD, et al. GPCR signaling is required for blood-brain barrier formation in Drosophila. Cell. 2005;123(1):133–144. doi: 10.1016/j.cell.2005.08.037
- Bainton RJ, Tsai L-Y, Schwabe T, et al. moody encodes two GPCRs that regulate cocaine behaviors and blood-brain barrier permeability in Drosophila. Cell. 2005;123(1):145–156. doi: 10.1016/j.cell.2005.07.029
- Rujano MA, Briand D, Ðelić B, et al. An interplay between cellular growth and atypical fusion defines morphogenesis of a modular glial niche in Drosophila. Nat Commun. 2022;13(1):4999. doi: 10.1038/s41467-022-32685-3
- Speder P, Brand AH. Systemic and local cues drive neural stem cell niche remodelling during neurogenesis in Drosophila. Elife. 2018;7:e30413. doi: 10.7554/eLife.30413
- Sheng L, Shields EJ, Gospocic J, et al. Social reprogramming in ants induces longevity-associated glia remodeling. Sci Adv. 2020;6(34):eaba9869. doi: 10.1126/sciadv.aba9869
- Ren Q, Awasaki T, Wang Y-C, et al. Lineage-guided Notch-dependent gliogenesis by Drosophila multi-potent progenitors. Development. 2018;145(11):dev160127. doi: 10.1242/dev.160127
- Davie K, Janssens J, Koldere D, et al. A single-cell transcriptome atlas of the aging Drosophila brain. Cell. 2018;174(4):982–98. e20. doi: 10.1016/j.cell.2018.05.057
- Holcroft CE, Jackson WD, Lin W-H, et al. Innexins ogre and Inx2 are required in glial cells for normal postembryonic development of the drosophila central nervous system. J Cell Sci. 2013;126(17):3823–3834. doi: 10.1242/jcs.117994
- Luna AJF, Perier M, Seugnet L. Amyloid precursor protein in drosophila glia regulates sleep and genes involved in glutamate recycling. J Neurosci. 2017;37(16):4289–4300. doi: 10.1523/JNEUROSCI.2826-16.2017
- Chaturvedi R, Reddig K, H-S L. Long-distance mechanism of neurotransmitter recycling mediated by glial network facilitates visual function in Drosophila. Proc Natl Acad Sci USA. 2014;111(7):2812–2817. doi: 10.1073/pnas.1323714111
- Hartenstein V. Morphological diversity and development of glia in Drosophila. Glia. 2011;59(9):1237–1252. doi: 10.1002/glia.21162
- Stacey SM, Muraro NI, Peco E, et al. Drosophila glial glutamate transporter Eaat1 is regulated by fringe-mediated notch signaling and is essential for larval locomotion. J Neurosci. 2010;30(43):14446–14457. doi: 10.1523/JNEUROSCI.1021-10.2010
- You S, Yu AM, Roberts MA, et al. Circadian regulation of the Drosophila astrocyte transcriptome. PloS Genet. 2021;17(9):e1009790. doi: 10.1371/journal.pgen.1009790
- Corrales M, Cocanougher BT, Kohn AB, et al. A single-cell transcriptomic atlas of complete insect nervous systems across multiple life stages. Neural Dev. 2022;17(1):8. doi: 10.1186/s13064-022-00164-6
- Rival T, Soustelle L, Cattaert D, et al. Physiological requirement for the glutamate transporter dEAAT1 at the adult drosophila neuromuscular junction. J Neurobiol. 2006;66(10):1061–1074. doi: 10.1002/neu.20270
- Freeman MR, Delrow J, Kim J, et al. Unwrapping glial biology: Gcm target genes regulating glial development, diversification, and function. Neuron. 2003;38(4):567–580. doi: 10.1016/S0896-6273(03)00289-7
- Gramates LS, Agapite J, Attrill H, et al. FlyBase: a guided tour of highlighted features. Genetics. 2022;220(4):iyac035. doi: 10.1093/genetics/iyac035
- Miao H, Wei Y, Lee SG, et al. Glia‐specific expression of neuropeptide receptor Lgr4 regulates development and adult physiology in Drosophila. J of Neurosci Res. 2024;102(1):e25271. doi: 10.1002/jnr.25271
- Urbach R, Technau GM. Molecular markers for identified neuroblasts in the developing brain of Drosophila. Development. 2003;130(16):3621–3637. doi: 10.1242/dev.00533
- Schneider-Mizell CM, Gerhard S, Longair M, et al. Quantitative neuroanatomy for connectomics in Drosophila. Elife. 2016;5:e12059. doi: 10.7554/eLife.12059
- Sterne GR, Otsuna H, Dickson BJ, et al. Classification and genetic targeting of cell types in the primary taste and premotor center of the adult Drosophila brain. Elife. 2021;10:e71679. doi: 10.7554/eLife.71679
- Malin J, Desplan C. Neural specification, targeting, and circuit formation during visual system assembly. Proc Natl Acad Sci USA. 2021;118(28):e2101823118. doi: 10.1073/pnas.2101823118
- Awasaki T, Lai S-L, Ito K, et al. Organization and postembryonic development of glial cells in the adult central brain of Drosophila. J Neurosci. 2008;28(51):13742–13753. doi: 10.1523/JNEUROSCI.4844-08.2008
- Stork T, Bernardos R, Freeman MR. Analysis of glial cell development and function in Drosophila. Cold Spring Harb Protoc. 2012;(1):1. doi: 10.1101/pdb.top067587
- Crews ST. Drosophila embryonic CNS development: neurogenesis, gliogenesis, cell fate, and differentiation. Genetics. 2019;213(4):1111–1144. doi: 10.1534/genetics.119.300974
- Jones BW. Glial cell development in the drosophila embryo. BioEssays. 2001;23(10):877–887. doi: 10.1002/bies.1129
- Ueda M, Sato T, Ohkawa Y, et al. Identification of miR‐305, a micro RNA that promotes aging, and its target mRNA s in Drosophila. Genes Cells. 2018;23(2):80–93. doi: 10.1111/gtc.12555
- Zhang L, Zhang S, Wang R, et al. Genome-wide identification of long noncoding RNA and their potential interactors in ISWI mutants. Int J Mol Sci. 2022;23(11):6247. doi: 10.3390/ijms23116247
- Baker BM, Mokashi SS, Shankar V, et al. The Drosophila brain on cocaine at single-cell resolution. Genome Res. 2021;31(10):1927–1937. doi: 10.1101/gr.268037.120
- Amador Rios R. Unravelling the role of long noncoding RNAs in the context of cell-growth and regeneration [ Doctoral dissertation]. Universitat de Barcelona; 2022.
- Li H, Janssens J, De Waegeneer M, et al. Fly cell atlas: a single-nucleus transcriptomic atlas of the adult fruit fly. Science. 2022;375(6584):eabk2432. doi: 10.1126/science.abk2432
- Xiong W-C, Okano H, Patel NH, et al. repo encodes a glial-specific homeo domain protein required in the drosophila nervous system. Genes Dev. 1994;8(8):981. doi: 10.1101/gad.8.8.981
- Yuasa Y, Okabe M, Yoshikawa S, et al. Drosophila homeodomain protein REPO controls glial differentiation by cooperating with ETS and BTB transcription factors. Development. 2003;130(11):2419–2428. doi: 10.1242/dev.00468
- Ferreira AGA, Desplan C. An atlas of the developing drosophila visual system glia and subcellular mRNA localization of transcripts in single cells. bioRxiv. 2023:2023.08. 06.552169.