
ABSTRACT
Ion channels play pivotal role in the physiological and pathological function of immune cells. As immune cells represent a functionally diverse population, subtype-specific functional studies, such as single-cell electrophysiology require proper subset identification and separation. Magnetic-activated cell sorting (MACS) techniques provide an alternative to fluorescence-activated cell sorting (FACS), however, the potential impact of MACS-related beads on the biophysical and pharmacological properties of the ion channels were not studied yet. We studied the aforementioned properties of the voltage-gated Kv1.3 K+ channel in activated CD4+ T-cells as well as the membrane capacitance using whole-cell patch-clamp following immunomagnetic positive separation, using the REAlease® kit. This kit allows three experimental configurations: bead-bound configuration, bead-free configuration following the removal of magnetic beads, and the label-free configuration following removal of CD4 recognizing antibody fragments. As controls, we used FACS separation as well as immunomagnetic negative selection. The membrane capacitance and of the biophysical parameters of Kv1.3 gating, voltage-dependence of steady-state activation and inactivation kinetics of the current were not affected by the presence of MACS-related compounds on the cell surface. We found subtle differences in the activation kinetics of the Kv1.3 current that could not be explained by the presence of MACS-related compounds. Neither the equilibrium block of Kv1.3 by TEA+ or charybdotoxin (ChTx) nor the kinetics of ChTx block are affected by the presence of the magnetics beads on the cell surface. Based on our results MACS is a suitable method to separate cells for studying ion channels in non-excitable cells, such as T-lymphocytes.
Introduction
Ion channels play an important role in the physiology and pathophysiology of many excitable cells, such as neurons and muscle cells, as well as non-excitable cell types including lymphocytes. This is supported by the fact, that numerous diseases are caused by ion channel dysfunction [Citation1] and ion channels are the among the most common drug targets [Citation2,Citation3] as reported more than a decade ago. Presence of ion channels in immune cells is also widespread, and the functional consequences of ion channel modulation in these cells are extensively studied in immune cells [Citation4].
As immune cells represent a quite diverse functional population, there is an emerging need to properly describe the expression pattern and functional consequences of differential ion channel expression in specific sub-populations. T cell subset-specific expression of Kv1.3 and KCa3.1 ion channels stands as a good example [Citation5] as differential expression of ion channels in T cell subsets has profound functional consequences [Citation6,Citation7]. To resolve this challenging need, proper subset identification and separation is a key question. In functional ion channel studies, patch-clamp technique is a powerful tool to directly measure ionic currents attributed to specific ion channel expression [Citation8,Citation9] however, having viable cells in good condition is a must for the proper implementation of experiments, which further complicates the issue of cell separation.
In case of immune cells with complex phenotype the multiparametric fluorescence-activated cell sorting (FACS) is a commonly used option for cell separation [Citation10,Citation11]. However, for single cell functional studies (like patch-clamp) high purity and viability is prerequisite for the success of the experiments which could be jeopardized by the intense hydrodynamic stress and other factors during FACS-sorting [Citation12,Citation13]. Additionally, the instrument costs and personal requirements are high, and in case of minor populations the separation is time consuming. Beside the FACS technique, the immunomagnetic cell separation, as a more recent method, is also an option [Citation14,Citation15].
Immunomagnetic cell separation is a powerful technique for biological studies widely used in the field molecular biology, immunology, microbiology, and oncology [Citation16] providing good quality samples for many related downstream applications and giving the possibility to implement functional studies on intact cells. Having similar basic principles, there are many different factory-produced kits available [Citation17], among which the nano-sized (approx. 50 nm) bead-based technique (also known as MACS®) is one of the most widely used approaches [Citation15].
The main advantages of the immunomagnetic separation technique are the ease of application, flexibility, the relatively low instrumentation needs, and costs related to FACS [Citation17]. Besides the many advantages, classical immunomagnetic separation techniques have limitations, like difficulty of isolating complex phenotypes. Other known or still unknown pitfalls of the technique are common for both FACS – and immunomagnetic separation. For example, if we consider that after separation, the related components (e.g., antibody-fluorochrome, antibody-magnetic bead complexes) may stay on the surface of the target cells, or getting engulfed by the cells [Citation18,Citation19], cell phenotype or viability may bear alterations [Citation20]. A promising technique to overcome these disadvantages can be the subsequent removal of immunomagnetic separation complex from the cell surface after positive selection [Citation21].
The presence of the beads on the cells surface, in principle, may alter the passive (e.g capacitance) and active (e.g., operation of ion channels) electrical properties of the cell membrane. Assuming that the superparamagnetic beads may behave as a capacitor, their presence on cell surface could interfere with the cell membrane capacitance measurements and consequently, the calculation of current density (pA/pF), which parameter is widely used and accepted measure of the cell surface expression of ion channels. In addition, by their steric hindrance effect, as seen by nano-sized gold beads presented in high density at specific sites connected to the cell membrane [Citation22] the equilibrium and kinetic parameters of ion channel gating and pharmacological properties of ion channels may be altered. However, such effects related to immunomagnetic cell separation have not been examined yet.
Motivated by the aforementioned findings we set out experiments to describe the potential influence of immunomagnetic cell separation on the biophysical parameters of the membrane (capacitance) and on Kv1.3 K+ channel gating (conductance–voltage relationship and gating kinetics) using patch-clamp. Moreover, we also determined the access of the ion channel inhibitor small-molecule TEA+ and the peptide toxin charybdotoxin (ChTx) to the pore of Kv1.3 in the presence of microbeads on the surface of the CD4+ T cells.
Materials and methods
To provide optimal and straightforward experimental approach we used human T cells and the CD4 as a surface marker for separation, since the expected amount of epitopes is high and well-described [Citation23] and CD4+ T cells are extensively studied in the field of immunology and electrophysiology [Citation4,Citation7,Citation24–26]. To describe the possible biophysical alterations as a consequence of separation, we characterized the properties of Kv1.3 voltage-gated ion channel as it is highly expressed in activated T cells [Citation6] having well-described biophysical properties [Citation24].
Samples
Blood samples of healthy volunteers were collected to sodium heparin anticoagulated BD Vacutainer® tubes. Peripheral blood mononuclear cells (PBMC) were separated by density gradient centrifugation using 50 ml SepMate™ tubes (STEMCELL Technologies, Vancouver, Canada) according to the manufacturer’s protocol. After separation cells were counted and plated on αCD3/αCD28 antibody-coated 24-well flat-bottom cell culture plates in RPMI-1640 supplemented with 10% fetal bovine serum, stable glutamine, antibiotics and 10 mM HEPES (0.7 million/well) for 72 hours. Antibody coating was made by incubating the plates with 1.5µg of αCD3 and 0.75 µg of αCD28 antibodies in 500 µl PBS for each well at 4°C overnight.
Cell separation and experimental configurations
After 72 h activation, cells were harvested, counted, and separated based on CD4 expression using three different techniques, REAlease®, negative selection-based magnetic separation, and fluorescence-activated cell sorting. In the first case, cells were separated using REAlease® CD4 MicroBead Kit (Cat. No.: 130–117-037, Miltenyi Biotec B.V. & Co. KG, Bergisch Gladbach, Germany) according to the manufacturer's protocol with minor modifications. The technique in brief is based on the incubation of the PBMC sample with REAlease CD4-biotin, recombinantly engineered low-affinity antibody fragments multimerized in a biotinylated complex (REAlease complex). This is followed by the labeling of the REAlease complex with a microbead conjugated antibody targeting biotin (Anti-Biotin MicroBead). CD4+ cells were eluted from the separation column and the eluted cell population was split into two portions. The Anti-Biotin MicroBead complex was not removed from one portion allowing us to create the “Bead-bound” configuration. The “Bead-free” configuration was created by removing the Anti-Biotin MicroBeads with the provided REAlease Bead release reagent. The third population of cells was constructed from the Bead-free configuration by removing the REAlease complex using Release Reagent to create the “Label free” configuration ().
Figure 1. Schematic illustration of cell separation techniques and the resulting configurations
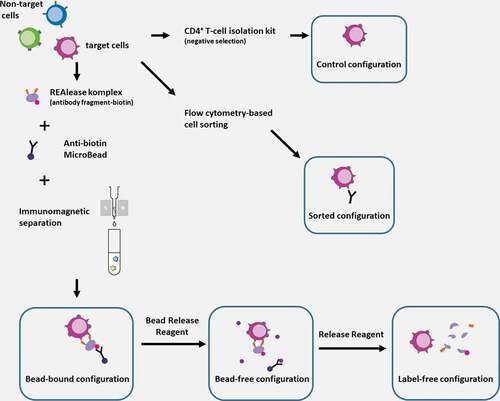
Immunomagnetic negative selection-based separation (CD4+ T Cell Isolation Kit Cat. No.: 130–096-533 Miltenyi Biotec B.V. & Co. KG, Bergisch Gladbach, Germany) was prepared to isolate cells without labeling of the CD4 molecule, and these cells served as the “Control” configuration (). Using fluorescence-activated cell sorting (FACS) based on CD4 labeling with fluorescence conjugated primary antibody, a “Sorted” configuration () was also established. Electrophysiology experiments as well as purity and viability measurements were implemented subsequently after separation.
Flow cytometry
Cell sorting and determination of purity and viability were made via BD FACSAria III flow cytometer (BD Biosciences, San Jose, CA, USA). For cell sorting, activated PBMC samples were stained with CD4-FITC antibody (Clone: SK3, BioLegend Inc. San Diego, CA, USA) and sorted in cooled (4°C) RPMI-1640 supplemented with 10% fetal bovine serum, stable glutamine, antibiotics and 10 mM HEPES. To assess viability and purity after immunomagnetic separation we used the 8-Color Immunophenotyping kit (Cat. No.: 130–120-640 Miltenyi Biotec B.V. & Co. KG, Bergisch Gladbach, Germany), while in case of FACS-sorting, purity was assessed by measuring CD4 positivity in the sorted sample (after viability staining, see below). Purity was expressed in the percentage of viable cells.
Viability was determined by 7-AAD staining [Citation27] and it was expressed as a percentage of single cells, that were identified based on conventional FSC-gating. Flow cytometry data were analyzed with FCS Express 6 software (De Novo Software, Glendale, CA, USA).
Electrophysiology
Patch clamp experiments were carried out in whole-cell configuration and voltage-clamp mode using Axopatch 200B or Multiclamp 700B amplifiers, Axon Digidata 1550A or 1440A data acquisition hardware (Molecular Devices Inc., Sunnyvale, CA, USA). Micropipettes were pulled in four stages using a Flaming Brown automatic pipette puller (Sutter Instruments, San Rafael, CA) from GC 150 F-7.5 standard borosilicate capillaries (Harvard Apparatus Co., Holliston, MA) resulting electrodes having 3–6 MΩ resistance in the bath solutions. Pipettes were filled with standard KF-based internal solution consisted of (in mM) 140 KF, 1CaCl2, 2 MgCl2, 11 EGTA, 10 HEPES, pH 7.22. As bath solution, a standard solution was applied, which consisted of (in mM) 145 NaCl, 5 KCl, 10 HEPES, 5.5 Glucose, 2.5 CaCl2, 1 MgCl2 pH 7.35. Experiments were made at room temperature (20–24°C).
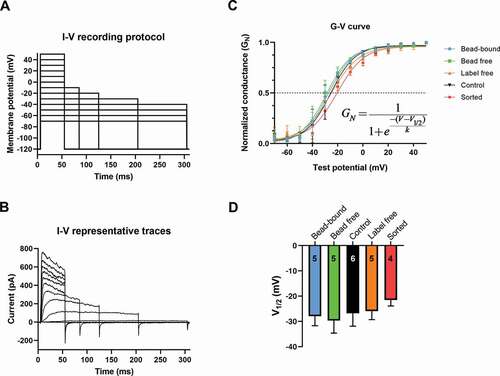
Activation kinetics and pharmacological measurements on Kv1.3 channels were implemented by depolarizing the cells from –120 mV holding potential to +50 mV test potential for 15 ms with 15s inter-pulse interval (ipi, the time elapsed between two consecutive depolarization pulses). The 15-ms-long depolarizing pulse is sufficient to completely activate channels but is short enough to induce only negligible inactivation. Inactivation kinetics was measured by depolarizing the cells from the holding potential of –120 mV to +50 mV for 2000 ms in every 60 s to provide full recovery from inactivation to the Kv1.3 channels. The voltage protocol for the cell capacitance measurement consisted of hyperpolarizing test potentials from the holding potential of –80 mV to either –100 mV or –110 mV for 15 ms with 10s ipi in the absence of cell capacitance compensation. The voltage dependence of steady-state activation (current-membrane potential relationship (I–V)) was measured by depolarizing the cells from –120 mV holding potential to test potentials ranging from –70 to +50 mV in 10 mV steps (15s ipi) and with sequentially decreasing depolarization durations to avoid significant inactivation of the Kv1.3 channels during the test pulses (see ). In general, – 120 mV holding potential was used to provide rapid and complete recovery from inactivation during the measurements [Citation28] and to avoid steady-state inactivation of Kv1.3 [Citation29]. In case of pharmacological measurements, gravity-driven perfusion system was also used to provide the necessary solution exchange around the cells. Full solution exchange was always confirmed prior to the measurements using 10 mM TEA+ solution. All recordings were evaluated using Clampfit 10.6 software (Molecular Devices Inc., Sunnyvale, CA) in a standardized manner. Before analysis, current traces were digitally filtered with a three-point boxcar smoothing filter. In case of activation kinetics, a single exponential function rising to the maximum, according to the Hodgkin-Huxley n4-model, was fitted to the data points (see ) and the resulting τact activation time constants were compared. In case of inactivation kinetics measurements, curves were fitted with a standard single exponential function to the decaying part of the currents and the resulting inactivation time constant (τinact) values were compared (see ). Cell capacitance recordings were evaluated with both numerical integration and time-domain technique [Citation30] for both test potentials of –100 mV and –110 mV. If the cell capacitance values obtained by the two methods differed by more than 10% then those data were excluded from the subsequent analysis. During the analysis of the current-membrane potential (I–Vtest) relationship, the whole cell K+ conductances (G) were calculated for every test potential after leak correction using G(V) = Ipeak/(Vtest–EK) where EK is the Nernst potential of K+. Then the G(V) values were normalized to the maximum K+ conductance for a given cell and plotted as a function of test potential. Curves were fitted according to the Boltzmann equation, as shown in , V1/2 values obtained for different configurations (e.g. bead-bound) were compared. Records were discarded when leak or non-voltage dependent current at the holding potential, prior to the test potentials, was more than 5% of the peak current at +50 mV test potential.
Statistical analysis
Variance between groups was analyzed with One-Way ANOVA in case of more than two groups. Normality was tested with Shapiro-Wilk or Kolmogorov-Smirnoff test. In case of normal distribution, all pairwise multiple comparison (Holm-Sidak) post hoc test was made to describe the differences. Samples having non-normal distribution (p < 0.05) were compared via ANOVA on ranks test. To compare two groups, we used two-sample Student’s t-test. The level of significance was p < 0.05. Values are given and plotted as mean±SD, unless otherwise stated.
Results
Separation efficiency and viability
In order to assess the suitability of the REAlease® separation technique for single-cell electrophysiology, the purity and the viability of T cells separated based on CD4 expression were determined and compared to the conventional FACS-based positive selection and MACS-based negative selection using flow cytometry. The purity of the cell populations was expressed as the percentage of CD4 positive cells in the living cell population. The purity reached using REAlease® separation was 99.35 ± 0.48% (n = 3), it was 95.17 ± 2.78% (n = 3) in case of negative selection, whereas FACS separation (purity mode) resulted 96.06 ± 0.40% (n = 3) purity (see and Materials and Methods for details on separation). There was no significant difference between the three groups ().
Figure 2. Comparison of viability and purity after the different separation techniques
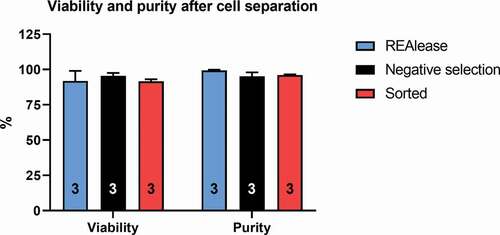
Viability was 91.86 ± 7.15% (n = 3) in case of REAlease® separation (measured after the complete removal of bead-antibody and REAlease® complex, see , label-free configuration) while 95.55 ± 2.05% (n = 3) in case of immunomagnetic negative selection and 91.65 ± 1.40 by FACS-sorted samples. There were no statistically significant differences among the viabilities obtained using the three methods ().
Cell membrane capacitance measurements
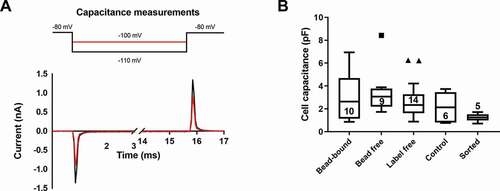
The capacitance of the plasma membrane was determined using hyperpolarizing test potentials to −100 mV or −110 mV from a holding potential of −80 mV () in whole-cell mode of the patch-clamp. These test potentials do not activate voltage-gated, depolarization activated ion channels commonly expressed in T cells [Citation31]. The currents recorded, following the compensation of the pipette capacitance, are the ones needed to charge the cell membrane as a capacitor to the test potential of −100 mV or −110 mV (), which is proportional to the surface are of the cell membrane [Citation32]. For small cells, like lymphocytes, numerical integration of the area under the curve () or the time-domain technique allows a more accurate determination of the cell membrane capacitance than the readout of the whole-cell capacitance compensation circuit of the amplifier, thus, these methods were employed [Citation30]. Cells with more than 10% difference in the capacitance values obtained using the integration and the time-domain technique were excluded from the analysis in panel B of . This arbitrary exclusion criterion was needed to restrict the data analysis to cell populations with reliable capacitance determinations. Cell capacitance data were compared using ANOVA-on ranks test due to non-normal distribution of the datasets. Beside the lack of a statistically significant difference among the groups we have to highlight that in case of immunomagnetic separation techniques (either REAlease® or negative selection) the size of the separated cells (reflected by the cell membrane capacitance) showed wider distribution while the FACS-sorted cells had more discrete size distribution.
Figure 3. Comparison of the cell membrane capacitance of separated cells
Activation and inactivation kinetics of the Kv1.3 current is insensitive to the presence of the beads
Depolarizing test pulses to +50 mV from the holding potential of −120 mV evoked robust outward currents in human T cells (aand c). Under the experimental conditions applied (test potential and ionic composition of the pipette filling and extracellular solutions), the whole-cell currents in human T cells are produced by the voltage-gated Kv1.3 K+ channel [Citation33]. Short, 15-ms-long depolarization pulses fully activate the whole-cell current without noticeable inactivation (). We determined the activation time constant (τact) of the Kv1.3 current in each experimental configuration to study the activation kinetics of the current. The τact values were 0.62 ± 0.13 ms in bead-bound, 0.56 ± 0.07 ms in bead free, 0.57 ± 0.09 ms in control, 0.46 ± 0.07 ms in label-free while 0.68 ± 0.12 ms in sorted configuration ( and b). There was a significant difference between the τact values obtained in the bead-bound and label-free (p = 0.026) and the sorted and label-free configurations (p = 0.003).
Figure 4. Comparison of activation and inactivation kinetics of Kv1.3 ion channel in different experimental configurations
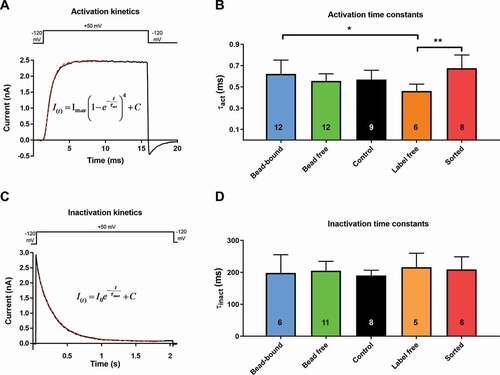
The inactivation kinetics of Kv1.3 showed was studied using 2-s-long depolarizing pulses, which allow complete inactivation of the Kv1.3 channels (). The inactivation time constant (τinact) was determined by fitting a single-exponential function to the decaying part of the current. The τinact was 198.4 ± 56.8 ms in bead-bound, 205.4 ± 29.2 ms in bead free, 190.5 ± 16.4 ms in control, 216.4 ± 43.7 ms in label-free while 209.5 ± 39.3 ms in sorted configuration ( and d). There was no statistically significant difference in τinact among the groups.
Conductance-membrane potential relationship of Kv1.3 channel
The key biophysical parameter of Kv1.3 gating is the membrane potential where the channels are activated and can accomplish their physiological functions. This is reflected in the conductance-membrane potential (G-V) curves, representing the voltage-dependence of steady-state activation of Kv1.3. To obtain the G-V relationships peak whole-cell currents (Ipeak) at different test potentials (Vtest), ranging from −70 to +50 mV, were measured ( and b) and the K+ conductances were determined as G = Ipeak/(Vtest–EK) using a reversal potential of EK = −85 mV. The normalized conductance-voltage (GN-V) relationships for each experimental configuration, are shown on . The V1/2 values, which are characteristic of the membrane potential at which 50% of the channels are open, were obtained by fitting the Boltzmann function to the G-V relationship of individual cells. The V1/2 values were –27.9 ± 3.8 mV in bead-bound (n = 5), –29.6 ± 5.0 mV (n = 5) in bead free, –26.8 ± 5.1 mV (n = 6) in control, –25.9 ± 3.4 mV (n = 5) in label-free while – 21.5 ± 2.4 mV (n = 4) in sorted configuration (), there was no significant difference among the groups.
Figure 5. Conductance-membrane potential relationships (G-V curve) measured in different configurations
Pharmacological measurements
To elucidate the role of an ion channel in a physiological/pathological process, blockers specific for a given channel are commonly used. The presence of the bead-antibody complex on the cell surface may affect the access of the drugs to the channel, especially when the binding site is on the extracellular surface of the channel. The bead-antibody complex on the cell surface may also alter the block equilibrium, the kinetics of the block, or both. This scenario was tested using the small-molecule K+ channel blocker Tetraethylammonium, (TEA+, 130.25 g/mol, ~4.5Å) and the relatively large molecule, the 37 amino acid peptide blocker of Kv1.3, Charybdotoxin, (ChTx, 4296 Da, 15 Å by 25 Å ellipsoid [Citation34]) on the Kv1.3 channel in T cells in the presence (bead-bound configuration) or absence (control configuration) of bead-antibody complex on cell surface. To determine the equilibrium block of the channels the inhibitors were tested at three different concentrations for TEA+ (1mM, 10 mM or 100 mM, ) or ChTx (0.1 (or 0.3) nM, 3 nM, or 30 nM, ) using standard protocols in the laboratory [Citation35,Citation36]. Whole-cell Kv1.3 currents were evoked by test pulses to +50 mV and the peak currents measured in the presence (I) and the absence of the inhibitor (I0) were used to calculate the remaining current fraction as RCF = I/I0 at each inhibitor concentration. The blocked current fractions were calculated as b =1−RCF and the 1/b values were plotted as a function of the reciprocal of antagonist concentration (1/c) (Lineweaver-Burk linearization, ( and d). The slope of the fitted line gives the IC50 value of the antagonist. There were no statistically significant differences between the IC50 values measured for bead-bound and control configurations either for TEA+ (9.68 ± 1.37 mM vs. 10.27 ± 0.71 mM, n ≥ 3, p = 0.527, , left) or for ChTx (1.55 ± 0.54 nM vs. 1.47 ± 0.89 nM, n ≥ 3, p = 0.845, , right).
Figure 6. Kv1.3 pharmacology in bead-bound and control cells
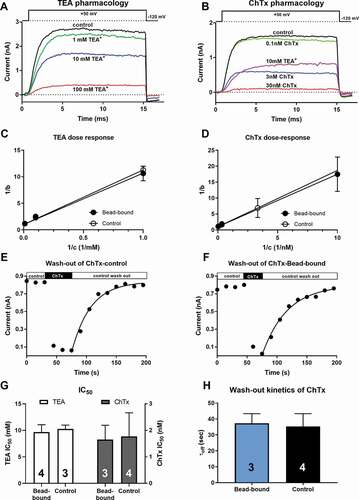
Even if the equilibrium block is insensitive to the presence of the beads, the development of or the recovery from block may be altered by steric hindrance [Citation22]. This scenario was tested for ChTx only, since block kinetics of TEA+ cannot be resolved using electrophysiology. The block of the whole-cell current in the presence of TEA+ is the consequence of the apparent reduction in the single-channel currents caused by reversible block and unblock events on a timescale beyond the resolution of the recording apparatus [Citation37]. Moreover, the development of the block in the presence of ChTx is very fast (), especially at high toxin concentrations, as compared to the frequency of obtaining peak currents. A characteristic feature of Kv1.3 is cumulative inactivation, which means that repeated depolarizations with short intervals results in a gradual loss of the current [Citation38]. This limits the frequency of depolarizations to ~4/min (ipi = 15 s) in human T cells [Citation35,Citation39,Citation40]. show that the peak currents prior to the application of the inhibitor are constant at ipi = 15s, which confirms the suitability of the protocol to obtain reproducible currents. Due to this limitation of depolarization frequency, we did not characterize the kinetics of the development of the block for ChTx. On the other hand, wash-out of the ChTx block was readily resolved following the switch of the perfusion system to toxin-free solution (). The wash-out kinetics was characterized by the time constant (τoff) obtained by fitting a single-exponential rising function to the data points (, solid lines). There was no significant difference between the τoff values for the bead-bound (τoff = 37.34 ± 6.02s, n = 3) and control configuration (τoff = 35.31 ± 8.04s, n = 4, p = 0.731, ).
Discussion
In this study, we have assessed the suitability of an immunomagnetic positive selection technique (REAlease®) for patch-clamp electrophysiology of CD4+ T cells. We showed that the presence of the immunomagnetic beads on the cell surface does not interfere with the cell membrane capacitance measurements, and thus, normalizing the currents on membrane capacitance can be a reliable method to determine current density (pA/pF) of bead-bound cells as well. Moreover, we showed that the presence of the beads on the cell surface does not interfere with the operation of Kv1.3, the predominant voltage-gated K+ channel of T cells. We found that neither the activation and inactivation kinetics of the whole cell Kv1.3 current nor the voltage-dependence of steady-state activation of the channels was sensitive to the presence of the immunomagnetic beads. We have also demonstrated that the equilibrium block of the Kv1.3 channels by the small-molecule inhibitor TEA+ and the peptide toxin ChTx as well as the kinetics of the ChTx block are similar in bead-bound and control, negatively selected T cells. Based on our results we strongly favor the idea that the immunomagnetic cell separation, particularly the MACS® technique is a suitable method for electrophysiology experiments on immune cells.
We demonstrated that immunomagnetic positive and negative separation techniques result in the sample purity as FACS sorting. It is important to highlight that the purity in case of FACS sorting highly depends on the instrument settings [Citation41]. In our setting (“purity mode” of FACS) the expected and obtained purities are similar to the data that we achieved using the immunomagnetic separation techniques with the disadvantage of potentially decreased recovery [Citation42]. It is also well-known that FACS may have significant effects on cell viability [Citation14] and even minor changes in the experimental conditions have significant effect on the outcomes. With optimal experimental conditions the viability reached via FACS sorting is similar to that of our immunomagnetic sorting [Citation43], as reflected by our results. We have the experience that in many cases, FACS-sorted cells (sorted configuration) are much more stressed possibly due to the high shear stress [Citation12,Citation13] and high voltage (as shown in case of sorting bacteria samples [Citation44]) during the sorting process. The exclusion of patch-clamp records due to technical inappropriateness in case of membrane capacitance and I–V measurements (as described below) was more frequent for FACS-sorted cells, however, it did not reach mathematical significance as examined by Fischer-exact test (data not shown). Beside this, we can subjectively conclude that the sealing efficiency (i.e., obtaining high-quality seals between the patch pipette and the membrane in the order of GΩ) was also affected in case of sorted configuration, however, there were no statistical analyses made. This may become significant for sealing efficiency using pipette filling solutions other than KF, especially with higher free Ca2+ concentrations to record the calcium-activated potassium channel KCa3.1 − which is another prominent ion channel in T-cells [Citation45,Citation46]. This was reflected by our experience on FACS-sorted tissue resident T-cells isolated from bowel biopsy specimens (data not shown). The MACS® based techniques may be superior in these cases.
The biophysical parameters of Kv1.3 were mostly insensitive to the presence of beads or any REAlease® components, and even if there was a statistically significant difference between τact values describing the kinetics of Kv1.3 current activation, we do not attribute biological significance to this for three reasons. First, the activation kinetics are fast in any of the configurations, more than two orders of magnitude faster than the inactivation kinetics of the currents, i.e., the channels do open well-before inactivation takes place (), and thus, a negligible change in the activation kinetics should not affect the mean open time of the channels. Second, the τact values were in the normal physiological range characteristic for Kv1.3 [Citation24] in all samples. Third, the activation kinetics of the current in the control sample did not differ from any of the configurations. It is also important to note, that neither the bead-bound nor the bead-free configuration was different from the control and sorted configuration in this parameter. This indicates that none of the components of the REAlease® complex modified the activation kinetics of the Kv1.3 current.
Beside these, neither the inactivation kinetics of Kv1.3 current, nor the cell capacitance values of the measured T-lymphocytes showed statistically significant differences; however, as we highlighted the FACS-sorted cells showed more discrete cell capacitance (and consequently size) as compared to the MACS-sorted samples (either REAlease® or negative selection). This may be due to the fundamental differences between the two separation techniques; in case of FACS sorting, the routinely applied forward scatter (FSC) gating discriminates the size of cells, whereas in case of immunomagnetic separation techniques, this factor is absent. Our data show that the presence of the magnetic beads does not alter the physical properties of the membrane and its surrounding liquid to be reflected in the membrane capacitance of the cells. Thus, current density, i.e. current normalized to the cell membrane capacitance (pA/pF), commonly used to quantify the expression of ion channels in a given cell, is a valid variable when magnetic bead-based separation is applied.
The V1/2 values – descriptive of the conductance-membrane potential relationship – are consistent with the literature, being in the range described for Kv1.3 in lymphocytes [Citation24,Citation47]. The voltage sensor of voltage-gated ion channels traverses the transmembrane electric field during activation and as such, the gating apparatus is sensitive to multiple factors, among others, the surrounding lipids [Citation48], externally applied charged fatty acids [Citation49], and cell surface charge screening by divalent cations [Citation50]. Some of these effects are based on electrostatic interactions with the voltage sensor. Our results indicate, that the presence of paramagnetic beads on the cell surface does not interfere with the voltage sensor apparatus of Kv1.3, i.e. the alterations in the local electrostatic caused by the presence of the beads is not large enough to be resolved using our experimental approach. In conclusion, the voltage-dependent gating of Kv1.3 is not affected by the presence of the beads and thus, the magnetic bead-based separation method applies to electrophysiological studies of lymphocytes.
According to our pharmacological measurements, neither the equilibrium block (IC50) of both TEA+ and ChTx nor the off-rate (koff = 1/τoff) of the ChTx is affected by the presence of the beads on cell surface. The lack of effect on IC50 and τoff in case of ChTx indicates, that the wash-in kinetics of the peptide antagonist is also unaffected by the bead-antibody complex presence on the cell surface [Citation51]. In summary, our pharmacological experiments clearly showed that the presence of bead-antibody complex on cell surface did not alter either block equilibrium for TEA+ and ChTx or the block kinetics for the large peptide blocker, ChTx. This insensitivity of the blockers to the presence of the beads is different form the used of ~30 nm diameter gold particles conjugated to monoclonal antibodies targeting MHCI and MHC II molecules and the α subunit of the IL-2 receptor, where a slower association kinetics of a scorpion toxin (Pi2) and Kv1.3 was observed [Citation22]. The insensitivity of Kv1.3 block to the presence of the beads might be important in physiological assays, where Kv1.3 blockers are widely used to inhibit the proliferation of various T cell subsets [Citation52,Citation53].
Conclusions
Isolation of T cells and T cell subset for functional assays, including electrophysiology, is a key to understand the physiological/pathophysiological roles of the immune cells. The option to remove the bead-antibody complex from cell surface [Citation21] overcomes an important drawback of the MACS® technique, i.e. the limitation in the identification of more complex lymphocyte subpopulations. In this respect we have shown clearly that neither the presence of the antibody-bead complex (bead-bound) nor the two subsequent steps to obtain the label-free sample influence the use of the cells for single-cell electrophysiology (patch-clamp) and alter the biophysical and pharmacological properties of Kv1.3, the predominant voltage-gated K+ channel of lymphocytes. Based on our results we strongly favor the idea that the immunomagnetic cell separation, particularly the MACS® technique is a suitable method for electrophysiology experiments on immune cells.
List of abbreviations
7-AAD: 7-Aminoactinomycin D, ANOVA: analysis of variance, ChTx: Charybdotoxin, FACS: Fluorescence-Activated Cell Sorting, FSC: forward scatter, G-V: conductance-membrane potential relationship, HEPES: 4-(2-hydroxyethyl)-1-piperazineethanesulfonic acid, IC50: half maximal inhibitory concentration, ipi: inter-pulse interval, I-V: current-membrane potential relationship, KCa3.1: intermediate/small conductance calcium-activated potassium channel, subfamily N, member 4, Kv1.3: Voltage-Gated Potassium Channel, Shaker-Related Subfamily, Member 3, MACS: Magnetic-Activated Cell Sorting, pA: picoampere, PBMC: peripheral blood mononuclear cell, PBS: Phosphate Buffered Saline, pF: picofarad, RCF: remaining current fraction, TEA+: Tetraethylammonium ion, V1/2: midpoint voltage of activation, τact: activation time constant, τinact: inactivation time constant.
Ethics approval and consent to participate
The present study was approved by the Ethical Committee of the Hungarian Medical Research Council (36255-6/2017/EKU). Informed consent was obtained from each participant. The investigation conforms to the principles outlined in the Declaration of Helsinki.
Acknowledgments
We thank the expert technical assistance of Adrienn Bagosi and Cecilia Nagy.
Data Availability statement
The datasets used and/or analyzed during the current study are available from the corresponding author on reasonable request.
Disclosure statement
CE is an employee of Miltenyi Biotec B.V. & Co. KG. The other authors declare that the research was conducted in the absence of any commercial or financial relationships that could be construed as a potential conflict of interest.
Additional information
Funding
References
- Hübner CA, Jentsch TJ. Ion channel diseases. Hum Mol Genet. 2002;11(20):2435–2445.
- Clare JJ. Targeting ion channels for drug discovery. Discov Med. 2010;9:253–260.
- Overington JP, Al-Lazikani B, Hopkins AL. How many drug targets are there? Nat Rev Drug Discov. 2006;5(12):993–996.
- Feske S, Wulff H, Skolnik EY. Ion channels in innate and adaptive immunity. Annu Rev Immunol. 2015;33(1):291–353.
- Wulff H, Beeton C, Chandy KG. Potassium channels as therapeutic targets for autoimmune disorders. Curr Opin Drug Discovery Dev. 2003;6:640–647.
- Beeton C, Chandy KG. Potassium channels, memory T cells, and multiple sclerosis. Neuroscientist. 2005;11(6):550–562.
- Beeton C, Wulff H, Standifer NE, et al. Kv1. 3 channels are a therapeutic target for T cell-mediated autoimmune diseases. Proc Nat Acad Sci. 2006;103(46):17414–17419.
- Sakmann B, Neher E. Patch clamp techniques for studying ionic channels in excitable membranes. Annu Rev Physiol. 1984;46(1):455–472.
- Matteson D, Deutsch C. K channels in T lymphocytes: a patch clamp study using monoclonal antibody adhesion. Nature. 1984;307(5950):468–471.
- Perfetto SP, Chattopadhyay PK, Roederer M. Seventeen-colour flow cytometry: unravelling the immune system. Nat Rev Immunol. 2004;4(8):648–655.
- Hulett HR, Bonner WA, Barrett J, et al. Cell sorting: automated separation of mammalian cells as a function of intracellular fluorescence. Science. 1969;166(3906):747–749.
- Mollet M, Godoy‐Silva R, Berdugo C, et al. Computer simulations of the energy dissipation rate in a fluorescence‐activated cell sorter: implications to cells. Biotechnol Bioeng. 2008;100(2):260–272.
- Seidl J, Knuechel R, Kunz‐Schughart L. Evaluation of membrane physiology following fluorescence activated or magnetic cell separation. Cytometry J Int Soc Anal Cytol. 1999;36(2):102–111.
- Thiel A, Scheffold A, Radbruch A. Immunomagnetic cell sorting—pushing the limits. Immunotechnology. 1998;4(2):89–96.
- Miltenyi S, Müller W, Weichel W, et al. High gradient magnetic cell separation with MACS. Cytometry J Int Soc Anal Cytol. 1990;11(2):231–238.
- Borlido L, Azevedo A, Roque A, et al. Magnetic separations in biotechnology. Biotechnol Adv. 2013;31(8):1374–1385.
- Plouffe BD, Murthy SK, Lewis LH. Fundamentals and application of magnetic particles in cell isolation and enrichment: a review. Rep Prog Phys. 2014;78(1):016601.
- Chalmers J, Xiong Y, Jin X, et al. Quantification of non‐specific binding of magnetic micro‐and nanoparticles using cell tracking velocimetry: implication for magnetic cell separation and detection. Biotechnol Bioeng. 2010;105:1078–1093.
- Jing Y, Mal N, Williams PS, et al. Quantitative intracellular magnetic nanoparticle uptake measured by live cell magnetophoresis. Faseb J. 2008;22(12):4239–4247.
- Mahmoudi M, Azadmanesh K, Shokrgozar MA, et al. Effect of nanoparticles on the cell life cycle. Chem Rev. 2011;111(5):3407–3432.
- Evaristo C, Steinbrück P, Pankratz J, et al. REAlease™ Immunomagnetic separation technology with reversible labeling for positive selection of leukocytes. Am Assoc Immnol. 2018;200:174.8-174.8.
- Rubovszky B, Hajdu P, Krasznai Z, et al. Detection of channel proximity by nanoparticle-assisted delaying of toxin binding; a combined patch-clamp and flow cytometric energy transfer study. Eur Biophys J. 2005;34(2):127–143.
- Davis KA, Abrams B, Iyer SB, et al. Determination of CD4 antigen density on cells: role of antibody valency, avidity, clones, and conjugation. Cytometry. 1998;33(2):197–205.
- Hajdú P, Varga Z, Pieri C, et al. Cholesterol modifies the gating of Kv1. 3 in human T lymphocytes. Pflügers Archiv. 2003;445(6):674–682.
- Panyi G. Biophysical and pharmacological aspects of K+ channels in T lymphocytes. Eur Biophys J. 2005;34:515–529.
- Balajthy A, Somodi S, Pethő Z, et al. 7DHC-induced changes of Kv1. 3 operation contributes to modified T cell function in Smith-Lemli-Opitz syndrome. Pflügers Archiv-European. Journal of Physiology. 2016;468:1403–1418.
- Schmid I, Krall WJ, Uittenbogaart CH, et al. Dead cell discrimination with 7‐amino‐actinomcin D in combination with dual color immunofluorescence in single laser flow cytometry. Cytometry J Int Soc Anal Cytol. 1992;13(2):204–208.
- Levy DI, Deutsch C. A voltage-dependent role for K+ in recovery from C-type inactivation. Biophys J. 1996;71(6):3157.
- Cahalan M, Chandy K, DeCoursey T, et al. A voltage‐gated potassium channel in human T lymphocytes. J Physiol. 1985;358(1):197–237.
- Lindau M, Neher E. Patch-clamp techniques for time-resolved capacitance measurements in single cells. Pflugers Arch. 1988;411(2):137–146.
- Panyi G, Varga Z, Gáspár R. Ion channels and lymphocyte activation. Immunol Lett. 2004;92(1–2):55–66.
- Taylor AL. What we talk about when we talk about capacitance measured with the voltage-clamp step method. J Comput Neurosci. 2012;32(1):167–175.
- Bagdáany M, Batista CV, Valdez-Cruz NA, et al. Anuroctoxin, a new scorpion toxin of the α-KTx 6 subfamily, is highly selective for Kv1. 3 over IKCa1 ion channels of human T lymphocytes. Mol Pharmacol. 2005;67(4):1034–1044.
- Massefski W, Redfield AG, Hare DR, et al. Molecular structure of charybdotoxin, a pore-directed inhibitor of potassium ion channels. Science. 1990;249(4968):521–524.
- Luna-Ramirez K, Csoti A, McArthur JR, et al. Structural basis of the potency and selectivity of Urotoxin, a potent Kv1 blocker from scorpion venom. Biochem Pharmacol. 2020;174:113782.
- Olamendi-Portugal T, Csoti A, Jimenez-Vargas J, et al. Pi5 and Pi6, two undescribed peptides from the venom of the scorpion Pandinus imperator and their effects on K+-channels. Toxicon. 2017;133:136–144.
- Kirsch G, Taglialatela M, Brown A. Internal and external TEA block in single cloned K+ channels. Am J Physiol Cell Physiol. 1991;261(4):C583–C90.
- Marom S, Levitan IB. State-dependent inactivation of the Kv3 potassium channel. Biophys J. 1994;67(2):579–589.
- Bartok A, Toth A, Somodi S, et al. Margatoxin is a non-selective inhibitor of human Kv1. 3 K+ channels. Toxicon. 2014;87:6–16.
- Varga Z, Gurrola-Briones G, Papp F, et al. Vm24, a natural immunosuppressive peptide, potently and selectively blocks Kv1. 3 potassium channels of human T cells. Mol Pharmacol. 2012;82(3):372–382.
- McIntyre CA, Flyg BT, Fong TC. Fluorescence-activated cell sorting for CGMP processing of therapeutic cells. BioProcess Int. 2010;8:44–53.
- Osborne GW. A method of quantifying cell sorting yield in “real time”. Cytometry Part A. 2010;77(10):983–989.
- Yan H, Ding C-g, Tian P-x, Ge G-q, Jin Z-k, Jia L-n, et al. Magnetic cell sorting and flow cytometry sorting methods for the isolation and function analysis of mouse CD4+ CD25+ Treg cells. J Zhejiang Univ Sci B. 2009;10(12):928.
- Resina-Pelfort O, Comas-Riu J, Vives-Rego J. Effects of deflected droplet electrostatic cell sorting on the viability and exoproteolytic activity of bacterial cultures and marine bacterioplankton. Syst Appl Microbiol. 2001;24(1):31–36.
- Di L, Srivastava S, Zhdanova O, et al. Inhibition of the K+ channel KCa3. 1 ameliorates T cell–mediated colitis. Proc Nat Acad Sci. 2010;107(4):1541–1546.
- Lam J, Wulff H. The lymphocyte potassium channels Kv1. 3 and KCa3. 1 as targets for immunosuppression. Drug Dev Res. 2011;72:573–584.
- Spencer RH, Sokolov Y, Li H, et al. Purification, visualization, and biophysical characterization of Kv1. 3 tetramers. J Biol Chem. 1997;272(4):2389–2395.
- Xu Y, Ramu Y, Lu Z. Removal of phospho-head groups of membrane lipids immobilizes voltage sensors of K+ channels. Nature. 2008;451(7180):826–829.
- Liin SI, Yazdi S, Ramentol R, et al. Mechanisms underlying the dual effect of polyunsaturated fatty acid analogs on Kv7. 1. Cell Rep. 2018;24(11):2908–2918.
- Somodi S, Varga Z, Hajdu P, et al. pH-dependent modulation of Kv1. 3 inactivation: role of His399. Am J Physiol Cell Physiol. 2004;287(4):C1067–C76.
- Corzo J. Time, the forgotten dimension of ligand binding teaching. Biochem Mol Biol Educ. 2006;34(6):413–416.
- Petho Z, Balajthy A, Bartok A, et al. The anti-proliferative effect of cation channel blockers in T lymphocytes depends on the strength of mitogenic stimulation. Immunol Lett. 2016;171:60–69.
- Veytia-Bucheli JI, Jiménez-Vargas JM, Melchy-Pérez EI, et al. K v 1.3 channel blockade with the Vm24 scorpion toxin attenuates the CD4+ effector memory T cell response to TCR stimulation. Cell Commun Signaling. 2018;16(1):45.