
ABSTRACT
Metabolic reprogramming is common in various cancers. Targeting metabolism to treat tumors is a hot research topic at present. Among them, changes in glucose metabolism in cancer have been widely studied. The Warburg effect maintains a high metabolic level in the tumor, accompanied by changes in glucose transporters. The transmembrane transport of sugar was previously thought to be mediated by SGLT and GLUT. Recently, the Solute Carrier Family(SLC) 45 family may be the third sugar transporter. But the role and value of the SLC45 family in melanoma, a highly malignant skin tumor, is unclear. Our study found that the four members of the SLC45 family, SLC45A1-SLC45A4, were differentially expressed in melanoma, but only SLC45A2 and SLC45A3 had prognostic guiding values. Further analysis revealed that the co-expression patterns of SLC45A2 and SLC45A3 were enriched in multiple metabolic pathways, suggesting their potential role in melanoma. In addition, SLC45A2 and SLC45A3 are also associated with immune cell infiltration. In conclusion, SLC45A2 and SLC45A3 are good prognostic indicators for melanoma and have guiding value for the treatment of melanoma in the future.
Introduction
Glucose metabolism is an important energy source for cells [Citation1]. It was previously believed that the transmembrane transport of sugar in human cells was in the form of monosaccharides, and disaccharides or polysaccharides could not be transported across the membrane [Citation2]. However, the newly discovered SLC45 family is thought to be a third sugar transporter (the first two being SGLT and GLUT) and thus plays a role in homeostasis regulation and cancer pathogenesis [Citation3]. However, the role of the SLC45 family in many cancers remains unclear.
There are four members of the SLC45 family, including SLC45A1, SLC45A2, SLC45A3, and SLC45A4. SLC45A1 is mainly expressed in the brain, especially on the ventral surface of the medulla oblongata [Citation4]. The expression of SLC45A1 is increased at low oxygen concentration or pH [Citation4]. It is speculated that it may be involved in glucose transport and H+ ion regulation [Citation4]. SLC45A2, mainly located in the melanosomes of melanocytes, is also known as membrane-associated transporter protein (MATP), and the deletion of this gene will lead to oculocutaneous albinism Type4 (OCA4), showing hypopigmentation of eyelid and skin [Citation5]. Similar to tyrosinase, SLC45A2 may be regulated by the cAMP signaling pathway [Citation5]. Because it is similar to the H+/ sucrose transporter in plants, the mechanism of its action may be to regulate the activity of tyrosinase through the transport of sucrose and H+, thus affecting the production of melanin [Citation6]. SLC45A3 was mainly found to be clearly expressed in prostate tissues, both in normal prostate tissues and in tumor tissues [Citation7]. Androgen stimulation leads to increased SLC45A3 expression [Citation8]. Recently, SLC45A3 was also found to be expressed in renal tubules, mediating the absorption of sucrose back into the renal tubules [Citation7]. Immunohistochemistry sections in Human Protein Atlas show that SLC45A3 is expressed in melanoma, but almost cannot be detected in normal skin. However, the expression and function of SLC45A3 in other parts are still unclear. Few studies have been conducted on SLC45A4. Recently, it has been revealed that SLC45A4 may be involved in sugar uptake and pH regulation in the epididymis, providing a strictly controlled acidic environment for sperm maturation [Citation3]. Even so, the study of the role of the SLC45 family in tumors is far from clear, and there is a lot of potentials to exploit it.
Melanoma, a malignant skin tumor, has an increasing morbidity and fatality rate [Citation9]. The discovery of immune checkpoint inhibitors has greatly improved the prognosis of patients with melanoma [Citation10]. However, as the number of cases treated by immune checkpoint inhibitors increases, drug resistance is also emerging, impeding the development of melanoma treatment [Citation11]. In this context, it is necessary to find some novel and effective biomarkers to promote the development of precision medicine.
In this present study, we performed a comprehensive database mining to explore the role of the SLC45 family in melanoma. The results can provide valuable prognostic biomarkers for melanoma and accelerate the treatment research of melanoma.
Methods
Alteration frequency analysis
Cbioportal is a powerful web tool that integrates high-throughput sequencing data from major databases such as TCGA, Oncomine, and GTEX [Citation12]. Users can conduct expression exploration, mutation analysis, and prognosis analysis in cBioPortal. In our study, we used Cbioportal to analyze the data in the TCGA database and study the frequency of gene changes in the SLC45 family in melanoma. We selected the database “TCGA pan-cancer” and used the “query by genes” function to study the gene changes of SLC45A1-SLC45A4 in various tumors.
Expression analysis of SLC45 family in melanomas and normal tissues
For the melanoma patients of The Cancer Genome Atlas (TCGA) database, tumoral RNA-seq data were downloaded from the Genomic Data Commons (GDC) data portal [Citation13].
All data of normal tissue samples were obtained from the GTEx V8 release version(https://gtexportal.org/home/datasets). A complete description of the donor genders, multiple ethnicity groups, wide age range, the biospecimen procurement methods, and sample fixation was described in GTEx official annotation.
Statistical analyses were performed using R software v4.0.3 (R Foundation for Statistical Computing, Vienna, Austria). A P-value of <0.05 was considered statistically significant.
A Prognostic value analysis of the SLC45 family
After analyzing the expression of the SLC45 family in melanoma, we further explored their prognostic values. Both overall and disease-free survival rates were included in the analysis using GEPIA database [Citation14], and images were downloaded.
The clinical correlation analysis of the SLC45 family in the form of the Sanguini Diagram
Raw counts of RNA-sequencing data (level 3) and corresponding clinical information from melanomas were obtained from The Cancer Genome Atlas (TCGA) dataset (https://portal.gdc.cancer.gov/) in May 2021, in which the method of acquisition and application complied with the guidelines and policies.
Sanguini diagram was built based on the R software package ggalluval. All the above analysis methods and R package were implemented by R foundation for statistical computing (2019) version 4.0.3. P < 0.05.
Co-expression pattern of SLC45 family members in melanoma
When studying the significance of genes, the analysis of their co-expression patterns is very important. As the previous results showed that only SLC45A2 and SLC45A3 had prognostic significance, the co-expression pattern analysis was carried out only in these two genes. We use the “correlation” function in UALCAN to get the top 100 genes that are co-expressed with SLC45A2 and SLC45A3, respectively, and output them in the form of the heat map [Citation15].
Gene Ontology (GO) and Kyoto Encyclopedia of Genes and Genomes (KEGG) enrichment analysis of co-expression genes
After the co-expressed genes were obtained, GO and KEGG enrichment analyses were performed to further investigate their functions. “Clusterprofiler” in R software was used to analyze the enrichment of co-expressed genes.
The construction of protein-protein interaction network of co-expressed genes
Studying the protein interactions of co-expressed genes can better study the role of the SLC45 family. We uploaded the co-expressed gene of SLC45A2 and SLC45A3 in the String database to get the interaction situation and visualized it with Cytoscape. At the same time, we also used the function of “cytohubba” to analyze the hub genes and calculate the MCC value of them, and then sort them according to the MCC value.
Immunocorrelation analysis of SLC45A2 and SLC45A3
The immune cell is one of the important components in the tumor microenvironment. Studying the infiltration of immune cells can promote the development of immunotherapy. TIMER is an open and user-friendly immunoassay database [Citation16]. We used Timer to conduct the immune correlation analysis of SLC45A2 and SLC45A3, and the immune cells studied were “B cells, CD8 + T cells, CD4 + T cells, macrophages, neutrophils, and dendritic cells”.
Results
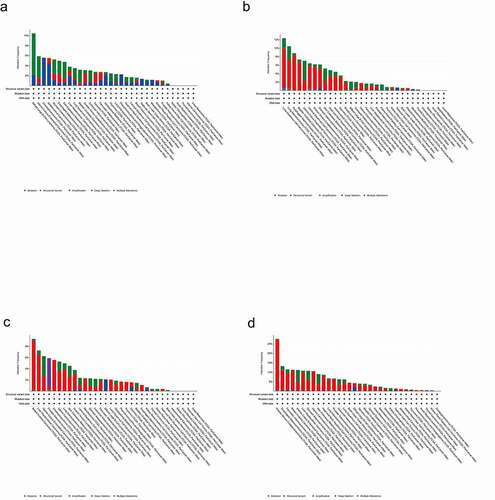
Alteration frequency of SLC45 gene family across cancers
As shown in , we can intuitively see the change frequency of the SLC45 gene family in various cancers. According to the variation frequency of SLC45 genes in different tumors, SLC45A1 was the 7th, SLC45A2 was the 9th, SLC45A3 was the 8th, and SLC45A4 was the 9th.
Figure 1. (a).Alteration frequency of SLC45A1 across cancers. (b).Alteration frequency of SLC45A2 across cancers. (c).Alteration frequency of SLC45A3 across cancers. (d).Alteration frequency of SLC45A4 across cancers
The expression of the SLC45 family in melanoma was statistically significant
As shown in , compared with normal tissues, four members of the SLC45 family were differentially expressed in the G1 group (primary melanoma) and the G2 group(metastatic melanoma).
Figure 2. (a-d). The 186 melanomas were divided into 167 G1 (primary) and 19 G2 (metastatic) groups. A total of 1809 normal skin samples were collected. Differential expression analysis was performed between the G1, G2, and normal groups. The results showed that compared with normal tissues, SLC45A1 was down-regulated in G1 and G2 groups, while SLC45A2, SLC45A3 and SLC45A4 were up-regulated in G1 and G2 groups, with statistical significance (P < 0.05). (e-h).Overall survival analysis of SLC45A1-A4 expression in melanoma (GEPIA): The high expression of SLC45A2 and SLC45A3 could significantly reduce the overall survival rate. (i-l).Disease-free survival analysis of SLC45A1-A4 expression in melanoma (GEPIA): The high expression of SLC45A2 and SLC45A3 could significantly reduce the disease-free survival rate
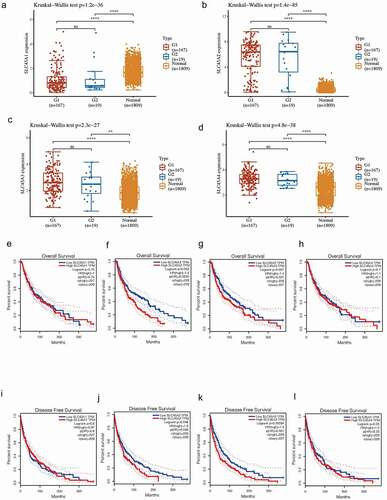
High expression of SLC45A2 and SLC45A3 is associated with poor prognosis in melanoma patients
Survival analysis () showed that the high expression of SLC45A2 and SLC45A3 could significantly reduce both the overall survival rate and disease-free survival rate in melanoma patients, while the high expression of SLC45A1 and SLC45A4 showed no statistical significance. Therefore, SLC45A2 and SLC45A3 are effective prognostic indicators for melanoma.
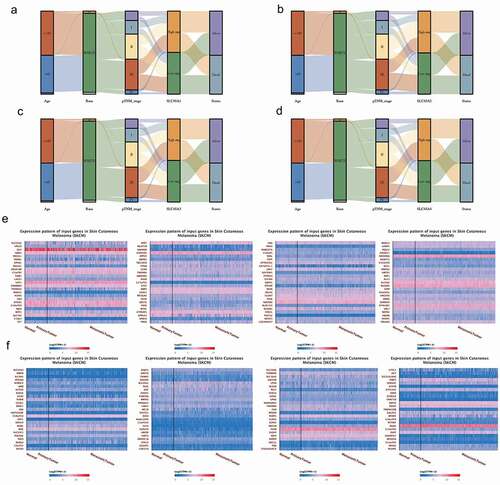
Clinical characteristic association of SLC45 family in melanoma
From the Sanguini diagram(3A-3D), we can see the relationship between the SLC45 family and the age, race, stage, and survival of melanoma patients. Each column represents a characteristic variable, different colors represent different types or stages, and lines represent the distribution of the same sample in different characteristic variables.
Co-expression patterns of SLC45A2 and SLC45A3 in melanoma
Since SLC45A2 and SLC45A3 are effective prognostic indicators for melanoma, we analyzed their co-expression patterns in-depth here. The first 100 co-expressed genes of SLC45A2 () and the first 100 co-expressed genes of SLC45A3() are shown in the form of heat maps.
Figure 3. (a-d). Clinical characteristic association of SLC45 family in melanoma:Each column represents a characteristic variable, different colors represent different types or stages, and lines represent the distribution of the same sample in different characteristic variables. (e). The heat map of the top 100 co-expressed genes with SLC45A2. (d). The heat map of the top 100 co-expressed genes with SLC45A3
Gene ontology (GO) enrichment analysis of co-expression genes
To investigate the function of co-expression patterns, we performed GO enrichment analysis, which was divided into three parts: biological process (BP), cellular component (CC), and biological function (MF). For SLC45A2 (), firstly in BP, its co-expression pattern is mainly concentrated in small molecule metabolism, organic acid metabolism, carboxylic acid metabolism, pH regulation, and protein-N-terminal glycosylation. Secondly, in CC, its co-expression pattern is mainly concentrated in the mitochondrial matrix, vacuole membrane, lysosomal membrane, melanosome, etc. Finally, in MF, its co-expression pattern is mainly enriched in NADPH oxidoreductase, proton pump ATPase activity, etc. For SLC45A3(), in BP, its co-expression patterns were mainly concentrated in organelle division, nuclear division, and mitosis. In CC, its co-expression pattern is mainly concentrated in the mitochondrial matrix, nuclear membrane, and mitochondrial protein complex. In MF, its co-expression mode is mainly enriched in isomerase activity, intramolecular transferase activity, and peptide disulfide oxidoreductase activity.
Figure 4. (a).GO enrichment analysis of co-expressed genes of SLC45A2. (b).GO enrichment analysis of co-expressed genes of SLC45A3. (c). KEGG enrichment analysis of co-expressed genes of SLC45A2. (d).KEGG enrichment analysis of co-expressed genes of SLC45A3
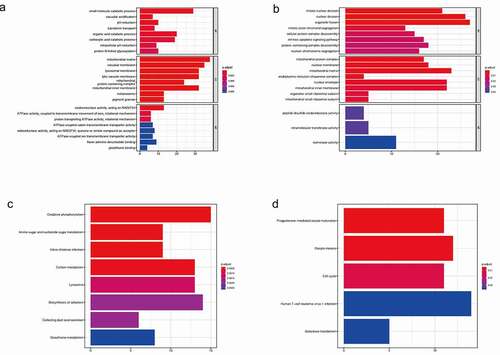
Kyoto encyclopedia of genes and genomes (KEGG) enrichment analysis of co-expression genes
To further investigate the signaling pathways of co-expressed genes, we performed the KEGG enrichment analysis. For SLC45A2(), The main enrichment pathways of the co-expression pattern are oxidative phosphorylation, amino sugar, and nucleotide sugar metabolism, carbon metabolism, biosynthesis of cofactors, and glutathione metabolism. For SLC45A3(), the main pathways of co-expression pattern are oocyte maturation, meiosis, cell cycle, and galactose metabolism.
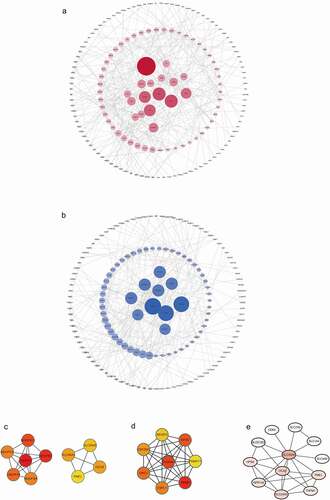
Protein-protein interaction networks of the co-expression patterns of SLC45A2 and SLC45A3
Various proteins in the co-expression pattern interact with each other, forming a protein interaction network. In order to study the HUB genes in the co-expression mode, we constructed the protein-protein interaction network of SLC45A2 () and SLC45A3 () and sorted the top 10 proteins according to the MCC score to study their modes of action (). Moreover, the proteins most closely associated with SLC45A2 were also mined and visualized().
Figure 5. (a).Protein-protein interaction (PPI) network for co-expressing genes of SLC45A2. (b).Protein-protein interaction (PPI) network for co-expressing genes of SLC45A2. (c). The top 10 proteins in the PPI network of SLC45A2 according to the MCC score. (d). The top 10 proteins in the PPI network of SLC45A2 according to the MCC score. (e). The proteins which are most closely associated with SLC45A2
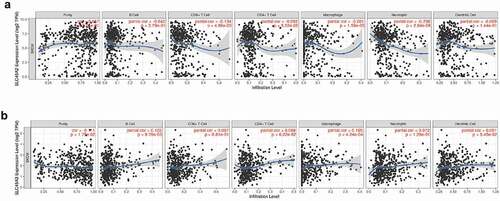
Immue infiltration linked to SLC45A2 and SLC45A3 in melanoma
The study of the association of genes with immune infiltraion can guide the formulation of immunotherapy. The expression of SLC45A2 was significantly correlated with the infiltration of CD8 + T cells(p = 4.86e-03), macrophages(p = 1.59e-05), and neutrophils(p = 2.64e-08) in melanoma(). The expression of SLC45A3 was significantly correlated with the infiltration of B cells(p = 9.79e-03), macrophages(p = 4.24e-04) in melanoma().
Figure 6. Immue infiltration linked to SLC45A2 and SLC45A3 in melanoma (TIMER): (a). The expression of SLC45A2 was significantly correlated with the infiltration of CD8 + T cells(p = 4.86e-03), macrophages(p = 1.59e-05), and neutrophils(p = 2.64e-08) in melanoma. (b).The expression of SLC45A3 was significantly correlated with the infiltration of B cells(p = 9.79e-03), macrophages(p = 4.24e-04) in melanoma
Discussion
Hypermetabolism of tumor cells is one of its most remarkable features [Citation17]. Tumors regulate a number of biological processes that increase metabolic rates and their ability to adapt to the unpredictable environment [Citation18]. The Warburg effect of cancer is well known [Citation19]. The Warburg effect increases a tumor’s metabolic rate, and some of the substances it produces, such as lactic acid, play important roles in the tumor microenvironment [Citation19]. Therefore, the metabolic pathway of the tumor may be its Achilles’ heel, and the study of tumor metabolism can promote the development of tumor therapy [Citation20].
Solute Carrier Transporter is a type of protein that is located mainly on the cell membrane and mediates the transport of many substances across the membrane [Citation8]. It was previously believed that the transmembrane transport of sugar was mainly mediated by SLC2 and SLC5 [Citation21]. SLC2 mainly mediates the passive transport of glucose and SLC5 mainly mediates the secondary active transport of glucose [Citation21]. However, in recent years, a new class of SLC transporters, the SLC45 family, has been considered as a possible third sugar transporter [Citation3]. There are four members of the SLC45 family in mammals: SLC45A1-SLC45A4. Because they are highly similar to sucrose transporters in plants, it has been speculated by many scholars that they may also participate in sugar transport in humans [Citation3]. At present, there has been no systematic study on the SLC45 family in tumors. So we analyzed the clinical significance of the SLC45 family in melanoma through data mining.
In this study, firstly, we analyzed the frequency of gene changes in the SLC45 family in a variety of cancers. Then, we set the tumor as melanoma to study the expression of SLC45A1-SLC45A4 in melanoma. The results showed that SLC45A1-SLC45A4 were differentially expressed in G1 (primary) or G2 (metastatic) melanoma compared with normal skin tissue. Further survival analysis of SLC45 family showed that the high expression of SLC45A2 and SLC45A3 could significantly reduce the overall survival rate and disease-free survival rate of melanoma patients. Therefore, SLC45A2 and SLC45A3 are good prognostic indicators for melanoma. The relationship between the expression of the SLC45 family and clinical features can be seen in the Sankey diagram. The co-expression patterns of SLC45A2 and SLC45A3 were further analyzed. The GO enrichment analysis shows that the co-expression pattern of SLC45A2 is mainly shown as the small molecule catabolic process, organic acid catabolic process, in biological process (BP); In terms of cell components (CC), the co-expression pattern of SLC45A2 was mainly concentrated in mitochondrial matrix, mitochondrial intima and other components. In terms of molecular function(MF), the co-expression pattern of SLC45A2 was mainly concentrated in REDOX enzyme activity and ATPase activity. For SLC45A3, in BP, its co-expression patterns were mainly concentrated in fission, mitosis, mitosis and other organelles. In CC, the co-expression pattern of SLC45A3 was mainly concentrated in mitochondrial matrix, mitochondrial intima, and other components. In MF, the co-expression pattern of SLC45A3 was mainly enriched in isomerase activity, intramolecular invertase activity and other functions. KEGG enrichment analysis showed that SLC45A2 was related to oxidative phosphorylation, carbon metabolism, amino sugar, and nucleotide sugar metabolism. And SLC45A3 is associated with oocyte meiosis, cell cycle, and galactose metabolism pathways.
Our study identified two good prognostic markers for melanoma, namely SLC45A2 and SLC45A3, which are of significance for the prognostic guidance of melanoma. Patients with high expression of SLC45A2 or SLC45A3 may indicate a poor prognosis and should therefore be treated more aggressively. The analysis of their co-expression networks can provide targeted solutions. It is not difficult to see that the co-expression pattern of SLC45A2 and SLC45A3 is related to hypermetabolism and cell replication, which also indicates that they may be a novel sugar transporter to mediate the energy metabolism of tumors.
Metabolic reprogramming of cancer has long been an effective therapeutic target [Citation22]. Nucleotide metabolism, sugar metabolism, and amino acid metabolism have all been reprogrammed in cancer [Citation23]. Treatments targeting these metabolic pathways have also yielded good results, although there have been some side effects [Citation23]. Metaminoprene and 6-mercaptopurine have been widely used in clinics for nucleotide metabolism. 2-deoxyglucose (2-DG) has also been widely studied in the treatment of cancer by inhibiting glucose metabolism [Citation24]. Our study found that the co-expression pattern of SLC45A2 and SLC45A3 tended to be hypermetabolic, which also provided a reference for future anti-metabolic therapy of melanoma.
Similarly, the relationship between SLC45A2 and SLC45A3 and immune infiltration also provides a reference for future immunotherapy [Citation25]. It is well known that melanoma is a tumor that is highly involved in the immune system, and immune checkpoint inhibitors have also shown good results in treating melanoma [Citation26]. The correlation between SLC45A2 and CD8 T cells, macrophages, and neutrophils, as well as the correlation between SLC45A3 and B cells and macrophages, all provide some ideas for the immunotherapy of melanoma.
There are some limitations to our study. We lack clinical validation to support the results of this study, which we will improve on in future studies.
Conclusion
As a group of potential novel sugar transporters, SLC45 family has a great prospect in tumor research. We identified two of the members that have prognostic significance in melanoma: SLC45A2 and SLC45A3. Further analysis revealed that their co-expression pattern was associated with some metabolic pathways. In addition, SLC45A2 and SLC45A3 were associated with immune cell infiltration. Thus, SLC45A2 and SLC45A3 have research and therapeutic value in melanoma.
Acknowledgments
We are very grateful for data provided by databases such as TCGA, GEO, GEPIA.
Disclosure statement
No potential conflict of interest was reported by the authors.
Additional information
Funding
References
- Bc M, Yongky A, Le T, et al. Regulation of glucose metabolism - A perspective from cell bioprocessing. Trends Biotechnol. 2016;34(8):638–651.
- LQ C, Cheung LS, Feng L, et al. Transport of sugars. Annu Rev Biochem. 2015;84:865–894.
- Vitavska O, Wieczorek H. Putative role of an SLC45 H+/sugar cotransporter in mammalian spermatozoa. Pflugers Arch. 2017;469(11):1433–1442.
- Srour M, Shimokawa N, Hamdan FF, et al. Dysfunction of the cerebral glucose transporter SLC45A1 in individuals with intellectual disability and epilepsy. Am J Hum Genet. 2017;100(5):824–830. .
- Le L, Escobar IE, Ho T, et al. SLC45A2 protein stability and regulation of melanosome pH determine melanocyte pigmentation. Mol Biol Cell. 2020;31(24):2687–2702. .
- Lin Y, Chen X, Yang Y, et al. Mutational analysis of TYR, OCA2, and SLC45A2 genes in chinese families with oculocutaneous albinism. Mol Genet Genomic Med. 2019;7(7):e00687. .
- Kumar-Sinha C, Kalyana-Sundaram S, Chinnaiyan AM. SLC45A3-ELK4 chimera in prostate cancer: spotlight on cis-splicing. Cancer Discov. 2012;2(7):582–585.
- Bai X, Moraes TF, Reithmeier RAF. Structural biology of solute carrier (SLC) membrane transport proteins. Mol Membr Biol. 2017;34(1–2):1–32.
- Rastrelli M, Tropea S, Rossi CR, et al. Melanoma: epidemiology, risk factors, pathogenesis, diagnosis and classification. Vivo. 2014;28(6):1005–1011.
- Madden K, Kasler MK. Immune Checkpoint Inhibitors in Lung Cancer and Melanoma. Semin Oncol Nurs. 2019;35(5):150932.
- Queirolo P, Boutros A, Tanda E, et al. Immune-checkpoint inhibitors for the treatment of metastatic melanoma: a model of cancer immunotherapy. Semin Cancer Biol. 2019;59:290–297.
- Gao J, Aksoy BA, Dogrusoz U, et al. Integrative analysis of complex cancer genomics and clinical profiles using the cBioPortal. Sci Signal. 2013;6(269): pl1. .
- Tomczak K, Czerwińska P, Wiznerowicz M. The Cancer Genome Atlas (TCGA): an immeasurable source of knowledge. Contemp Oncol (Pozn). 2015;19(1A):A68–A77.
- Tang Z, Li C, Kang B, et al. GEPIA: a web server for cancer and normal gene expression profiling and interactive analyses. Nucleic Acids Res. 2017;45(W1):W98–W102.
- DS C, Bashel B, Balasubramanya SAH, et al. UALCAN: a Portal for Facilitating Tumor Subgroup Gene Expression and Survival Analyses. Neoplasia. 2017;19(8):649–658. .
- Li T, Fan J, Wang B, et al. TIMER: a web server for comprehensive analysis of tumor-infiltrating immune cells. Cancer Res. 2017;77(21):e108–e110. .
- Reina-Campos M, Moscat J, Diaz-Meco M. Metabolism shapes the tumor microenvironment. Curr Opin Cell Biol. 2017;48:47–53.
- DeBerardinis RJ, Chandel NS. Fundamentals of cancer metabolism.Sci Adv. 2016 [Published 2016 May 27];2(5):e1600200. .
- Liberti MV, Locasale JW. The Warburg effect: how does it benefit cancer cells? [published correction appears in Trends Biochem Sci. 2016 Mar; 41(3):287][published correction appears in Trends Biochem Sci. 2016 Mar;41(3):287]. Trends Biochem Sci. 2016;41(3):211–218.
- Pascale RM, Calvisi DF, Simile MM, et al. The Warburg Effect 97 Years after Its Discovery.Cancers (Basel). 2020 [Published 2020 Sep 30];12(10):2819. .
- Schneebauer G, Mauracher D, Fiechtner B, et al. Transcript levels of members of the SLC2 and SLC5 families of glucose transport proteins in eel swimbladder tissue: the influence of silvering and the influence of a nematode infection. Fish Physiol Biochem. 2018;44(2):599–613.
- Biswas SK. Metabolic Reprogramming of Immune Cells in Cancer Progression. Immunity. 2015;43(3):435–449.
- Sciacovelli M, Frezza C. Metabolic reprogramming and epithelial-to-mesenchymal transition in cancer. FEBS J. 2017;284(19):3132–3144.
- Luengo A, Gui DY, Vander Heiden MG. Targeting metabolism for cancer therapy. Cell Chem Biol. 2017;24(9):1161–1180.
- Marzagalli M, Ebelt ND, Manuel ER. Unraveling the crosstalk between melanoma and immune cells in the tumor microenvironment. Semin Cancer Biol. 2019;59:236–250.
- Leven C, Padelli M, Carré JL, et al. Immune checkpoint inhibitors in melanoma: a review of pharmacokinetics and exposure-response relationships. Clin Pharmacokinet. 2019;58(11):1393–1405.