
ABSTRACT
Most of Solute carrier family-2 (SLC2) members play a key role of facilitative transporters, and glucose transporter (GLUT) proteins encoded by SLC2s can transport hexoses or polyols. However, the function and mechanism of SLC2s remain unclear in human cancers. Here, we explored the dysregulated expression, prognostic values, epigenetic, genetic alterations, and biomolecular network of SLC2s in human cancers. According to the data from public-omicsrepository, SLC2A4 (GLUT4) was found to be significantly downregulated in most cancers, and higher messenger RNA (mRNA) expression of SLC2A4 significantly associated with better prognosis of breast cancer (BRCA) patients. Moreover, DNA hypermethylation in the promoter of SLC2A4 may affect the regulation of its mRNA expression, and SLC2A4 was strongly correlated with pathways, including the translocation of SLC2A4 to the plasma membrane and PID INSULIN PATHWAY. In conclusion, these results provide insight into SLC2s in human cancers and suggest that SLC2A4 could be an unfavorable prognostic biomarker for the survival of BRCA patients.
Introduction
Saccharides are essential energy sources and carbon sources for human body, which can participate in the formation of various organizational structures. Rapid proliferation, invasion, and other behaviors determine that cancer has a great demand for saccharides. Following Warburg effect, many cancer cells uptake a large number of glucose and regulate their energy source from mitochondrial oxidative phosphorylation to a glucose-dependentglycolytic pathway for maintaining proliferation. [Citation1,Citation2] Solute carrier family-2 (SLC2) can encode glucose transporter (GLUT) protein, which was the memberof MFS (Major Facilitator Superfamily)superfamily, and it is now clear that 14 SLC2 members are SLC2A1, SLC2A2, SLC2A3, SLC2A4, SLC2A5, SLC2A6, SLC2A7, SLC2A8, SLC2A9, SLC2A10, SLC2A11, SLC2A12, SLC2A13, andSLC2A14, which separately encodesGLUT1, GLUT2, GLUT3, GLUT4, GLUT5, GLUT6, GLUT7, GLUT8, GLUT9, GLUT10, GLUT11, GLUT12, HMIT, and GLUT14[Citation3,Citation4]. All GLUTs seemed to transport hexoses or polyols when ectopically expressed[Citation5]. The 14 GLUT proteins are comprised of 500 amino acid residues and can be categorized into three classes based on sequence similarity: Class 1 (GLUTs 1–4 and 14); Class 2 (GLUTs 5, 7, 9, and 11); and Class 3 (GLUTs 6, 8, 10, 12, and HMIT) [Citation6]. To date, GLUT1-5 had been researched most extensively and deeply [Citation5].
Several studies have found aberrant expressions and unique mechanisms in some members of GLUTs family. For example, GLUT1 overexpression promoted the glycolysis process in many human cancers, such as gastric adenocarcinoma and breast cancer carcinoma and adenocarcinoma [Citation7]. Besides, GLUT1 expression was regulated by long non-codingRNA HOX transcript antisense RNA and microRNA miR-150 [Citation8,Citation9]. GLUT2 transporters showed the activity in hepatocellular carcinoma cell, and the knockdown of GLUT2 can induce the apoptosis in HepG2 cells [Citation10]. Moreover, GLUT3 may play an important role in proliferation and apoptosis in human cancers [Citation11]. GLUT4 was found to be correlated with 18 F-flurodeoxyglucose uptake in gastrointestinal stromal tumor [Citation12]. Furthermore, GLUT5 can act as fructose transporter in vivo in human breast cancer [Citation13]. However, the prognostic significance and molecular mechanisms of SLC2s remain unclear.
Nowadays, with the development of high throughput technologies, as well as public attention to cancer genomes, researchers can use The Cancer Genome Atlas (TCGA) to explore the molecular mechanisms and genomic changes of a variety of human tumors. Thus, cancer prevention, diagnosis, and precision therapy were greatly speeded up. In this study, we analyzed the messenger RNA (mRNA) expression, gene mutation, and methylation modification of SLC2s in human cancers based on TCGA datasets and discussed their prognostic value and gene regulatory network in breast cancer.
Materials and method
SLC2s-mRNA expression analysis
The oncomine (www.oncomine.org) database was used to analyze the expression of SLC2s-mRNA between different cancer tissues [Citation14]. The cut-off of p-value and fold change were as follows: p-value: 0.01, fold change: 1.5, gene rank: 10%. In addition, UALCAN (http://ualcan.path.uab.edu) is an interactive web resource to perform in-depth analyses of gene expression between tumor and normal samples based on individual clinicopathologic features from the TCGA data. The mRNA expression of SLC2s in different cancer subtypes and grades/stages was also analyzed by UALCAN[Citation15].
Kaplan–Meier survival analysis
The relevance between the SLC2s’ expression and prognosis was analyzed by Kaplan–Meier plotter (http://kmplot.com/analysis)[Citation16]. “Overall survival (OS),” “auto-select best cut-off,” and “only JetSet best probe set” was chosen for calculating and draw Kaplan–Meier survival curve. Best cut-off values were calculated by all possible cut-off values between the lower and upper quartiles, and the best generated execution threshold was used as a cut-off (Supplementary Table 1). Statistical significance was determined by log-rank p-value, and hazard ratios (HRs) with 95% CIs are displayed. The Affymetrix probeset IDs of SLC2 family members in breast cancer, lung cancer, and stomach cancer are as follows: SLC2A1: 201249_at; SLC2A2: 206535_at; SLC2A3: 202499_s_at; SLC2A4: 206603_at; SLC2A5: 204430_s_at; SLC2A6: 220091_at; SLC2A8: 218985_at; SLC2A9: 219991_at; SLC2A10: 221024_s_at; SLC2A11: 232167_at; SLC2A12: 244353_s_at; SLC2A13: 227176_at; and SLC2A14: 216236_s_at. The Affymetrix probeset ID of SLC2A7 was not found in KM plotter. Furthermore, GSE62254 dataset was excluded when KM plots were generated for SLC2s in stomach cancer because of GSE62254 having markedly different characteristics (longer survivals, shifted expression) than the other datasets.
Mutations and copy-numberalterations analysis
cBioPortal (www.cbioportal.org) is an online open access website resource that can be used to interactively explore multidimensional cancer genomics datasets [Citation17]. Gene mutations and copy number alternation of SLC2A4 was analyzed from Invasive Breast Cancer (TCGA, firehorse legacy, 1101 patients/1108 samples) in cBioPortal.
Methylation modification analysis
MEXPRESS (https://mexpress.be) was used to analyze the correlation between DNA methylation and SLC2A4 mRNA expression in 1268 breast invasive carcinoma samples [Citation18]. Besides, MethHC (http://MethHC.mbc.nctu.edu.tw) was used to study the relationship of DNA methylation in the promoter and SLC2A4-mRNA expression for 839 breast invasive carcinoma samples [Citation19].
Gene regulatory networks analysis
The Search Tool for the Retrieval of Interacting Genes/Proteins (STRING,https://www.string-db.org) was used to construct the interaction network of SLC2A4 with a confidence score of 0.4 [Citation20]. Additionally, Metascape (https://metascape.org) was chosen for gene ontology and pathway enrichment analysis of the genes related to SLC2A4[Citation21].
Results
SLC2s-mRNA expression in breast cancer
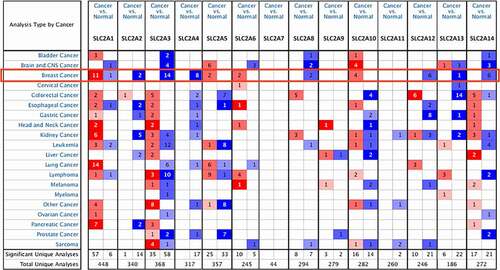
Using the Oncomine database, the mRNA expression of SLC2s in 20 cancer types was analyzed (). Results revealed that SLC2A1, 3, 4, 5, 6, 10, 13 and 14 were abnormally expressed in most cancer types. Among them SLC2A1, 3, 4 and 14 has the most data available in breast cancer. Compared with normal tissues, SLC2A3, 4 and 14 were significantly downregulated in breast cancer. In the Curtis dataset, SLC2A3 mRNA expression was observed 2.665-fold decrease in invasive lobular breast carcinoma samples, while SLC2A4 downregulation was found in invasive breast carcinoma samples with a fold change of 5.226 from TCGA Breast dataset[Citation22]. TCGA Breast datasets also showed 2.617-fold decrease of SLC2A14 mRNA expression in mucinous breast carcinoma samples. Concurrently, SLC2A1 was significantly up-regulatedin breast cancer. In Zhao Breast dataset, SLC2A1 was overexpressed in invasive ductal breast carcinoma compared with normal tissues with a fold change of 2.800[Citation23]. However, in Finak’s datasets, SLC2A1 was significantly down-regulated in invasive breast carcinoma stroma sample with a 3.780-fold change[Citation24].
Figure 1. The mRNA levels of SLC2s in different cancer types (ONCOMINE database)
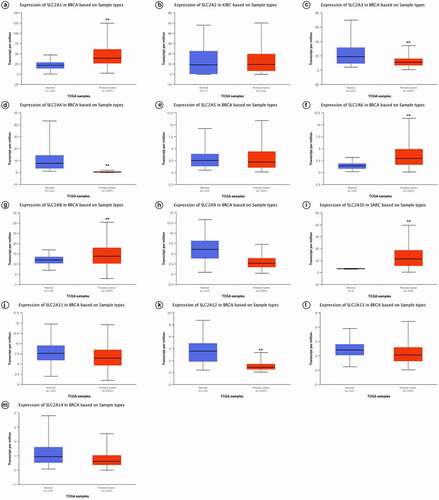
UALCAN was further used to investigate the expression of SLC2s in breast cancer. As shown in and , SLC2A1, 3, 4, 6, 8, 9, 10 and 12 were significantly dysregulated in breast cancer (p <0.01). We found that SLC2A1 (p <1.00E-12), SLC2A6 (p <1.00E-12), SLC2A8 (p =1.62E-12) and SLC2A10 (p =1.62E-12) were significantly up-regulated 1.80-fold, 2.10-fold, 1.15-fold and 1.85-fold, respectively. SLC2A3 (p =3.01E-07), SLC2A4 (p =1.04E-11), SLC2A9 (p =4.44E-16) and SLC2A12 (p =1.62E-12) were also found to be significantly downregulated 1.71-fold, 20.91-fold, 2.28-fold and 4.07-fold, respectively.
Table 1. Significant changes of SLC2s expression in transcript level compared BRCA tissues with normal tissues. P<0.05 was treated as significant
Figure 2. Box-whisker plots showing the mRNA levels of SLC2s in breast invasive carcinoma samples based on major cancer stages from the UALCAN database
Prognostic value of SLC2s expression in breast cancer patients
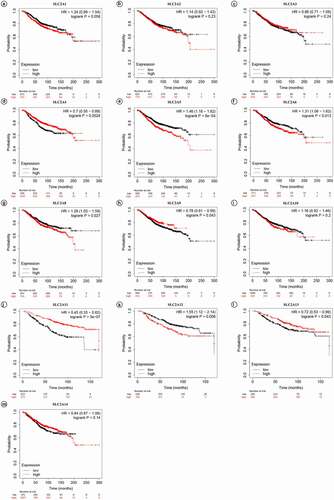
Next, KM plotter was used to investigate the prognostic values of the mRNA expression of SLC2s in breast cancer patients ( and ). Results showed that higher mRNA expression of SLC2A4 and SLC2A11 significantly associated with better prognosis of breast cancer patients (HR: 0.7 [0.55–0.88];p =0.0024 and HR: 0.45 [0.33–0.62];p =5E-07, respectively). Moreover, higher mRNA expression of SLC2A5 and SLC2A12 significantly associated with worse prognosis of breast cancer patients (HR: 1.46 [1.18–1.82];p = 6E-04 and HR: 1.55 [1.12–2.14];p = 0.008, respectively). Additionally, there is a certain interaction between abnormal mRNA expression of SLC2A6, SLC2A8, SLC2A9 and prognosis in breast cancer (HR: 1.13 [1.06–1.62];p = 0.013, HR: 1.28 [1.03–1.59];p = 0.027 and HR: 0.78 [0.61–0.99];p = 0.043, respectively). In summary, the results indicated that SLC2A4 may be exploited as the most useful biomarkers of SLC2s for prediction of breast cancer patients’ survival.
Table 2. SLC2 family members with significant prognostic values in breast cancer patients
Figure 3. Prognostic values of SLC2s for OS in all breast cancer patients (1402 invasive carcinoma patients).p-values were calculated by log-ranktest. HRs with 95% confidence intervals (CIs) are displayed. (a)SLC2A1; (b)SLC2A2; (c)SLC2A3; (d)SLC2A4; (e)SLC2A5; (f)SLC2A6; (g)SLC2A8; (h)SLC2A9; (i)SLC2A10; (j)SLC2A11; (k)SLC2A12; (l)SLC2A13; (m)SLC2A14.
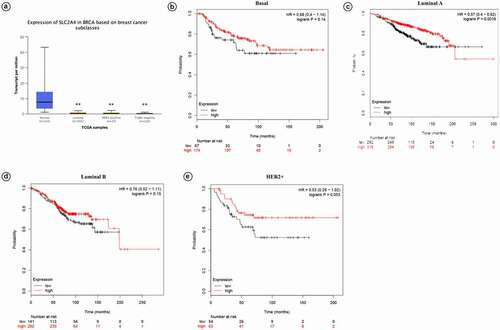
Expression of SLC2A4-mRNA in different major subclasses of TCGA breast cancer samples are shown as . Compared with normal tissues, SLC2A4 were significantly reduced in luminal, HER2 positive and triple negative breast cancers (p = 1.19E-11;p = 2.43E-11;p = 6.70E-12, respectively). Meanwhile, KM plotter was used to access prognostic values of SLC2A4 in different intrinsic subtypes. Results showed that SLC2A4 high expression is associated with better prognosis in 4 intrinsic subtypes (Basal; HR = 0.68 [0.4 − 1.14];p = 0.14; Luminal A; HR = 0.57 [0.4 − 0.82];p = 0.0018; Luminal B; HR = 0.76 [0.52 − 1.11];p = 0.15; HER2+; HR = 0.53 [0.28 − 0.1.02];p = 0.053).
Figure 4. Prognostic values of SLC2A4 in breast cancer patients with different intrinsic subtypes
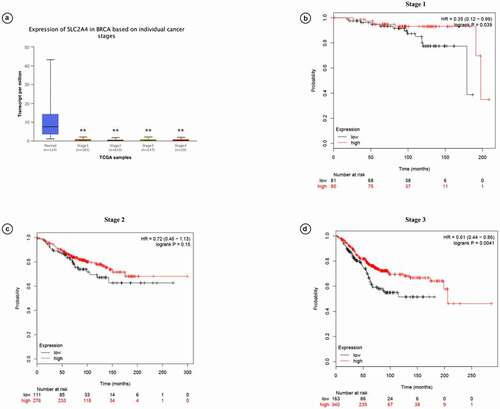
Prognostic values of SLC2A4 in breast cancer patients with different cancer stages were also investigated by using UALCAN (). We found that mRNA expression of SLC2A4 was significantly downregulated in all individual cancer stages (p < 0.01). KM plotter analysis further demonstrated that high expression of SLC2A4 is related with better prognosis in grade I and III (HR = 0.35 [0.12 − 0.99];p = 0.039; HR = 0.61 [0.44 − 0.86];p = 0.0041). However, there was no significant correlation between mRNA expression of SLC2A4 and prognosis in grade II (HR = 0.72 [0.46 − 0.1.13];p = 0.15). Overall, this result showed that SLC2A4 is a potential prognostic biomarker for breast cancer patients.
Figure 5. Prognostic values of SLC2A4 in breast cancer patients with different cancer grades
Relationship between DNA hypermethylation in the promoter of SLC2A4 and SLC2A4-mRNA expression in breast cancer
We use MEXPRESS to assess whether DNA hypermethylation in the promoter of SLC2A4 was related to mRNA expression of SLC2A4. As shown in , according to the Pearson correlation coefficient, mRNA expression of SLC2A4 was positively correlated with its DNA methylation in the promoter (probe ID: cg07287120, r = 0.122; probe ID: cg03670302, r = 0.093; all p < 0.01) and can be negatively correlated with its DNA methylation in the promoter (probe ID: cg17663577, r = −0.104; probe ID: cg21994579, r = −0.222; probe ID: cg06891043, r = −0.113; probe ID: cg27067158,r = −0.391; all p < 0.01). The expression level of SLC2A4 in breast cancer tissues was lower than that in normal samples. Besides, DNA methylation in SLC2A4 promoter region was significantly related to histological type, sample type, and subtype (p = 2.087E-6,p = 1.692E-129 andp = 0.003, respectively). We further compared DNA hypermethylation in the promoter of SLC2A4 in breast cancer patients to normal samples; data from MethHC showed that there were significant differences between the two groups (p < 0.05). All in all, these results demonstrated that DNA hypermethylation in the promoter of SLC2A4 can affect the regulation of its mRNA expression.
Figure 6. Impact of epigenetic and genetic alterations on SLC2A4-mRNA expression in breast cancer
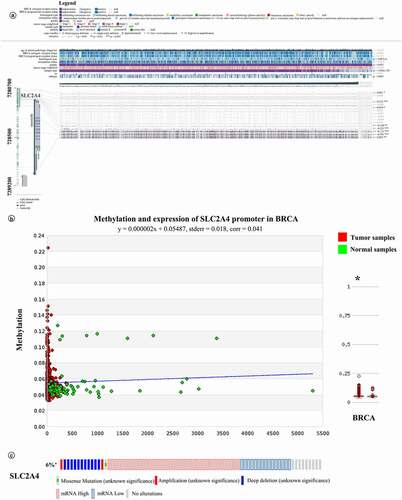
To explore the relationship between low mRNA expression of SLC2A4 and genetic alterations, we used cBioPortal to analyze the mutations, copy-number alterations, and mRNA expression transformations of SLC2A4. As shown in , 6% (68) of 1108 breast invasive carcinoma samples have alternations (p < 0.05). Among them, 1 sample was missense mutation (unknown significance), 1 sample was amplification (unknown significance), 11 samples were deep deletion (unknown significance), 15 samples were mRNA low, and 39 samples were mRNA high. Interestingly, 1 sample was both amplification and mRNA high. These outcomes indicated that alternations of SLC2A4 were most mutually independent.
Biomolecular network regulated by SLC2A4
We further searched potential regulated genes to seek the regulation function of SLC2A4 in tumorigenesis and tumor progression. As shown in and Supplementary Table 2, we found 35 genes were closely related to SLC2A4 from functional interaction network analysis using STRING, including PPARGC1A, PPARG, CEBPA, ACAP1, AKT1, PRKCZ, IRS1, CLTC, and ARF6,
Figure 7. SLC2A4-regulated biomolecular network
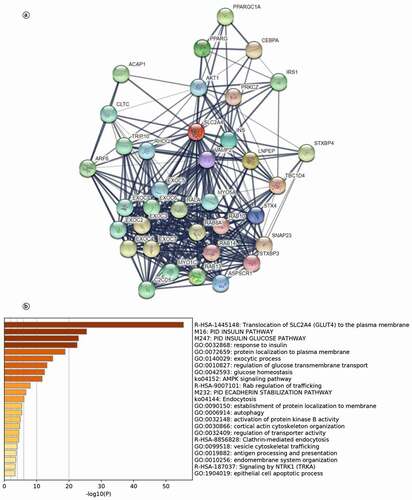
TRIP10, RHOQ, VAMP2, INS, LNPEP, TBC1D4, STXBP4, EXOC2, EXOC3, EXOC4, EXOC5, EXOC6, EXOC7, EXOC8, C2CD5, MYO1C, RAB13, ASPSCR1, STXBP3, SNAP23, STX4, MYO5A, RALA, RAB8A, RAB14, and RAB10. Next, gene ontology and pathway enrichment analysis for these 35 genes were performed in Metascape. As shown in , 20 gene sets were significantly enriched. The most significantly enriched five gene sets were translocation of SLC2A4 (GLUT4) to the plasma membrane and protein localization to plasma membrane. These results demonstrated that SLC2A4 was related with cellular material transportation and insulin in breast cancer. In addition, SLC2A4 may play an important role in breast cancer, including AMPK pathway, glucose homeostasis, and protein localization.
Discussion
In this study, we systematically explore the mRNA expression, prognostic value, epigenetic and genetic alterations, and gene regulatory network of SLC2A4 in human cancers. Results from our study showed that the mRNA expression of SLC2A4 was significantly decreased in BRCA tissues, and high level of SLC2A4-mRNA was significantly relevant to better prognosis in breast cancer patients. Compared with normal tissues, SLC2A4 was significantly downregulated in patients with all subtypes and stages of BRCA, and high level of SCL2A4 in luminal A breast cancer and stage III breast cancer can significantly predict better prognosis. Additionally, SLC2A4 can also abnormally express in other types of cancers. According to the latest cancer epidemic trend from China National Cancer Center, we also investigated the relevance between the expression and prognosis of SLC2A4 in lung cancer, liver cancer, and stomach cancer [Citation25]. Results are shown in Supplementary Table 3. It suggested that SLC2A4 can be a common prognostic biomarker in specific stages of multiple cancers. The latest progress in tumor epigenetics shows that DNA methylation, histone modification, and non-codingRNA play an important role in regulating gene expression and chromatin structure, which may lead to the occurrence and development of cancer [Citation26]. In addition, the increase of DNA copy number will also lead to the increase of gene mRNA expression. Above results indicated that SLC2A4 may be an important biomarker to promote the development of accurate diagnosis and prognosis.
As one of the sugar transporter proteins in human genome, GLUT4 regulates glucose transport and is encoded by SLC2A4[Citation27,Citation28].GLUT4 plays an essential role in maintaining body glucose homeostasis and is regulated by insulin. GLUT4 expression was downregulated in adipocytes in obesity and was upregulated in adipocytes and muscle cells in response to exercise [Citation29]. GLUT4 was expressed differently among normal humans and those with obesity and diabetes, and the overexpression of GLUT4 in skeletal muscle can alter substrate utilization and improve the benefits of insulin [Citation30,Citation31]. Besides, three studies have shown that GLUT4 may play a potential role in tumorigenesis and progression [Citation32–34]. GLUT4 downregulation may inhibit glucose uptake and induce metabolic reprogramming; research also found that GLUT4 downregulation can suppress cell proliferation and critically decrease cell viability under hypoxic conditions, especially in MCF7 and MDA-MB-231 breast cancer cells [Citation33]. Besides, 7 antimicrobial peptides (RAB1-7) became anti-cancerdrugs by inhibiting SLC2A4 to impair the energy gained by cancer cells during angiogenesis [Citation32]. Another study demonstrated that high glucose increased SLC2A4 and VEGF/VEGFR expression by upregulating estrogen receptor and further promoted epithelial–mesenchymal transition process and accelerated the development of uterus endometrial cancer [Citation34]. Moreover, by targeting GLUT4, the silence of krüppel-like transcription factor 8 (KLF8) expression decreased the glycolysis rate of gastric cancer cells in vitro[Citation35]. However, the physiological and pathophysiological mechanisms of GLUT4 protein are still unclear. Multiple studies revealed that GLUT4 was associated with the regulation adipogenesis and blood glucose regulation [Citation36–40]. Interestingly, exercise may be a key role of affecting the translocation and expression of GLUT4; exercise can activate AMPK, PPAR β positive feedback loop and PGC-1 α, and further upregulate GLUT4 expression to enhance glucose uptake by tissue cells [Citation41–43]. Some extracts from plants, including quercetin and Moringa concanensis nimmo extracts, can upregulate the expression of GLUT4[Citation44,Citation45].
We performed functional enrichment analysis of 35 SLC2A4-related genes and discovered some important pathways that may play a key role in tumorigenesis and progression. Pathways that SLC2A4-related genes most significantly enrichedinclude translocation of SLC2A4 (GLUT4) to the plasma membrane, PID INSULIN PATHWAY, PID INSULIN GLUCOSE PATHWAY, response to insulin and protein localization to plasma membrane. These pathways may contribute to the discovery of novel mechanisms of SLC2A4.
Insulin is a kind of protein hormone secreted by islet β cells, and it is also the only hormone that can reduce blood glucose in human body. Increasing evidence suggested that the upregulated insulin was associated with tumorigenesis and cancer growth [Citation46–48]. Although increased insulin production was a common phenomenon during cancer development, the insulin resistance also occurred in the normal tissues and lead to alterations in carbohydrate and lipid metabolism [Citation48]. Insulin and insulin-like growth factor receptors may play a pivotal role in cell fate determination, and they can regulate cell proliferation, differentiation, apoptosis, glucose transport, and energy metabolism [Citation47]. When exposed to hyperinsulinemia, cancer cells gain a selective growth advantage compared to normal tissues [Citation46]. It has been found that the higher breast cancer incidence and higher all-cause mortality after breast cancer were significantly correlated with higher levels of insulin resistance in postmenopausal women [Citation49,Citation50]. Analyzing protein–protein interaction network in STRING database, SLC2A4 also participates in the translocation of SLC2A4 (GLUT4) to the plasma membrane and protein localization to plasma membrane through enriched proteins such as EXOC5 and C2CD5, which play an important role in human cancers. However, most of them were rarely studied in the pathways we found. Another important pathway related to SLC2A4 was AMP-activated proteinkinase (AMPK) pathway, which was a highly conserved and widely expressed energy balance regulator in eukaryotic cells and play a key role in carcinogenesis and cancer drug resistance [Citation51–53]. Seventeen related genes we found were closely associated with AMPK signaling pathway, including AKT1, RAB8A, and IRS1. Studies demonstrated that Insulin receptor substrate 1 (IRS1) promoted tumor growth in colorectal cancer targeted by miR-30a-5p and was stabilized by RNA-bindingprotein lin-28 homolog B (LIN28B) [Citation54]. It is important to correlate the data with the insulin levels of each cancer patient. If the cancer patient had Type 2 diabetes characterized by insulin resistance of course GLUT4 levels will be reduced. In that case, SLC2A4 expression level has no prognostic level for cancer outcome but diabetes and increased insulin secretion have. Reduced GLUT4 expression is only a byproduct of high chronic plasma insulin levels.
The most common genes enriched in 23 pathways were ARF6, AKT1, VAMP2, MYO1C, MYO5A, and RAB8A, which were found in 14, 13, 13, 12, 12, and 12 gene sets, respectively. Other genes such as INS, RNB10, PRKCZ, RAB13, and RAB10 can also participate in most pathways. Li et al. [Citation55] indicated that ARF6 can regulate the functions of membrane traffic, and overexpression of ARF6 was correlated with poor prognosis in multiple invasive cancers, such as triple-negative breast cancer and invasive clear cell renal cell carcinoma. Riggio et al. [Citation56] demonstrated that AKT1 promoted cell proliferation via upregulating cyclin-dependent kinase 1 and S6, and C-X-C motif chemokine receptor 2 (CXCR2) promoted breast cancer metastasis and chemoresistance by inhibiting AKT1 and activating COX2 (Cyclooxygenase 2). Moreover, Wang et al. [Citation57] showed that the expression of vesicle-associated membrane protein 2 (VAMP2) was negatively regulated by miR-493-5p and further suppressed the proliferation and migration in liver cancer. Several studies had showed that Myosin 1 C (MYO1C) may play a key role in regulatingautophagosome–lysosome fusion through F-actin remodeling, and miR-137 overexpression inhibited the cell migration, proliferation by targeting Krűppel-likefactor 12 (KLF12) and MYO1C in gastric cancer cell lines [Citation58,Citation59]. Besides, myosin VA (MYO5A) may play a crucial role of diagnosis and prognosis in glioblastoma multiforme and gastric cancer [Citation60,Citation61]. Li et al. [Citation62] found that Rab8a can regulate GLUT4 trafficking in muscle and adipose cells, and the suppression of Rab8A inhibited insulin-stimulated GLUT4 translocation. These results revealed that SCL2A4 had undeniable potential functions in the development and progression of human cancers.
There were some limitations in our research. First, all of our analysis were conducted based on publicly available datasets and further experimental studies consisting of larger sample sizes may contribute to validate our results. Meanwhile, performing abundant investigations will validate whether the bioinformatics results from public datasets is uniform with immunohistochemistry staining or western blot. Second, the study required more comprehensive and detailed analysis; researching all the gene sets enriched by Metascape will help to explore more potential functions and mechanisms of SLC2A4 in breast cancer. The potential diagnostic and therapeutic role of SLC2A4 can be assessed in great detail. Finally, we only investigated the most likely prognostic biomarker of SLC2s in breast cancer. Biomolecular network of other SLC2 family members will help us to deeply understand the role of SLC2s in breast cancer.
Conclusion
In conclusion, we systematically analyzed the potential function and molecular mechanism of SLC2s in human cancer. High expression of SLC2A4 was significantly correlated with better prognosis in breast cancer patients. Furthermore, the expression of SLC2A4 mRNA was found to be regulated by DNA hypermethylation. To our knowledge, this is the first study that revealed that SLC2A4 could be a prognostic biomarker for survivals of breast cancer patients.
Supplemental Material
Download MS Word (36 KB)Disclosure statement
No potential conflict of interest was reported by the authors.
Supplementary material
Supplemental data for this article can be accessed here
Additional information
Funding
References
- Schwartz L,Supuran CT,Alfarouk KO.The Warburg effect and the Hallmarks ofcancer.Anticancer Agents Med Chem.2017;17(2):164–170.
- Tekade RK,Sun X.The Warburg effect andglucose-derived cancertheranostics.Drug Discov Today.2017;22(11):1637–1653.
- Augustin R.The protein family of glucose transport facilitators: it’s not only about glucose after all.IUBMB Life.2010;62:315–333.
- Thorens B,Mueckler M.Glucose transporters in the 21stCentury.Am J Physiol Endocrinol Metab.2010;298(2):E141–145.
- Mueckler M,Thorens B.The SLC2 (GLUT) family of membranetransporters.Mol Aspects Med.2013;34(2–3):121–138.
- Fan H,Zhou Y,Wen H,et al.Genome-wideidentification and characterization of glucose transporter (glut) genes in spotted sea bass (Lateolabrax maculatus) and their regulated hepatic expression duringshort-termstarvation.Comp Biochem Physiol Part D Genomics Proteomics.2019;30:217–229.
- Wieman HL,Wofford JA,Rathmell JC.Cytokine stimulation promotes glucose uptake viaphosphatidylinositol-3 kinase/Akt regulation of Glut1 activity andtrafficking.Mol Biol Cell.2007;18(4):1437–1446.
- Yuan G,Zhao Y,Wu D, et al.Mir-150up-Regulates Glut1 and increases glycolysis in osteosarcomacells.Asian Pac J Cancer Prev.2017;18:1127–1131.
- Wei S,Fan Q,Yang L,et al.Promotion of glycolysis by HOTAIR through GLUT1 upregulation via mTORsignaling.Oncol Rep.2017;38(3):1902–1908.
- Wu CH,Ho Y-S,Tsai C-Y,et al.In vitro and in vivo study ofphloretin-induced apoptosis in human liver cancer cells involving inhibition of type II glucosetransporter.Int J Cancer.2009;124(9):2210–2219.
- Barron CC,Bilan PJ,Tsakiridis T, et al.Facilitative glucose transporters: implications for cancer detection, prognosis andtreatment.Metabolism.2016;65(2):124–139.
- Van den Abbeele AD,Gatsonis C,De Vries DJ,et al.ACRIN 6665/RTOG 0132 Phase II trial of Neoadjuvant Imatinib Mesylate for operable malignant gastrointestinal stromal tumor: monitoring with18F-FDG PET and correlation with genotype and GLUT4expression.J Nucl Med.2012;53(4):567–574.
- Zamora-León SP,Golde DW,Concha II,et al.Expression of the fructose transporter GLUT5 in human breastcancer.Proc Natl Acad Sci U S A.1996;93(5):1847–1852.
- Rhodes DR,Yu J,Shanker K,et al.ONCOMINE: a cancer microarray database and integrateddata-miningplatform.Neoplasia.2004;6(1):1–6.
- Chandrashekar DS,Bashel B,Balasubramanya SAH,et al.UALCAN: a portal for facilitating tumor subgroup gene expression and survivalanalyses.Neoplasia.2017;19(8):649–658.
- Lánczky A,Nagy Á,Bottai G,et al.miRpower: aweb-tool to validatesurvival-associated miRNAs utilizing expression data from 2178 breast cancerpatients.Breast Cancer Res Treat.2016;160(3):439–446.
- Cerami E,Gao J,Dogrusoz U,et al.The cBio cancer genomics portal: an open platform for exploring multidimensional cancer genomicsdata.Cancer Discov.2012;2(5):401–404.
- Koch A,De Meyer T,Jeschke J, et al.MEXPRESS: visualizing expression, DNA methylation and clinical TCGAdata.BMC Genomics.2015;16(1):636.
- Huang WY,Hsu S-D,Huang H-Y,et al.MethHC: a database of DNA methylation and gene expression in humancancer.Nucleic Acids Res.2015;43(D1):D856–861.
- Szklarczyk D,Franceschini A,Wyder S,et al.STRING v10:protein-protein interaction networks, integrated over the tree oflife.Nucleic Acids Res.2015;43(D1):D447–452.
- Tripathi S,Pohl M,Zhou Y,et al.Meta- and orthogonal integration of Influenza “OMICs” data defines a role for UBR4 in virus budding.Cell Host Microbe.2015;18(6):723–735.
- Curtis C,Shah SP,Chin S-F,et al.The genomic and transcriptomic architecture of 2,000 breast tumours reveals novelsubgroups.Nature.2012;486(7403):346–352.
- Zhao H,Langerød A,Ji Y,et al.Different gene expression patterns in invasive lobular and ductal carcinomas of thebreast.Mol Biol Cell.2004;15(6):2523–2536.
- Finak G,Bertos N,Pepin F,et al.Stromal gene expression predicts clinical outcome in breastcancer.Nat Med.2008;14(5):518–527.
- Wei W,Zeng H,Zheng R,et al.Cancer registration in China and its role in cancer prevention andcontrol.Lancet Oncol.2020;21(7):e342–e349.
- Sharma S,Kelly TK,Jones PA.Epigenetics incancer.Carcinogenesis.2010;31(1):27–36.
- Joost HG,Thorens B.The extendedGLUT-family of sugar/polyol transport facilitators: nomenclature, sequence characteristics, and potential function of its novel members(review).Mol Membr Biol.2001;18(4):247–256.
- Wood IS,Trayhurn P.Glucose transporters (GLUT and SGLT): expanded families of sugar transportproteins.Br J Nutr.2003;89(1):3–9.
- Huang S,Czech MP.The GLUT4 glucosetransporter.Cell Metab.2007;5(4):237–252.
- Tozzo E,Shepherd PR,Gnudi L, et al.TransgenicGLUT-4 overexpression in fat enhances glucose metabolism: preferential effect on fatty acidsynthesis.A J Physiol.1995;268:E956–964.
- Tsao TS,Li J,Chang KS,et al.Metabolic adaptations in skeletal muscle overexpressing GLUT4: effects on muscle and physicalactivity.FASEB J.2001;15(6):958–969.
- Aruleba RT,Adekiya TA.Structural studies of predicted ligand binding sites and molecular docking analysis of SLC2A4 as a therapeutic target for the treatment ofcancer. Int J Mol Sci. 2018;19.https://doi.org/10.3390/ijms19020386.
- Garrido P,Osorio FG,Morán J,et al.Loss of GLUT4 induces metabolic reprogramming and impairs viability of breast cancercells.J Cell Physiol.2015;230(1):191–198.
- Gu CJ,Xie F,Zhang B,et al.High glucose promotesEpithelial-Mesenchymal transition of uterus endometrial cancer cells by increasingER/GLUT4-Mediated VEGFsecretion.Cell Physiol Biochem.2018;50(2):706–720.
- Mao A,Zhou X,Liu Y, et al.KLF8 is associated with poor prognosis and regulates glycolysis by targeting GLUT4 in gastriccancer. J Cell Mol Med. 2019;23:5087–5097.
- Kim YA,Keogh JB,Clifton PM.Probiotics, prebiotics, synbiotics and insulinsensitivity.Nutr Res Rev.2018;31(1):35–51.
- Sadler JB,Bryant NJ,Gould GW, et al.Posttranslational modifications of GLUT4 affect its subcellular localization andtranslocation.Int J Mol Sci.2013;14(5):9963–9978.
- Able AA,Richard AJ,Stephens JM.Loss of DBC1 (CCAR2) affects TNFα-inducedlipolysis and Glut4 gene expression in murine adipocytes.J Mol Endocrinol.2018;61(4):195–205.
- Moraes-Vieira PM,Saghatelian A,Kahn BB.GLUT4 expression in adipocytes regulates de Novo lipogenesis and levels of a novel class of lipids with antidiabetic andanti-inflammatoryeffects.Diabetes.2016;65(7):1808–1815.
- Kondo T,Nakamura M,Kitano S,et al.The clinical course and pathophysiological investigation of adolescent gestational diabetes insipidus: a casereport.BMC Endocr Disord.2018;18(1):4.
- Holloszy JO.Regulation of mitochondrial biogenesis and GLUT4 expression byexercise.Compr Physiol.2011;1:921–940.
- Koh JH,Hancock CR.AMPK and PPARβ positive feedback loop regulates endurance exercise training-mediatedGLUT4 expression in skeletal muscle. Am J Physiol Endocrinol Metab. 2019;316:E931–e939.
- Flores-Opazo M,McGee SL,Hargreaves M.Exercise and GLUT4. Exerc Sport Sci Rev. 2020;48:110–118.
- Balakrishnan BB,Krishnasamy K,Mayakrishnan V, et al.Moringa concanensis Nimmo extracts ameliorates hyperglycemia-mediatedoxidative stress and upregulates PPARγ and GLUT4 gene expression in liver and pancreas of streptozotocin-nicotinamideinduced diabetic rats.Biomed Pharmacothe.2019;112:108688.
- Neisy A,Zal F,Seghatoleslam A, et al.Amelioration by quercetin of insulin resistance and uterine GLUT4 and ERα gene expression in rats with polycystic ovary syndrome (PCOS).Reprod Fertil Dev.2019;31(2):315–323.
- Vigneri R,Goldfine ID,Frittitta L.Insulin, insulin receptors, andcancer.J Endocrinol Invest.2016;39(12):1365–1376.
- Djiogue S,Nwabo Kamdje AH,Vecchio L,et al.Insulin resistance and cancer: the role of insulin andIGFs.Endocr Relat Cancer.2013;20(1):R1–r17.
- Argilés JM,López-Soriano FJ.Insulin and cancer(Review).Int J Oncol.2001;18:683–687.
- Pan K,Chlebowski RT.Insulin resistance and breast cancer incidence and mortality in postmenopausal women in the Women’s health initiative. Cancer. 2020;126:3638–3647.
- Yee LD,Mortimer JE,Natarajan R, et al.Metabolic health, Insulin, and breast cancer: Why oncologists should care aboutInsulin.Front Endocrinol (Lausanne).2020;11:58.
- Jeon SM,Hay N.Thedouble-edged sword of AMPK signaling in cancer and its therapeuticimplications.Arch Pharm Res.2015;38(3):346–357.
- Hardie DG,Schaffer BE,Brunet A.AMPK: anEnergy-Sensing Pathway with Multiple Inputs andOutputs.Trends Cell Biol.2016;26(3):190–201.
- Wang Z,Wang N,Liu P, et al.AMPK andCancer.Experientia supplementum (2012).2016;107:203–226.
- Tang M,Zhou J,You L, et al.LIN28B/IRS1 axis is targeted bymiR-30a-5p and promotes tumor growth in colorectalcancer. J Cell Biochem. 2020; 121: 3720–3729.
- Li R,Peng C,Zhang X,et al.Roles of Arf6 in cancer cell invasion, metastasis andproliferation.Life Sci.2017;182:80–84.
- Riggio M,Perrone MC,Polo ML,et al.AKT1 and AKT2 isoforms play distinct roles during breast cancer progression through the regulation of specific downstreamproteins.Sci Rep.2017;7(1):44244.
- Wang G,Fang X,Han M, et al.MicroRNA-493-5p promotes apoptosis and suppresses proliferation and invasion in liver cancer cells by targetingVAMP2.Int J Mol Med.2018;41:1740–1748.
- Du Y,Chen Y,Wang F, et al.miR-137 plays tumor suppressor roles in gastric cancer cell lines by targeting KLF12 andMYO1C.Tumour Biol.2016;37(10):13557–13569.
- Zhang Y,Jiang X,Deng Q,et al.Downregulation of MYO1C mediated by cepharanthine inhibitsautophagosome-lysosome fusion through blockade of theF-actinnetwork.J Exp Clin Cancer Res.2019;38(1):457.
- Yang H,Jin L,Sun X.A thirteen‑gene set efficiently predicts the prognosis of glioblastoma.Mol Med Rep.2019;19:1613–1621.
- Huang K, ChenS, XieR, et al.Identification of three predictors of gastric cancer progression andprognosis. FEBS Open Bio. 2020;10:1891–1899.
- Li H,Ou L,Fan J,et al.Rab8A regulatesinsulin-stimulated GLUT4 translocation in C2C12myoblasts.FEBS Lett.2017;591(3):491–499.