
 ?Mathematical formulae have been encoded as MathML and are displayed in this HTML version using MathJax in order to improve their display. Uncheck the box to turn MathJax off. This feature requires Javascript. Click on a formula to zoom.
ABSTRACT
SLC2A3 is an important member of the glucose transporter superfamily. It has been recently suggested that upregulation of SLC2A3 is associated with poor survival and acts as a prognostic marker in a variety of tumors. Unfortunately, the prognostic role of SLC2A3 in head and neck squamous cell carcinoma (HNSC) is less known. In the present study, we analyzed SLC2A3 expression in HNSC and its correlation with prognosis using TCGA and GEO databases. The results showed that SLC2A3 mRNA expression was higher in HNSC compared with adjacent normal tissues, which was validated with our 9 pairs of HNSC specimens. Moreover, high SLC2A3 expression predicted poor prognosis in HNSC patients. Mechanistically, GSEA revealed that high expression of SLC2A3 was enriched in epithelial-mesenchymal transition (EMT) and NF-κB signaling. In HNSC cell lines, SLC2A3 knockdown inhibited cell proliferation and migration. In addition, NF-κB P65 and EMT-related gene expression was suppressed upon SLC2A3 knockdown, indicating that SLC2A3 may play a preeminent role in the progression of HNSC through the NF-κB/EMT axis. Meanwhile, the expression of SLC2A3 was negatively correlated with immune cells, suggesting that SLC2A3 may be involved in the immune response in HNSC. The correlation between SLC2A3 expression and drug sensitivity was further assessed. In conclusion, our study demonstrated that SLC2A3 could predict the prognosis of HNSC patients and mediate the progression of HNSC via the NF-κB/EMT axis and immune responses.
Introduction
Head and neck squamous cell carcinoma (HNSC) accounts for more than 90% of head and neck cancers, and the recurrence rate and distant metastasis are relatively high [Citation1]. Unfortunately, HNSC usually lacks apparent early clinical symptoms, resulting in late-stage diagnosis for most patients [Citation2]. There are more than 600,000 new cases and 380,000 HNSC-related deaths worldwide every year [Citation3]. The current 5-year survival rate for HNSC is lower than 65% [Citation4]. HNSCs originate from mucosal squamous cells, including tumors occurring in the oral cavity, sinus, pharynx and larynx. Numerous genetic and epigenetic aberrations have been described in different individual types, although the molecular mechanisms are not fully understood. Studies have shown that many phenotypic and molecular characteristics of epithelial cells are shared in squamous cell carcinoma [Citation5,Citation6]. Therefore, the molecular characteristics and prognostic markers that could be applied in HNSC need to be further explored.
SLC2A3 belongs to the SLC2A family, consisting of 14 members designated SLC2A1 through SLC2A14. SLC2A (also known as GLUT) genes are the major facilitator superfamily of membrane glucose transporters, which play a central role in glucose uptake along a concentration gradient [Citation7]. In the brain, SLC2A3 is the most abundant glucose transporter and plays a critical role in energy metabolism [Citation8]. The upregulation of SLC2A3 has also been reported in numerous cancer types and acts as a poor outcome indicator in patient-derived prostate xenograft tumors [Citation9], bladder cancer [Citation10], papillary thyroid carcinoma [Citation11], colorectal carcinoma [Citation12] and gastric cancer [Citation13]. However, the role of SLC2A3 in HNSC has not been well clarified.
In this study, we delineated the expression of SLC2A3 in HNSC through The Cancer Genome Atlas (TCGA) database and the role of SLC2A3 in prognosis. Moreover, we validated SLC2A3 expression in our HNSC samples and investigated its impact on the proliferation and migration of HNSC cell lines. In addition, SLC2A3 expression-related signaling pathways, the immune response and drug susceptibility were further explored. Overall, our study demonstrated that upregulation of SLC2A3 may be a potential prognostic biomarker and therapeutic target for HNSC.
Materials and methods
Data collection
We downloaded RNA-sequencing data for 546 HNSC cases, including 56,536 genes and corresponding clinical information, from The Cancer Genome Atlas (TCGA) (http://cancergenome.nih.gov). RNA sequencing data were converted into transcripts per million reads (TPM) and normalized to log2 (TPM+1). Moreover, 270 tumor arrays and 31,330 genes from GSE65858 were applied for prognosis prediction.
Expression of SLC2A3 in HNSC
The TIMER online database (https://cistrome.shinyapps.io/timer) was used to evaluate the expression of SLC2A3 and SLC2A1 across different tumors in TCGA data sets. Then, we used the R package “ggplot2” in R studio to explore the difference in SLC2A3 expression between HNSC tissues and normal samples from the TCGA database. The clinical data for HNSC on the TCGA platform and GEO (www.ncbi.nlm.nih.gov/geo; GSE65858, n = 270) data sets were used to study the relationship between the clinicopathological characteristics and the expression level of SLC2A3, which were classified into high and low groups based on the median value of the SLC2A3 transcript. Using the UALCAN database (http://ualcan.path.uab.edu/index.html), we analyzed the expression levels of the SLC2A3 gene in different tumor stages of HNSC and normal tissues in The Cancer Genome Atlas (TCGA) HNSC data set.
Prognosis and survival analysis
To evaluate the potential independent prognostic value of SLC2A3 in HNSC patients, we obtained clinicopathological data from the TCGA platform, including gender, age, T/N/M stage, clinical stage and lymphatic vascular invasion. The R package “glmnet” was used for univariate and multivariate Cox regression analyses. The parameters with P < 0.1 were retained for multivariate analysis and adjusted according to other standards (N/M stage, lymphovascular invasion). Statistical significance was set as p < 0.05. The R packages “ggrisk,” “survival,” and “survminer” were utilized for survival analysis. Receiver operating characteristic curve (ROC) analysis was carried out using the R package “pROC” and “ggplot2.” The patients with a relative value above or below the median were considered the high or low group for each gene expression level. Kaplan-Meier survival analysis with the log-rank test was then used to investigate the overall survival (OS) difference between the abovementioned groups.
Enrichment analysis of the SLC2A3 gene coexpression network in HNSC
The TCGA-HNSC data sets were analyzed using the R package “stat” to study the coexpressed genes related to SLC2A3 expression. Statistical correlations were obtained by calculating Pearson’s correlation coefficients, and the R package “ggplot2” was used to draw a heatmap. Gene Ontology (GO) function and Kyoto Encyclopedia of Genes and Genomes (KEGG) pathway enrichment analysis of coexpressed genes were performed by the “clusterProfifiler” package (version: 3.18.0) of R software, and visual analysis of data was performed by the “ggplot2” software package.
Gene Set Enrichment Analysis
To explore the possible pathway through which SLC2A3 may be involved in the regulation of HNSC, we divided the TCGA HNSC samples into two groups based on the median expression of SLC2A3 and performed gene set enrichment analysis (GSEA) with the differentially expressed genes (DEGs) between the low and high SLC2A3 expression groups. GSEA software (v4.1.0) was used to conduct the enrichment analysis. The MSigDB database V7.2 was used to obtain the hallmark gene set. False discovery rate (FDR)<0.25 and p.adjust<0.05 were considered statistically significant.
Immune cell analysis
The CIBERSORTx website (https://cibersortx.stanford.edu/) was utilized to analyze the relative abundance of 22 immune cell subtypes among TCGA HNSC. CIBERSORTx used a deconvolution algorithm to calculate the frequency of immune cells in each sample based on the expression levels and the matrix of gene expression of 22 immune cell-associated genes [Citation14]. We used the somatic copy number alteration (SCNA) module in the TIMER platform to analyze the relationship between SLC2A3 copy number variation (CNV) and immune cells. Kaplan‒Meier curve analysis was further performed to study the survival status based on different levels of immune cells.
Drug sensitivity analysis
We downloaded NCI-60 compound activity data from CellMiner™ (http://discover.nci.nih.gov/cellminer/). The data were analyzed by the R packages “impute,” “limma,” “ggplot2,” and “ggpubr” to identify the correlation between SLC2A3 expression and drug IC50.
Clinical samples
A total of 9 HNSC and paired adjacent normal tissues were obtained from our Department of ENT, the Affiliated Hospital of Qingdao University, Qingdao, Shandong, China. The study was approved by the Research Ethics Committee of our hospital. The histopathology of the specimens was determined by pathologists in the pathology department. The patients had not received any chemotherapy and/or radiotherapy before surgery.
Cell culture and shRNA construction
FaDu and CNE-2 cells were obtained from Shanghai Cell Bank (Shanghai, China) and cultured in high glucose DMEM with 10% fetal bovine serum. The two SLC2A3 shRNA target sequences were 5-CTTGGTCTTTGTAGCCTTCTT-3 and 5-AGTAGCTAAGTCGGTTGAAAT-3. The target sequence for the negative control was 5-CGCTGAGTACTTCGAAATGTC-3 against firefly luciferase. The primers were annealed and ligated into the tet-PLKO vector digested with AgeI and EcoRI. The shRNA plasmids were transfected into cells, which were then treated with 2 μg/ml doxycycline.
Western blot
The cells were lysed with 2% SDS buffer. After transfer, the membrane was incubated with primary antibodies against SLC2A3 (R24453, Zen Bio), E-cad (bs -10,009 R, Bioss), N-cad (bs-1172 R, Bioss), Vimentin (bs-0756 R, Bioss), Snai1 (bs-1371 R, Bioss), and NF-κB P65 (AP0123, ABclonal). GAPDH (E-AB-20059, Elabscience) and α-tubulin (AC007, ABclonal) were used as loading controls. The bands were quantified with ImageJ software and normalized to the loading control.
Quantitative PCR
Total RNA was extracted with RNA-easy Isolation Reagent (#R701, Vazyme). After quantification, the same amount of RNA was reverse transcribed with an RT Reagent Kit (RR037A, Takara). Quantitative PCR was performed using SYBR qPCR reagent (Q111, Vazyme). GAPDH for cells and 18S rRNA for tissues were used as reference genes. The following primers were used: SLC2A3-F: GTCGGACTCTTCGTCAACCG, SLC2A3-R: AGAGGCCAATAACCAAGCGA; CXCR4-F: CTCCTCTTTGTCATCACGCTTCC, CXCR4-R: GGATGAGGACACTGCTGTAGAG; CCR1-F: GCATCATCATTTGGGCCCTG, CCR1-R: AAAGTGAAGGCTGCAGGTGT; CCR8-F: TGGCTGTTGTCCATGCCGTGTA, CCR8-R: TGGGATGGTAGCCATAATGGCG; CCL2-F: GCAATCAATGCCCCAGTCAC, CCL2-R: CTTTGGGACACTTGCTGCTG; CCL13-F:CAGCAGGTGTCCCCAGAAG, CCL13-R: TTCAGGGTGTGAGCTTTCCG; 18 s rRNA-F: CTGGATACCGCAGCTAGGAA, 18 s rRNA-R: GAATTTCACCTCTAGCGGCG; GAPDH-F: TCGACAGTCAGCCGCATCTT, GAPDH-R: GAGTTAAAAGCAGCCCTGGTG.
Cell Counting Kit-8 (CCK8) assay
A total of 5000 cells were seeded into 96-well plates with six technical replicates. The next day, the cells were treated with 2 μg/ml doxycycline after transfection. For drug sensitivity validation, cells were treated with 750 nM obatoclax (Beyotime, SC4381) and 10 μM triciribine (Beyotime, SF2721) for 24 h after 48 h of transfection. At the indicated time point, the mixed solution of 100 μl DMEM and 10 μl CCK8 (A311, Vazyme, china) was added into each well and the cells were further incubated at 37°C for 30–60 minutes. The absorbance was measured at 450 nm after a half-hour incubation at 37°C.
In vitro scratch assay
The cells were seeded into 6-well plates and transfected with plasmids. At 24 hours after transfection, the image was taken as time point zero after scratching. Then, the medium was changed to serum-free medium with 2 μg/ml doxycycline. Images were taken at the indicated time points. The wound area was measured with ImageJ software. The wound recovery percentage was normalized to time point zero.
Statistical analysis
The data are presented as the mean ± SD. The experiments were repeated three times. Student’s t test and Mann – Whitney U test were used to determine the differences between the two groups. R (version 4.03) and Rstudio software were used for statistical analysis. Univariate and multivariate Cox regression analyses were used to identify the correlation between SLC2A3 expression levels and clinical characteristics. Survival analysis was assessed by the Kaplan – Meier method and the log-rank test. p < 0.05 was set as statistically significant.
Results
Elevated expression of SLC2A3 predicts poor survival in HNSC
First, we explored the expression of SLC2A3 mRNA in human tumors in the TCGA database. Compared to the normal tissues, SLC2A3 was found to be notably higher in tumor tissues of cholangiocarcinoma (CHOL), stomach adenocarcinoma (STAD), kidney renal clear cell carcinoma (KIRC) and HNSC but markedly decreased in bladder urothelial carcinoma (BLCA), breast invasive carcinoma (BRCA), cervical squamous cell carcinoma and endocervical adenocarcinoma (CESC), colon adenocarcinoma (COAD), glioblastoma multiforme (GBM), kidney chromophobe (KICH), lung adenocarcinoma (LUAD), lung squamous cell carcinoma (LUSC) and uterine corpus endometrial carcinoma (UCEC) (). In addition, the expression of another important family member, SLC2A1, was also analyzed (Supplementary Figure S1).
Figure 1. SLC2A3 expression and correlation with survival status in HNSC. (a) SLC2A3 mRNA expression levels in pan-cancer data from TCGA. (b) Comparison of SLC2A3 mRNA expression levels between all normal tissues and HNSC samples from TCGA. (c) SLC2A3 mRNA expression in matched HNSC samples from TCGA. (d) the relationship between SLC2A3 mRNA expression and tumor stages of HNSC patients in the UALCAN database. The correlation between SLC2A3 expression and (e) disease-specific survival, (f) overall survival (OS) in TCGA and (G) OS in GSE65858. (h) ROC curve analysis of SLC2A3 diagnosis. *P < 0.05; **P < 0.01; ***P < 0.001; ****P < 0.0001.
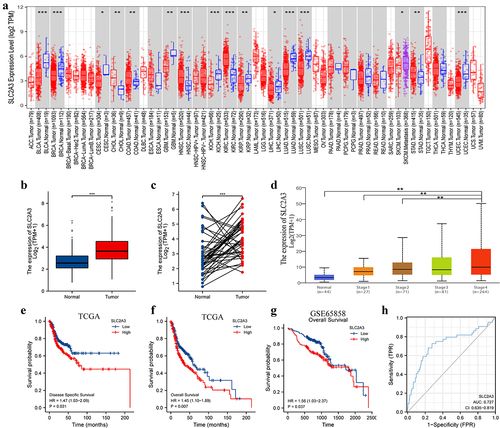
To study the expression level and prognostic impact of SLC2A3 in HNSC, we next analyzed the HNSC RNA-seq data in the TCGA database. The results showed that SLC2A3 expression was significantly upregulated in all HNSC tissues compared with normal tissues (). In line with the results, SLC2A3 was also increased in paired HNSC tissues (). Further exploration with the UALCAN database revealed that SLC2A3 expression was higher in late-stage HNSC than in early-stage HNSC (). We next investigated the relationship between SLC2A3 expression and survival status in TCGA and GSE65858. HNSC patients with high SLC2A3 expression had poor disease-specific survival () and overall survival (). These results suggest that SLC2A3 overexpression is associated with HNSC progression. In addition, ROC curve demonstrated that SLC2A3 could distinguish malignancy from adjacent normal tissues with AUC 0.727 (95% CI: 0.635–0.819) (), indicating that SLC2A3 could be used as a diagnostic marker in HNSC.
Association of SLC2A3 expression and clinical features of HNSC
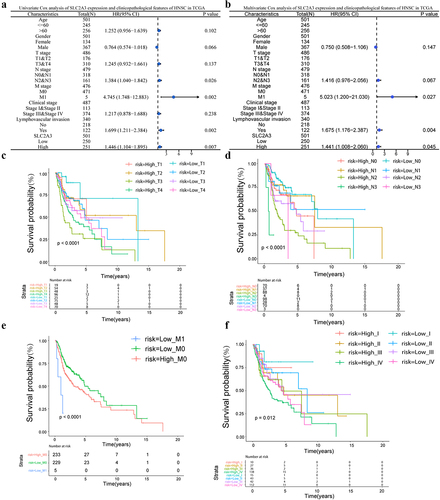
Next, we deciphered the relationship between SLC2A3 expression and the clinical characteristics of HNSC. The results showed that SLC2A3 expression was significantly correlated with T classification, M classification and clinical stage (Table S1). N type, M type, and lymphatic infiltration were prognostic risk factors in univariate Cox regression analysis (). In multivariate Cox regression analysis, all three prognostic risk factors were identified as independent significant predictors (). Moreover, SLC2A3 expression was compared among different clinical TNM stages and pathological degrees in HNSC patients. The results showed that higher SLC2A3 expression predicted poor survival in the same TNM stages and clinical stages and the differences look more apparent for the T stage stratification ().
Figure 2. SLC2A3 expression was associated with the clinicopathological features of HNSC based on TCGA. (a) Univariate and (b) multivariate Cox analyses of SLC2A3 expression and clinicopathological variables. Kaplan – Meier analysis of overall survival for patients showed significant differences between high and low SLC2A3 expression groups with (c) T stage (d), N stage (e), M stage and (f) clinical stages.
Enrichment analysis of genes coexpressed with SLC2A3 in HNSC
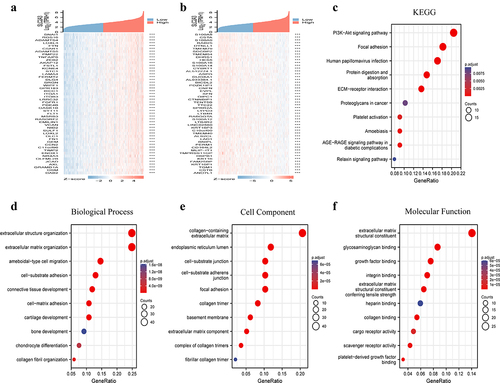
The coexpressed genes related to SLC2A3 expression in the TCGA-HNSC database were obtained by the deseq2 package of R software. A heatmap showed the top 50 genes positively or negatively correlated with SLC2A3 expression (). We further performed GO and KEGG analyses for the top upregulated and downregulated genes in . The results demonstrated that the top 50 upregulated genes were mainly related to ECM and focal adhesion and the PI3K-AKT pathway (supplementary figure S2A). Interestingly, the top 50 downregulated genes were strongly related to epidermal cell differentiation, keratinization and cornification (supplementary figure S2B). The results suggested that SLC2A3 may play an important role in cell proliferation, differentiation and migration. In addition, we performed OS univariate analysis of the top 50 up/downregulated genes associated with SLC2A3 expression, which is shown in Supplementary Table 1 and Table 2. GO function and KEGG pathway enrichment of the top 200 coexpressed genes positively correlated with the expression of SLC2A3 were performed by the “clusterProfifiler” package. With the threshold of p.adj<0.05 and qvalue<0.2, 318 biological processes (GO-BP), 20 cellular components (GO-CC), 29 molecular functions (GO-MF) and 10 KEGGs were obtained. KEGG pathway analysis demonstrated that SLC2A3 was mainly related to the PI3K−AKT signaling pathway (). The GO analysis data showed that most of the genes were associated with extracellular matrix structure (). The top 10 are displayed in the bubble chart, among which the PI3K-AKT signaling pathway and extracellular matrix structure were the most prominent features ().
Figure 3. Enrichment analysis of the SLC2A3 gene coexpression network in HNSC. Heatmaps show the top 50 coexpressed genes (a) positively and (b) negatively correlated with SLC2A3 expression in HNSC. Enrichment analysis of (c) KEGG and (d – f) GO for SLC2A3 coexpression genes.
SLC2A3 was positively correlated with the EMT signaling pathway in HNSC
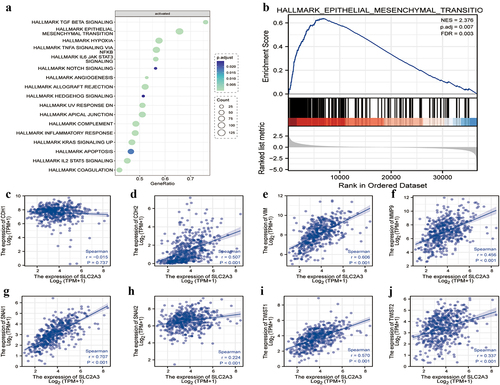
To further elucidate the underlying mechanisms of SLC2A3 in the progression of HNSC, the TCGA HNSC data sets were divided into two groups based on the median expression level of SLC2A3. GSEA data set genes were sorted according to their differential expression between the two groups. The results demonstrated that the epithelial-mesenchymal transition (EMT) pathway was significantly enriched in the activated pathways, which contained the most abundant genes among the top 3 pathways (). We further performed GSEA of the EMT pathway subset for DEGs, which ranked in order as shown in the lower panel of . GSEA demonstrated that the EMT pathway was enriched in the upregulated genes (NES = 2.376) (). Furthermore, a significant positive correlation was observed between the expression of SLC2A3 and EMT-related gene signatures, including N-cad, vimentin, MMP9, Snai1, Snai2, Twist1 and Twist2 (). There was a negative correlation between SLC2A3 and E-cad, although it was not statistically significant (). Our results suggested that SLC2A3 may promote the development of HNSC by regulating the EMT pathway.
Figure 4. SLC2A3 expression was correlated with EMT gene signatures in TCGA-HNSC. GSEA of DEGs between the low and high SLC2A3 expression groups from TCGA-HNSC for (a) activated pathways and (b) EMT gene signature. NES: normalized enrichment score. FDR: false discovery rate. (c-j) Correlation between SLC2A3 expression and EMT-related genes.
SLC2A3 was positively correlated with NF-κB in HNSC
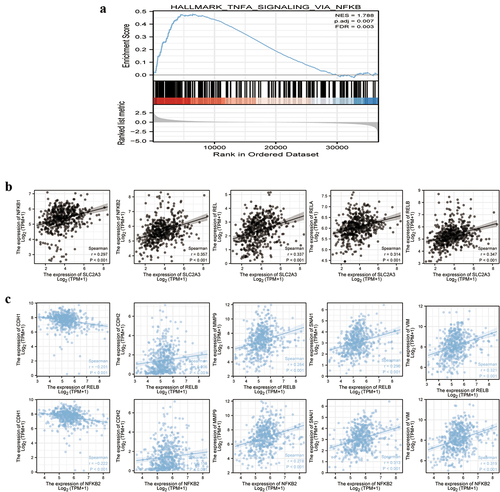
NF-κB activation is essential for the EMT pathway in many cancers [Citation15,Citation16]. GSEA revealed that NF-κB was enriched in the upregulated genes in HNSC (). SLC2A3 expression was positively correlated with five NF-κB family members, NF-κB1, NF-κB2, REL, RELA and RELB (). Moreover, we screened all five NF-κB family members and only RELB and NF-κB2 gene expression levels were positively correlated with N-cad, MMP9, Snai1 and Vimentin and negatively correlated with E-cad ().
Figure 5. SLC2A3 expression was associated with NF-κB, and NF-κB was associated with EMT gene signatures in TCGA-HNSC. (a) GSEA of DEGs between the low and high SLC2A3 expression groups from TCGA-HNSC for NF-κB signaling. NES: normalized enrichment score. FDR: false discovery rate. (b) Correlation between SLC2A3 and the expression of NF-κB1, NF-κB2, REL, RELA and RELB. (c) Both RELB and NF-κB2 were positively correlated with the expression of N-cad, vimentin, Snai1 and MMP9 and negatively correlated with the expression of E-cad.
SLC2A3 regulated HNSC progression through the immune response
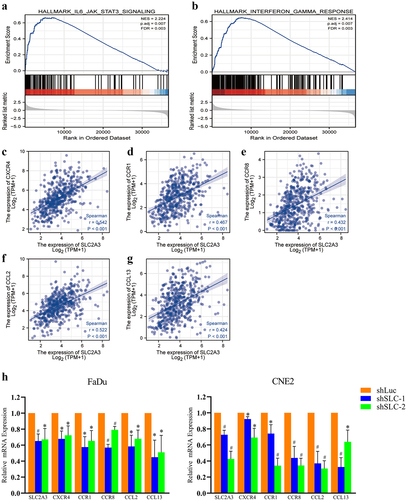
SLC2A3 may affect the immune response [Citation17]. GSEA revealed that IL6/JAK/STAT3 signaling and interferon-γ response pathways were enriched in the upregulated genes in HNSC (). In addition, the enrichment analysis of immune characteristics was performed for all the CXCR, CCR and CCL family members in HNSC samples and HNSC cell lines. The SLC2A3 expression was only positively correlated with the immune response genes CXCR4, CCR1, CCR8, CCL2 and CCL13 (). The qPCR results validated that SLC2A3 knockdown inhibited the mRNA expression of CXCR4, CCR1, CCR8, CCL2 and CCL13 ().
Figure 6. SLC2A3 expression was correlated with IL6/JAK/STAT3 signaling and interferon-γ hallmark gene sets. GSEA of DEGs between the low and high SLC2A3 expression groups from TCGA-HNSC for the (a) IL6/JAK/STAT3 signaling pathway and (b) interferon- response pathway. NES: normalized enrichment score. FDR: false discovery rate. (c-g) the positive correlation between SLC2A3 and the expression of CXCR4, CCR1, CCR, CCL2 and CCL13 based on TCGA-HNSC. (h) SLC2A3 knockdown inhibited the mRNA expression of CXCR4, CCR1, CCR8, CCL2, and CCL13. Each value represents the mean ± SD of three separate experiments. *P < 0.05; **P < 0.01.
Relationship between SLC2A3 expression and tumor immune cells
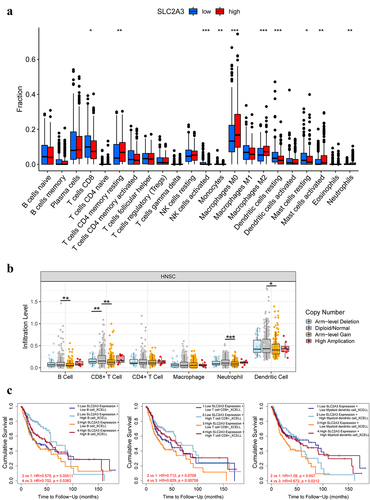
Tumor immune cells play an important role in the occurrence and development of tumors [Citation18–21]. To explore the relationship between SLC2A3 and tumor immune cells, we analyzed the correlation between SLC2A3 expression and HNSC immune cells by CIBERSORTx. Compared with the low SLC2A3 expression group, in the high SLC2A3 expression group, the proportions of resting memory CD4 T cells, macrophages (M0 and M2), activated mast cells and neutrophils were increased, whereas decreased proportions of CD8 T cells, activated NK cells, monocytes, resting DCs and resting mast cells were observed (). Meanwhile, compared with the diploid/normal group, Arm-level gain of SLC2A3 resulted in decreased infiltration levels of B cells, CD8+ T cells, neutrophils and dendritic cells (). However, TIMER analysis demonstrated that high infiltration levels of B cells, CD8+ T cells and dendritic cells still predicted better OS of HNSC patients with high SLC2A3 expression (P < 0.05) ().
Figure 7. Correlation between SLC2A3 expression and tumor immune infiltrating cells. (a) Infiltration of 22 immune infiltrating cells between HNSC patients with low and high SLC2A3 expression obtained by CIBERSORTx. (b) Comparison of immune infiltrating cell levels in HNSC with different SLC2A3 CNVs. (c) Clinical survival outcome of HNSC patients with high B cell, CD8+ T-cell and myeloid dendritic cell infiltration. *P < 0.05; **P < 0.01; ***P < 0.001; ****P < 0.0001.
Drug sensitivity analysis
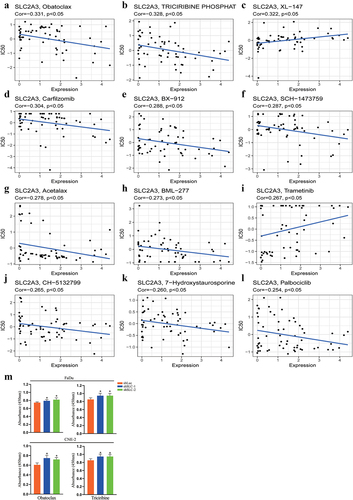
Based on the CellMiner database, we next investigated the potential correlation between drug sensitivity and SLC2A3 expression in HNSC. As a result, SLC2A3 expression was negatively associated with the IC50 of obatoclax, triciribine phosphat, carfilzomib, BX − 912, SCH−1473759, acetalax, BML−277, CH − 5132799, 7−hydroxystaurosporine and palbociclib (, b, D-H, J, K) and positively associated with XL − 147 and trametinib (), which indicated that SLC2A3 expression levels could be an effective prognostic indicator for HNSC patients in chemotherapy. We further validated the effect of obatoclax and triciribine with a CCK8 assay. The FaDu and CNE-2 cells showed slightly better viability upon SLC2A3 knockdown ().
Figure 8. Scatter plot of the relationship between SLC2A3 expression and drug sensitivity. SLC2A3 expression was (a, b, d-h, j-l) negatively or (c, i) positively correlated with the IC50 of drugs approved by the FDA. (M) Effect of obatoclax and triciribine on cell viability upon SLC2A3 knockdown. *P < 0.05.
Validation of SLC2A3 expression in HNSC samples
To validate the SLC2A3 expression pattern in HNSC, we collected 9 pairs of HNSC originating in the nasopharynx, hypopharynx, larynx, oropharynx and skull base (Table S1). The results showed that SLC2A3 mRNA expression was significantly elevated in cancer samples compared to adjacent normal tissues ().
Figure 9. SLC2A3 knockdown inhibited proliferation and migration and NF-κB/EMT-related gene expression in FaDu and CNE-2 cell lines. (a) SLC2A3 mRNA expression in adjacent normal tissues (ANT) and HNSC samples. (b) Cell proliferation and (c) migration were suppressed upon SLC2A3 knockdown. (d) SLC2A3 knockdown inhibited N-cad, Vimentin, and Snai1 expression but increased E-cad expression. (e) NF-κB P65 expression was decreased upon SLC2A3 knockdown. Each value represents the mean ± SD of three separate experiments. * p < 0.05, # p < 0.01.
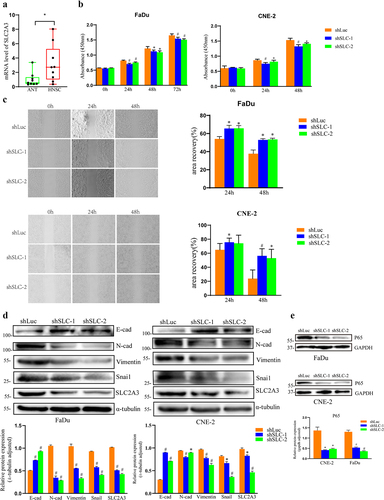
SLC2A3 silencing attenuated EMT signaling in FaDu and CNE-2 cells
Next, we uncovered the underlying mechanisms of SLC2A3 in FaDu and CNE-2 cells. Cell proliferation () and migration () were inhibited upon SLC2A3 knockdown. Our results of data mining in HNSC revealed that SLC2A3 expression was strongly associated with the NF-κB pathway and EMT signaling. We found that SLC2A3 knockdown resulted in enhanced expression of E-cad and downregulation of N-cad, Vimentin and Snai1 in both cell lines (). It has been reported that the NF-κB pathway is involved in the induction and maintenance of EMT. Our GSEA also indicated that NF-κB expression is positively correlated with the EMT signature. In HNSC cell lines, we observed that NF-κB P65 protein was suppressed by SLC2A3 knockdown. Together, our results suggested that SLC2A3 may regulate EMT signaling via the NF-κB pathway ().
Discussion
HNSC is one of the most common malignant cancers worldwide and arises from the epithelium in the head and neck, leading to as many as 50% of deaths [Citation22]. However, there is a lack of effective biomarkers for the prognosis of HNSC. Our results suggested that SLC2A3 could be used as a biomarker in HNSC. Studies have demonstrated that SLC2A3 is a primary neuronal glucose transporter. It also plays an important role in glucose absorption in sperm, preimplantation embryos and cultured leukocytes [Citation23]. In the context of tumors, SLC2A3 expression is increased in various types of tumors, including colon cancer [Citation24], gastric cancer [Citation25], breast cancer [Citation26], and lung cancer [Citation27]. It has been well documented that tumor cells increase the uptake and metabolism of glucose to generate energy even under normal oxygen conditions. The low KM and high VMAX of SLC2A3 on glucose uptake suggested a preeminent role for SLC2A3 in energy production [Citation28]. We searched all the SLC2A members and found that SLC2A3 could be a novel prognostic biomarker in HNSC.
In our study, we found that the expression level of SLC2A3 in HNSC tissues was significantly higher than that in normal tissues through bioinformatic analysis. Moreover, we also observed the enhanced expression of SLC2A3 in our clinical samples. A large number of studies have shown that SLC2A3 promotes the growth and proliferation of tumor cells in different cancers [Citation24,Citation27,Citation29]. Our results showed that cell proliferation and migration were suppressed upon SLC2A3 knockdown in FaDu and CNE-2 cells. Recent studies have indicated the predictive value of the SLC2A family. A 3-gene prognostic index including BRCA1, QKI, and SLC2A1 indicated a high risk of recurrence and death in early-stage lung adenocarcinoma patients [Citation30], and SLC2A1 and SLC2A3 were significant indicators of poor prognosis in stage I non-small cell lung cancer (NSCLC) [Citation31]. In laryngeal squamous cell carcinoma, patients with positive expression of a 3-gene signature including SLC2A1, vimentin and N-cad have much shorter survival times than those with negative expression [Citation32], whereas another study demonstrated that SLC2A3 but not SLC2A1 acted as a significant marker of poor prognosis [Citation33]. In mammary epithelial cells, SLC2A1 knockdown led to increased Vimentin and decreased E-cad [Citation34]. A recent meta-analysis revealed that SLC2A1 was associated with poorer OS among HNSC patients [Citation35]. The expression of SLC2A1 and SLC2A3 was significantly elevated in biopsies of primary HNSC compared to the corresponding normal gingiva [Citation36]. Botha et al. revealed that only SLC2A1 and SLC2A3 have potential value in the prognosis of oral squamous cell carcinoma [Citation37]. High expression of SLC2A3 was correlated with poor survival in different cancer types, including gastric cancer [Citation25], glioma [Citation38], colorectal cancer (CRC) [Citation24] and NSCLC [Citation27]. Unfortunately, the predictive role of SLC2A3 in HNSC is less known. Here, our results demonstrated that SLC2A3 predicted poor survival in HNSC. The SLC2A3 level was correlated with increased clinical stage and lymph node metastasis, indicating the potential prognostic value of SLC2A3 in HNSC. The correlation with stratification of T stage is more apparent, indicating SLC2A3 expression may represent an early event in HNSC progression. Nevertheless, no obvious prediction value of SLC2A1 was observed. This may be attributed to different sample sources in these studies.
Current studies on the role of SLC2A3 have mainly focused on glucose metabolism [Citation24,Citation39,Citation40]. In this study, the coexpressed genes associated with SLC2A3 in HNSC were analyzed by the R software package. The results showed that the PI3K/AKT signaling and extracellular matrix pathways were enriched in the KEGG and GO analyses. It has been well documented that the PI3K/AKT signaling pathway is involved in GLUT1/4 (SLC2A1/4) translocation to the plasma membrane in normal tissues and tumors [Citation41,Citation42]. However, the link between PI3K/AKT signaling and GLUT3 (SLC2A3) trafficking is less addressed. AKT could regulate GLUT3 surface localization during Mycobacterium tuberculosis infection in macrophages [Citation43]. In addition, PI3K/AKT signaling could promote GLUT3 expression in the SH-SY5Y neuroblastoma cell line [Citation44]. Conversely, in nonmalignant human breast cells, GLUT3 overexpression activated AKT signaling, and SLC2A3 knockdown led to AKT inactivation [Citation45]. Interestingly, the extracellular matrix pathway ranked the top in all three GO subontologies (BP, CC, MF). It has been reported that extracellular matrix organization is one of the top three enriched GO terms in SLC2A3 compared to SLC2A1-overexpressing glioblastoma cells [Citation46]. On the other hand, the breakdown of extracellular matrix hyaluronan (HA) promoted SLC2A1 expression, resulting in increased tumor cell migration via upregulation of glycolysis. SLC2A3 was also increased in LiSa-2 cells upon HAase treatment, although it did not show similar consistency in some other cell lines, indicating cell type dependency [Citation47]. It seems that the regulation between the extracellular matrix and glucose transporters might be reciprocal. However, the link between extracellular matrix remodeling and glucose metabolism needs to be further explored in HNSC.
We also found that the EMT pathway was correlated with SLC2A3 in HNSC. EMT is an important pathological process that converts epithelial cells to mesenchymal-like cells to increase invasiveness, metastasis and drug sensitivity and therefore promotes tumor progression. In laryngeal squamous cell carcinoma, SLC2A1 expression was positively correlated with Vimentin and N-cad expression but negatively correlated with E-cad expression [Citation32]. SLC2A3 expression has been suggested to be correlated with EMT signatures in CRC and NSCLC [Citation27,Citation48]. In HNSC, we also found that SLC2A3 expression was highly associated with EMT signaling. Furthermore, by western blotting, we validated that upon SLC2A3 silencing, the expression of EMT-related genes, including N-cad, vimentin and Snai1, decreased, whereas that of E-cad increased. Interestingly, the important EMT gene ZEB1 could directly bind to the SLC2A3 gene promoter to activate transcription [Citation27]. Our results demonstrated that the strong positive correlation between NF-κB and SLC2A3 expression and NF-κB P65 protein expression was inhibited by SLC2A3 knockdown in FaDu and CNE-2 cells. It has been reported that the NF-κB pathway mediates EMT-related gene expression, including Snail, E-cad, ZEB-1/2, and Twist1 [Citation49–52], resulting in EMT phenotypes. Together, our study indicated that the SLC2A3/NF-κB/EMT axis is involved in HNSC progression. In addition, it has also been shown in the top 3 pathways that TGF-β and hypoxia are correlated with SLC2A3 expression. Hypoxia is a crucial factor in tumor development. Hypoxia could enhance SLC2A3 expression in normal and tumor cells. As a hypoxia marker, SLC2A3 expression was associated with poor prognosis in esophageal adenocarcinoma [Citation53], intestinal tumors [Citation54,Citation55], clear cell renal cell carcinoma [Citation56], oral squamous cell carcinoma [Citation57] and hepatocellular carcinoma [Citation58]. TGF-β signaling pathway plays a pivotal role in inducing EMT. In lung cancer cells TGF-β could upregulate SLC2A3 expression through the EMT gene ZEB1 [Citation59]. However, the link between TGF-β signaling and SLC2A3 expression is much less addressed and needs to be further investigated.
SLC2A3, as one of the combined biomarkers of the high-risk group, was significantly correlated with immune cells and lower expression of immune checkpoint molecules in esophageal adenocarcinoma, HNSC and CRC [Citation53,Citation60,Citation61]. In CRC, the expression of SLC2A3 was positively correlated with CD4+ and CD8+ T-cell infiltration [Citation48]. SLC2A3 is involved in inflammatory gene expression and M1 tumor-associated macrophages partially by regulating CXCL8 expression in triple-negative breast cancer [Citation26], yet SLC2A3 mediates the M2 subtype transition of macrophage infiltration in the gastric cancer microenvironment [Citation13]. In oral squamous cell carcinoma, a high level of CD8+ T-cell infiltration is associated with an improved patient outcome [Citation62]. Our results showed that CD8+ T cells and resting dendritic cells were decreased in high SLC2A3 expression group. Moreover, the arm-level gain of SLC2A3 was related to low immune cell infiltration, including B cells, CD8+ T cells, neutrophils and dendritic cells. We screened the correlation of SLC2A3 expression with all the CXCR, CCR and CCL family members. A significant correlation was observed only with CXCR4, CCR1, CCR8, CCL2 and CCL13. Interestingly, CXCR4 has been identified as an important immune suppressor, and inhibition of CXCR4 relieves this suppression, resulting in enhanced T and NK cell infiltration [Citation63,Citation64]. These results suggest that SLC2A3 may inhibit the immune response of the HNSC tumor microenvironment, which may explain the worse outcome of HNSC patients with high SLC2A3 expression. However, the underlying mechanisms need to be further investigated. It should be noted that the high infiltration of B cells, CD8+ T cells and dendritic cells could still indicate better outcomes in HNSC patients with high SLC2A3 expression.
In conclusion, our study demonstrated that the upregulation of SLC2A3 was strongly associated with clinical prognosis in HNSC. SLC2A3 plays an important role in promoting HNSC cell proliferation and migration. The SLC2A3-induced phenotype may be attributed to the activation of the NF-κB/EMT pathway and immune response. Together, these findings suggest that SLC2A3 could be used as a biomarker for HNSC prognosis and as a treatment target.
Abbreviation
CNV: copy number variation, DEGs: differentially expressed genes, EMT: epithelial-mesenchymal transition, GEO: Gene Expression Omnibus, GO: Gene ontology, HNSC: head and neck squamous cell carcinoma, GSEA: gene set enrichment analysis, KEGG: Kyoto Encyclopedia of Genes and Genomes, OS: overall survival, ROC: receiver operating characteristic, SCNA: somatic copy number alteration, TCGA: The Cancer Genome Atlas
Author contributions
FC and JZ wrote the paper and conceived and designed the experiments; TF, PJ and YH analyzed the data; LW, SY, XY, LY, ZX, RW, BX and XD collected and provided the sample for this study. All authors approved the final version of the manuscript.
Ethical approval
This study was performed in line with the principles of the Declaration of Helsinki. Approval was granted by the ethics committee of the Affiliated Hospital of Qingdao University.
Supplemental Material
Download Zip (2.8 MB)Disclosure statement
No potential conflict of interest was reported by the authors.
Data availability statement
The data that support the findings of this study are available on request from the corresponding author.
Supplementary material
Supplemental data for this article can be accessed online at https://doi.org/10.1080/19336950.2023.2208928.
Additional information
Funding
References
- Torre LA, Bray F, Siegel RL, et al. Global cancer statistics, 2012. Ca A Cancer J Clinicians. 2015 Mar;65(2):87–19.
- Yan K, Agrawal N, Gooi Z. Head and neck masses. Med Clin North Am. 2018 Nov;102(6):1013–1025.
- Sung H, Ferlay J, Siegel RL, et al. Global cancer statistics 2020: gLOBOCAN estimates of incidence and mortality worldwide for 36 cancers in 185 countries. Ca A Cancer J Clinicians. 2021 May;71(3):209–249.
- Miller KD, Siegel RL, Lin CC, et al. Cancer treatment and survivorship statistics, 2016. Ca A Cancer J Clinicians. 2016 Jul;66(4):271–289.
- Sun X, Li Z, Niu Y, et al. Jarid1b promotes epidermal differentiation by mediating the repression of Ship1 and activation of the AKT/Ovol1 pathway. Cell Prolif. 2019 Sep;52(5):e12638.
- Zhang J, Fu H, Xu Y, et al. Hyperoside reduces albuminuria in diabetic nephropathy at the early stage through ameliorating renal damage and podocyte injury. J Nat Med. 2016 Oct;70(4):740–748.
- Deng D, Yan N. GLUT, SGLT, and SWEET: structural and mechanistic investigations of the glucose transporters. Protein Sci. 2016 Mar;25(3):546–558.
- Jurcovicova J. Glucose transport in brain - effect of inflammation. Endocr Regul. 2014 Jan;48(1):35–48.
- Ryniawec JM, Coope MR, Loertscher E, et al. GLUT3/SLC2A3 is an endogenous marker of hypoxia in prostate cancer cell lines and patient-derived xenograft tumors. Diagnostics. (Basel, Switzerland). 2022 Mar 10; 12(3):676. DOI:10.3390/diagnostics12030676.
- Yang L, Li C, Qin Y, et al. A novel prognostic model based on ferroptosis-related gene signature for bladder cancer. Front Oncol. 2021;11:686044.
- Chai YJ, Yi JW, Oh SW, et al. Upregulation of SLC2 (GLUT) family genes is related to poor survival outcomes in papillary thyroid carcinoma: analysis of data from the Cancer Genome Atlas. Surgery. 2017 Jan;161(1):188–194.
- Kim E, Jung S, Park WS, et al. Upregulation of SLC2A3 gene and prognosis in colorectal carcinoma: analysis of TCGA data. BMC Cancer. 2019 Apr 3;19(1):302.
- Yao X, He Z, Qin C, et al. SLC2A3 promotes macrophage infiltration by glycolysis reprogramming in gastric cancer. Cancer Cell Int. 2020;20:503.
- Newman AM, Liu CL, Green MR, et al. Robust enumeration of cell subsets from tissue expression profiles. Nat Methods. 2015 May;12(5):453–457.
- Huber MA, Azoitei N, Baumann B, et al. NF-kappaB is essential for epithelial-mesenchymal transition and metastasis in a model of breast cancer progression. J Clin Invest. 2004 Aug;114(4):569–581.
- Taniguchi K, Karin M. NF-kappaB, inflammation, immunity and cancer: coming of age. Nat Rev Immunol. 2018 May;18(5):309–324.
- Lin L, Que R, Wang J, et al. Prognostic value of the ferroptosis-related gene SLC2A3 in gastric cancer and related immune mechanisms. Front Genet. 2022;13:919313.
- Wang Y, He M, Zhang G, et al. The immune landscape during the tumorigenesis of cervical cancer. Cancer Med. 2021 Apr;10(7):2380–2395.
- Kostic AD, Chun E, Robertson L, et al. Fusobacterium nucleatum potentiates intestinal tumorigenesis and modulates the tumor-immune microenvironment. Cell Host Microbe. 2013 Aug 14;14(2):207–215.
- Kim W, Chu TH, Nienhuser H, et al. PD-1 signaling promotes tumor-infiltrating myeloid-derived suppressor cells and gastric tumorigenesis in mice. Gastroenterology. 2021 Feb;160(3):781–796.
- Gentles AJ, Newman AM, Liu CL, et al. The prognostic landscape of genes and infiltrating immune cells across human cancers. Nat Med. 2015 Aug;21(8):938–945.
- Leemans CR, Snijders PJF, Brakenhoff RH. The molecular landscape of head and neck cancer. Nat Rev Cancer. 2018 May;18(5):269–282.
- Deng D, Sun P, Yan C, et al. Molecular basis of ligand recognition and transport by glucose transporters. Nature. 2015 Oct 15;526(7573):391–396.
- Dai W, Xu Y, Mo S, et al. GLUT3 induced by AMPK/CREB1 axis is key for withstanding energy stress and augments the efficacy of current colorectal cancer therapies. Signal transduction and targeted therapy. 2020 Sep 2;5(1):177. DOI:10.1038/s41392-020-00220-9.
- Schlosser HA, Drebber U, Urbanski A, et al. Glucose transporters 1, 3, 6, and 10 are expressed in gastric cancer and glucose transporter 3 is associated with UICC stage and survival. Gastric Cancer. 2017 Jan;20(1):83–91.
- Tsai TH, Yang CC, Kou TC, et al. Overexpression of GLUT3 promotes metastasis of triple-negative breast cancer by modulating the inflammatory tumor microenvironment. J Cell Physiol. 2021 Jun;236(6):4669–4680.
- Masin M, Vazquez J, Rossi S, et al. GLUT3 is induced during epithelial-mesenchymal transition and promotes tumor cell proliferation in non-small cell lung cancer. Cancer & Metabolism. 2014;2:11.
- Liang H, Bourdon AK, Chen LY, et al. Gibbs free-energy gradient along the path of glucose transport through human glucose transporter 3. ACS Chem Neurosci. 2018 Nov 21;9(11):2815–2823.
- Chen D, Wang H, Chen J, et al. MicroRNA-129-5p regulates glycolysis and cell proliferation by targeting the glucose transporter SLC2A3 in gastric cancer cells. Front Pharmacol. 2018;9:502.
- Martinez-Terroba E, Behrens C, de Miguel FJ, et al. A novel protein-based prognostic signature improves risk stratification to guide clinical management in early-stage lung adenocarcinoma patients. J Pathol. 2018 Aug;245(4):421–432.
- Younes M, Brown RW, Stephenson M, et al. Overexpression of Glut1 and Glut3 in stage I nonsmall cell lung carcinoma is associated with poor survival. Cancer. 1997 Sep 15;80(6):1046–1051.
- Zuo J, Wen J, Lei M, et al. Hypoxia promotes the invasion and metastasis of laryngeal cancer cells via EMT. Medical oncology. (Northwood, London, England): Medical Oncology; 2016. Feb; 33(2): p. 15.
- Baer S, Casaubon L, Schwartz MR, et al. Glut3 expression in biopsy specimens of laryngeal carcinoma is associated with poor survival. Laryngoscope. 2002 Feb;112(2):393–396.
- Nilchian A, Giotopoulou N, Sun W, et al. Different regulation of glut1 expression and glucose uptake during the induction and chronic stages of TGFβ1-induced EMT in breast cancer cells. Biomolecules. 2020 Dec 1;10(12):1621.
- Wang Y, Li Y, Jiang L, et al. Prognostic value of glycolysis markers in head and neck squamous cell carcinoma: a meta-analysis. Aging. 2021 Feb 26;13(5):7284–7299.
- Voelxen NF, Blatt S, Knopf P, et al. Comparative metabolic analysis in head and neck cancer and the normal gingiva. Clin Oral Investig. 2018 Mar;22(2):1033–1043.
- Botha H, Farah CS, Koo K, et al. The role of glucose transporters in oral squamous cell carcinoma. Biomolecules. 2021 Jul 21;11(8). doi :10.3390/biom11081070.
- Liu Y, Li YM, Tian RF, et al. The expression and significance of HIF-1alpha and GLUT-3 in glioma. Brain Res. 2009 Dec 22;1304:149–154.
- Koutsioumpa M, Hatziapostolou M, Polytarchou C, et al. Lysine methyltransferase 2D regulates pancreatic carcinogenesis through metabolic reprogramming. Gut. 2019 Jul;68(7):1271–1286.
- Ceballos J, Schwalfenberg M, Karageorgis G, et al. Synthesis of indomorphan pseudo-natural product inhibitors of glucose transporters GLUT-1 and -3. Angew Chem (Int Ed in English). 2019 Nov 18;58(47):17016–17025.
- Klip A, McGraw TE, James DE. Thirty sweet years of GLUT4. J Biol Chem. 2019 Jul 26;294(30):11369–11381.
- Matsuzu K, Segade F, Wong M, et al. Glucose transporters in the thyroid. Thyroid: Offic J Am Thyroid Association. 2005 Jun;15(6):545–550.
- Dasgupta S, Rai RC. PPAR-gamma and Akt regulate GLUT1 and GLUT3 surface localization during Mycobacterium tuberculosis infection. Mol Cell Biochem. 2018 Mar;440(1–2):127–138.
- Ni Y, Zhou Y, Zhou M, et al. Akt and cAMP response element binding protein mediate 17beta-estradiol regulation of glucose transporter 3 expression in human SH-SY5Y neuroblastoma cell line. Neurosci Lett. 2015 Sep 14;604:58–63.
- Onodera Y, Nam JM, Bissell MJ. Increased sugar uptake promotes oncogenesis via EPAC/RAP1 and O-GlcNAc pathways. J Clin Invest. 2014 Jan;124(1):367–384.
- Libby CJ, Gc S, Benavides GA, et al. A role for GLUT3 in glioblastoma cell invasion that is not recapitulated by GLUT1. Cell Adh Migr. 2021 Dec;15(1):101–115.
- Sullivan WJ, Mullen PJ, Schmid EW, et al. Extracellular matrix remodeling regulates glucose metabolism through TXNIP destabilization. Cell. 2018 Sep 20;175(1):117–132 e21.
- Gao H, Liang J, Duan J, et al. A prognosis marker SLC2A3 correlates with EMT and immune signature in colorectal cancer. Front Oncol. 2021;11:638099.
- Li H, Chen A, Yuan Q, et al. NF-kappaB/twist axis is involved in chysin inhibition of ovarian cancer stem cell features induced by co-treatment of TNF-alpha and TGF-beta. Int J Clin Exp Pathol. 2019;12(1):101–112.
- Li CW, Xia W, Huo L, et al. Epithelial-mesenchymal transition induced by TNF-alpha requires NF-kappaB-mediated transcriptional upregulation of Twist1. Cancer Res. 2012 Mar 1;72(5):1290–1300.
- Wu Y, Deng J, Rychahou PG, et al. Stabilization of snail by NF-kappaB is required for inflammation-induced cell migration and invasion. Cancer Cell. 2009 May 5;15(5):416–428.
- Chua HL, Bhat-Nakshatri P, Clare SE, et al. NF-kappaB represses E-cadherin expression and enhances epithelial to mesenchymal transition of mammary epithelial cells: potential involvement of ZEB-1 and ZEB-2. Oncogene. 2007 Feb 1;26(5):711–724.
- Tan L, Cheng D, Wen J, et al. Identification of prognostic hypoxia-related genes signature on the tumor microenvironment in esophageal cancer. Math Biosci Eng. 2021 Sep 7;18(6):7743–7758.
- Zhang L, Wang S, Wang Y, et al. Effects of hypoxia in intestinal tumors on immune cell behavior in the tumor microenvironment. Front Immunol. 2021;12:645320.
- He X, Ding J, Cheng X, et al. Hypoxia-related gene-based signature can evaluate the tumor immune microenvironment and predict the prognosis of colon adenocarcinoma patients. Int J Gen Med. 2021;14:9853–9862.
- Lauer V, Grampp S, Platt J, et al. Hypoxia drives glucose transporter 3 expression through hypoxia-inducible transcription factor (HIF)-mediated induction of the long noncoding RNA NICI. J Biol Chem. 2020 Mar 27;295(13):4065–4078.
- Han Y, Wang X, Xia K, et al. A novel defined hypoxia-related gene signature to predict the prognosis of oral squamous cell carcinoma. Ann Transl Med. 2021 Oct;9(20):1565.
- Xia H, Chen J, Gao H, et al. Hypoxia-induced modulation of glucose transporter expression impacts (18)F-fluorodeoxyglucose PET-CT imaging in hepatocellular carcinoma. Eur J Nucl Med Mol Imaging. 2020 Apr;47(4):787–797.
- Osumi H, Horiguchi H, Kadomatsu T, et al. Tumor cell-derived angiopoietin-like protein 2 establishes a preference for glycolytic metabolism in lung cancer cells. Cancer Sci. 2020 Apr;111(4):1241–1253.
- Lu W, Wu Y, Huang S, et al. A ferroptosis-related gene signature for predicting the prognosis and drug sensitivity of head and neck squamous cell carcinoma. Front Genet. 2021;12:755486.
- Wu B, Tao L, Yang D, et al. Development of an immune infiltration-related eight-gene prognostic signature in colorectal cancer microenvironment. Bio Med Res Int. 2020;2020:2719739.
- Caruntu A, Moraru L, Lupu M, et al. Prognostic potential of tumor-infiltrating immune cells in resectable oral squamous cell carcinoma. Cancers (Basel). 2021 May 8;13(9). doi :10.3390/cancers13092268.
- White LG, Goy HE, Rose AJ, et al. Controlling cell trafficking: addressing failures in CAR T and NK cell therapy of solid tumours. Cancers (Basel). 2022 Feb 15;14(4). doi :10.3390/cancers14040978.
- Nagarsheth N, Wicha MS, Zou W. Chemokines in the cancer microenvironment and their relevance in cancer immunotherapy. Nat Rev Immunol. 2017 Sep;17(9):559–572.