ABSTRACT
This paper examines the effect of outdoor air pollution on respiratory disease in Kanpur, India, based on data from 2006. Exposure to air pollution is represented by annual emissions of sulfur dioxide (SO2), particulate matter (PM), and nitrogen oxides (NOx) from 11 source categories, established as a geographic information system (GIS)-based emission inventory in 2 km × 2 km grid. Respiratory disease is represented by number of patients who visited specialist pulmonary hospital with symptoms of respiratory disease. The results showed that (1) the main sources of air pollution are industries, domestic fuel burning, and vehicles; (2) the emissions of PM per grid are strongly correlated to the emissions of SO2 and NOx; and (3) there is a strong correlation between visits to a hospital due to respiratory disease and emission strength in the area of residence. These results clearly indicate that appropriate health and environmental monitoring, actions to reduce emissions to air, and further studies that would allow assessing the development in health status are necessary.
[Supplementary materials are available for this article. Go to the publisher's online edition of Archives of Environmental & Occupational Health for material on emission of SO2, PM, NOx from various sources, and total number of inhabitants, total number of patients in grid squares covering the Kanpur city.]
It is well known that air pollution causes respiratory and cardiovascular diseases.Citation 1 – Citation 3 Economic development, urbanization, energy consumption, transportation, and rapid population growth are major driving forces of air pollution in large cities, especially in megacities.Citation 4 Air pollution levels in developed countries have been decreasing dramatically in recent decades. However, in other countries, air pollution levels are still relatively high, although the levels have been gradually decreasing or have remained stable despite rapid economic development.Citation 4 , Citation 5 In recent years, several hundred epidemiological studies, time-series studies in particular, have been conducted in developed countries, on short- and long-term effects of air pollution on human health covering different age groups, including children and young and old adults.Citation 6 – Citation 8 Research has shown that long-term exposure to air pollutants increases the risk of respiratory illnesses such as allergies, asthma, chronic obstructive pulmonary disease, and lung cancer.Citation 9 , Citation 10 Children and elderly persons are particularly vulnerable to health effects of ozone (O3), particulate matter (PM), and other airborne toxicants.Citation 11 , Citation 12 Hospital admissions have been recognized as a more sensitive marker than mortality for assessment of the air pollution effects on human health.Citation 13 , Citation 14 A literature review on outdoor air pollution and health in Asia identified over 400 studies of health effects of air pollution in 13 countries during the period 1980 to 2007.Citation 15 Over 80 time-series studies conducted in Asian cities also showed similar spectrum of adverse health effects from acute and chronic respiratory symptoms and changes in pulmonary function to increased mortality from cardiovascular or respiratory diseases or lung cancer, associated with exposure to PM, sulfur dioxide (SO2), nitrogen dioxide (NO2) and O3, to those explored in Europe and North America.Citation 15 – Citation 17
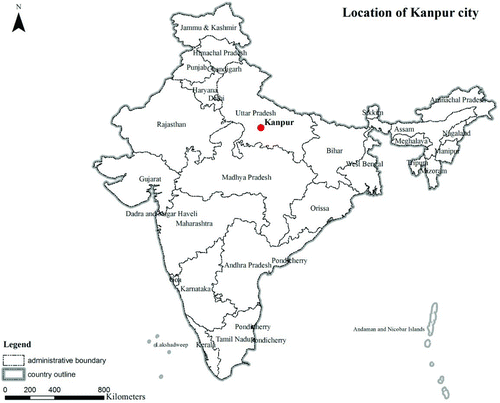
Fig. 1 Location of Kanpur city in India (color figure available online).
Air pollution poses a global challenge, as adverse effects still exist even at relatively low air pollutant concentrations, and there may not be any safe or threshold pollution levels. The air pollution problem is more severe in Asian countries due to high pollution levels and high population densities.Citation 4 , Citation 15 – Citation 17 Important gaps still remain, as the studies do not necessarily cover enough variations in urban settlements, pollution levels, and economic conditions.Citation 15
Many of the Indian cities are highly polluted and available mortality and morbidity statistics indicate that respiratory infections and chronic conditions are widespread.Citation 18 – Citation 24 However, there are very few Indian studies that link air pollution exposure to lung function deterioration, underlining the need for systematic studies.Citation 21
We carried out a pilot study to examine the correlation between outdoor air pollution (represented as annual emissions) and hospital visits due to respiratory disease in Kanpur (latitude 26°45′ north and longitude 80°15′ east; ), one of the most populous (4 million persons), industrialized, and polluted cities in India.Citation 18 , Citation 22 , Citation 25
Pollution loads/emissions were estimated for SO2, PM, and nitrogen oxides (NOx), whereas respiratory diseases were estimated from total number of registered respiratory patients visits to the largest chest and tuberculosis hospital (Lala Lajpat Rai [LLR] Hospital) in Kanpur, Uttar Pradesh, India.Citation 22 , Citation 26 This hospital receives patients from the whole district.
The broad objective of this study was to develop a methodology for air pollution health impact assessment, and to apply this approach in the city of Kanpur. The specific objective was to assess population-wide health effects of air pollution. This study lays a basis for further environmental health assessments, and provides rationale for improved air quality monitoring as well as mitigation measures.
METHODS
Data collection
Sampling Grids for Emission Assessment
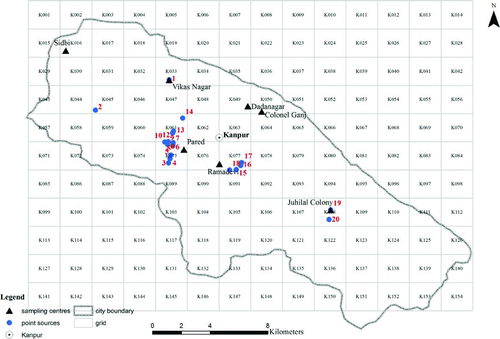
The entire 28 km × 22 km area including the city was divided into 154 grids of equal size of 2 km × 2 km. Coordinates of the center point in each grid were recorded by the Global Positioning System (GPS) in Universal Transverse Mercator (UTM) system. The other recorded items include the grid number and land use type. Seven key grids inside the city (), having varied land use types, were studied in detail by conducting house to house surveys of each polluting activity in the grid ().
Table 1 Overview of Grid Squares for Detailed Emission Survey
Fig. 2 Grid position over Kanpur, with the 7 grid squares with detailed emission survey (solid black triangle; ), and industries’ point sources () (color figure available online).
Pollution Sources
Pollution sources taken into account in the emission inventory include vehicles, domestic fuel burning, garbage burning, restaurants, diesel generators sets, medical-waste incinerators, funeral pyre burning, industries with stack height lower than 25 m (area sources), industries with stack height higher than 25 m (point sources), soil-road dust, construction and demolition recycling (Supplement Files 1–3). For point sources, the recorded items include the point sources number, grid number, industry name, production capacity (t/day), fuel consumption (t/day, fuel type), stack height (m), and latitude and longitude (, ).
Table 2 Overview of Industrial
Emissions as Surrogate Measure of Exposure
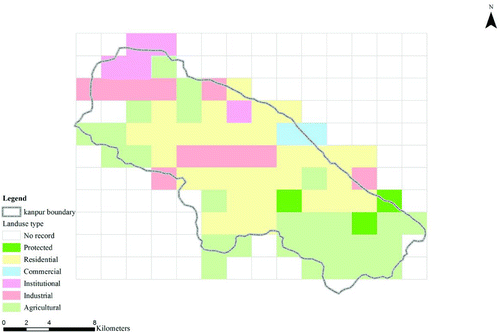
Each of the 154 grids was assigned a land use type based on the landscape map from the Central Pollution Control Board (CPCB), Delhi, India. Six land use types were identified (ie, agricultural, commercial, industrial, institutional, protected, and residential) in the entire city (). Based on the activity data of 7 grids with different land use, and 20 industries point pollution sources in detail (see Pollution Sources), the emissions in the other grids were obtained by mapping the 7 grids to the land use types of the other grids and by accounting for road length, number of vehicles on the road, and population in the grid. Emissions were estimated for PM, SO2, and NOx (for details of emission inventory, see Supplement Files 1, 2, 3).Citation 26
Fig. 3 Grid squares and land use types (color figure available online).
In Kanpur, several monitoring stations are in place, operated by state and central authorities. Their placement is appropriate for air quality assessment, but not for estimating exposure. They offer daily time series, but do not capture the variability of the outdoor pollution field. For this reason, the study team decided to use the emission estimates as a surrogate measure of exposure. In this way, the time resolution is lost, but we gain exposure gradients within the city, which seems appropriate in relation to the nature of the other information in this study.
Health Data
Health data were collected from the LLR Hospital records. The data include grid number (representing residence of patients, Supplement File 4), age, sex, smoking status, occupation, respiratory symptoms, and resident location/street name. The data on 8,557 patients who visited the hospital at least once were collected for the period of January 10 to December 29, 2006. Quality assurance procedure required 2 physicians recording the data from journals to electronic form, and periodic double entries of portion of the data. The data entry resulted in 8,340 valid records. Of these, 3,948 had identified the domicile (home address). The large number of symptoms on the medical record was classified into 12 categories ().
Table 3 Respiratory Disease Symptom Categories and Total Number of Patients Diagnosed in Each Category
Data analysis
The analysis aimed to relate the data on hospital visits to exposure index represented by the emissions. There are 3 emission parameters, and we first investigated their variability and dependencies (see Emission Clusters). Then, we investigated the relationship between the emissions and the hospital visits (see Correlation Between Air Pollution and Respiratory Disease), and we attempted to analyze the relationship between emissions and respiratory symptoms (see Analysis of Occurrence for a Respiratory Disease Symptom). Finally, we have investigated the temporal pattern of the hospital visits (see Analysis of Seasonal Differences). R version 2.7.1,Citation 27 – Citation 29 packages “cluster” and “rgl”Citation 30 and clustering functions “kmeans” and “pam,” were used for data analysis. ArcGIS 9.0 (ESRI, Redlands, CA, USA) was used for all data creation and map illustration.
A cluster analysisCitation 31 was conducted on the 3-dimensional emission data (SO2, NOx, PM) for each grid. The aim of this analysis is to group grids into certain number of clusters based on the level of air pollution load in the grids. We included emission data from all the pollution sources (see Pollution Sources), disregarding the point source from stacks higher than 25 m that are likely to influence larger area than the immediate grid. This step allowed us to conduct the analysis using statistical methods without incorporation of spatial dependence or autocorrelation, only using classical logistic regression model. We disregard also the observations in grids for which “land use” type is “protected.” For clustering, we used R functions “kmeans” and “pam” (a robust version of “kmeans”) from package “cluster.” Within groups, “sum of squares” and “average silhouette plots” were used to determine the optimal number of clusters.
The relative number of hospital visits due to respiratory disease/symptoms was compared between the 4 clusters. In this analysis, the total number of inhabitants in each cluster was taken into account. The Pearson's chi-square testCitation 32 for independence in the contingency table of number of respiratory patients and number of inhabitants who did not visit the hospital was conducted. Furthermore, we used a logistic regressionCitation 33–35 to model an occurrence of a patient visit in LLR Hospital in relation to the cluster to which the home grid square belongs. The people who did not visit the hospital are the control group.
Further, the effect of time of the year on hospital visit occurrence was assessed. The Pearson's chi-square test for independence in the contingency table of number of patients in each of 12 months classified by the cluster was performed (Table 7). The Wilcoxon 2-sample testCitation 36 was conducted to assess differences between winter and summer seasons.
RESULTS AND COMMENT
Emission sources
The emission inventory estimates (total annual emissions of SO2, NOx, and PM expressed as t [ton] or kg [kilogram] per day) showed that the main sources for outdoor air pollution are industries (37,147 kg/day), domestic fuel burning (8,455 kg/day), and vehicles (8,172 kg/day) (Supplementary Files 1, 2, 3).
Of total 7.6 t/day SO2 emissions, industrial sources accounted for nearly 50% of total emission and the remaining 50% is attributed to other sources such as domestic fuel burning, vehicles, etc. (Supplementary File 1).
PM emissions accounted for 7.0 t/day. Forty-five percent of these emissions are attributed to domestic fuel burning. This source is followed by vehicles (20%), soil-road dust (18%), garbage burning (8%), and others (9%) (Supplementary File 2).
A total NOx emission load of 19 t/day has been estimated within the city. The breakdown of emissions is as follows: industrial point sources (43%), vehicles (33%), domestic fuel burning (11%), industry area source (6%), diesel generator set (6%), and others (1%) (Supplementary File 3).
SO2, NOx, and PM emissions in grids are highly correlated as an artifact of the methodology, due to the fact that all 3 pollutants are emitted from most of the sources, and because each grid, even if classified into one land use type, usually has a mix of sources (). From and 5, we can see that the values of SO2 and NOx are much higher in the industrial regions than in the institutional regions.
Fig. 4 Correlation between NOx and SO2 for land use types (unit: kg/day/grid) (color figure available online).
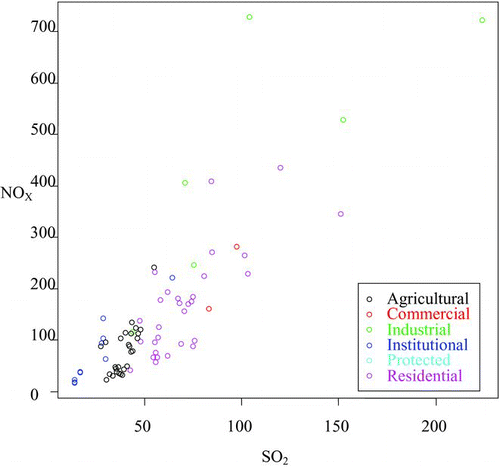
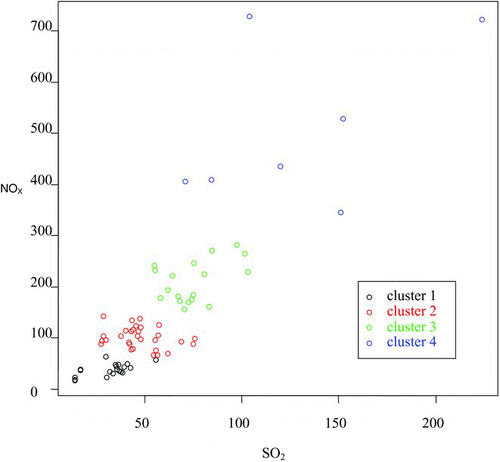
Fig. 5 Correlation between NOx and SO2 in emission clusters (unit: kg/day/grid) (color figure available online).
Emission clusters
The cluster analysis showed that the optimal number of clusters is either 2 or 4. For more exposure resolution, we chose to use 4 clusters. provides emission levels for each variable of SO2, PM, and NOx within each of the 4 clusters. From Figure 5, we can see that the values of SO2 and NOx are much higher in the cluster 4 than in other clusters. Of the 154 grid cells, 78 that lie within the city limits were classified into 4 distinct pollution groups (ie, cluster) are seen in .
Table 4 Emission of SO2, PM, and NOx in Each Emission Cluster
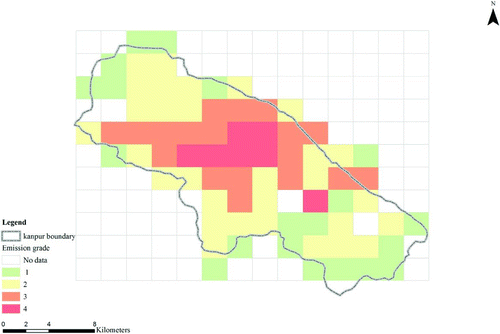
Fig. 6 Grid squares with indicated emission clusters (1 = less polluted, 2 = polluted, 3 = highly polluted, 4 = very highly polluted; refer to ) (color figure available online).
Health assessment
Total Population in Each Emission Cluster
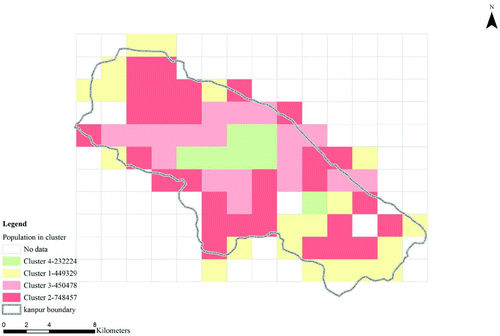
The spatial variation of number of inhabitants in each cluster is shown in . Population is slightly lower in the very highly polluted regions (eg, a total of 232,224 people live in the regions within emission cluster 4). The highest number of inhabitants (748,457) lives in moderately highly polluted areas (ie, cluster 2; ).
Fig. 7 Total number of inhabitants in each level of emissions (1 = less polluted, 2 = polluted, 3 = highly polluted, 4 = very highly polluted) (color figure available online).
Correlation Between Air Pollution and Respiratory Disease
In each level of emissions, the total populations, the total number of people that have visited hospital, and the total number of people that have not visited the hospital are incorporated into this analysis ().
Table 5 Total Number of Inhabitants in Each Cluster Who Visited the LLR Hospital and the Total Number of the Control Group (see Data Analysis)
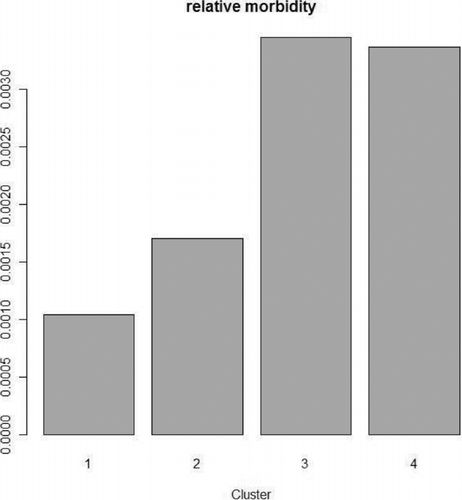
Pearson's chi-square test (df = 3, chi-square = 835.52, p < .0001) showed that the relative number of patients who visited the hospital per number of inhabitants in each cluster is much higher in the highly polluted regions (clusters 3 and 4; , 9) than in the less polluted regions (cluster 1); the ratio in the polluted cluster 3 and 4 is higher than 0.003 ().
Fig. 8 The ratio of number of inhabitants who visited the LLR Hospital with respiratory symptoms to the total number of inhabitants (“relative morbidity”) in the emission clusters (y-axis, relative morbidity).
To see to what extent the type of analysis affects the results, we have also used a logistic regression to model visits to the respiratory hospital in relation to the level of emissions. Cluster inhabitants not having visited the hospital represented the control group. The results were consistent: independent of the cluster variable type (eg, nominal, ordinal, or quantitative), the level of emission significantly affects the probability of visit to the hospital on any reasonable level (p < .0001; ).
Table 6 Summary Results From Testing the Effect of Emission Classification Method (Quantitative, Ordinal, and Nominal Values for Exposure) on the Resulting Relationship With Hospital Visits Using Logistic Regression
The 95% simultaneous confidence interval (CI) (“family-wise”) for the difference of effect on hospital visits between all the pairs of emission clusters indicated that this probability significantly differs between each pair of emission clusters (pairwise Pearson's chi-square test, p < .001), except between the highly polluted cluster 3 and very highly polluted cluster 4 (; Pearson's chi-square test, p = .59). There is no discernible difference in effect between emission levels of clusters 3 and 4; it can be attributed to a saturation effect that beyond a certain pollution level, there is no significant increase in the probability to visit to the hospital.Citation 37 – Citation 39
Fig. 9 Difference of effect on total symptom morbidity between each pairs of emission clusters (y-axis, each pair of emissions).
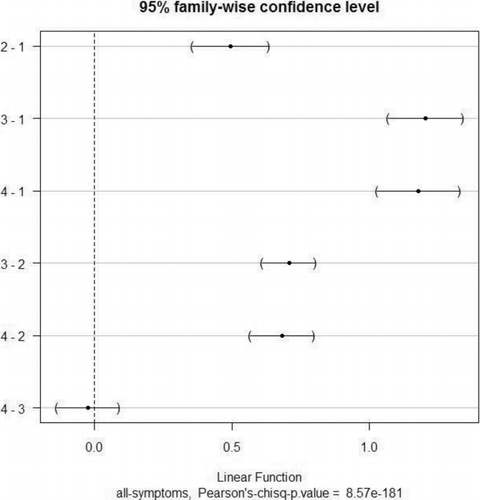
provides further quantification of the above. It provides odds ratios (the value by which the relative risk of having respiratory disease is multiplied when we changed from one emission level to another), and 95% CIs of odds ratios. For instance, comparing emission clusters 1 (less polluted) and 3 (highly polluted), in the grids where the average pollution of SO2 increases from 36.08 to 62.19 kg/day/grid, PM from 44.57 to 134.76 kg/day/grid, and NOx from 39.00 to 194.15 kg/day/grid (), the relative risk of increasing respiratory diseases of the inhabitants is higher than 3.33 (95% CI: 2.91, 3.81)) (), which is a very high increase. This indicates that the respiratory disease morbidity is much higher in the highly polluted regions. This is consistent with findings that the levels of air pollution make a significant contribution to the variation in daily hospital administration for respiratory disease.Citation 1 , Citation 2 , Citation 3 , Citation 39 , Citation 40
Table 7 Odds Ratios Quantifying Increased Risk of Visiting the LLR Hospital Between the Emission Clusters
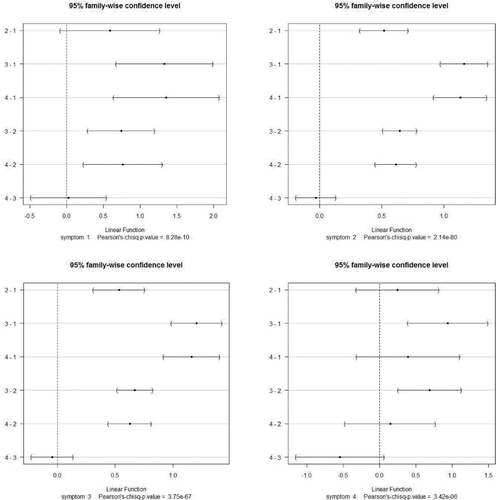
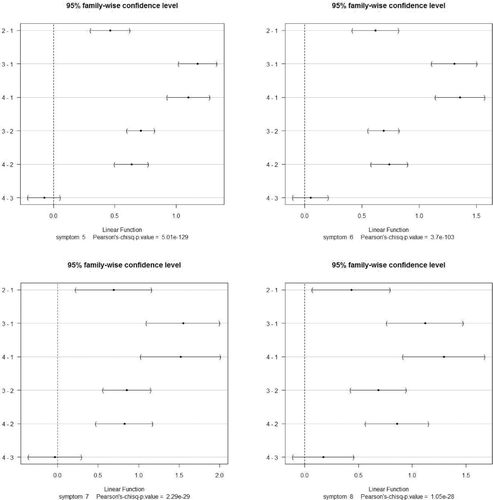
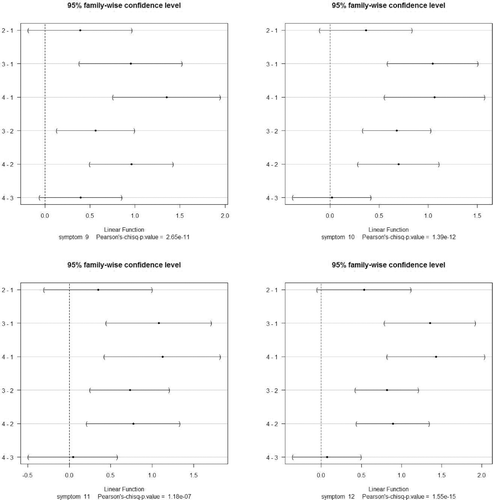
Similarly, by analyzing separately the individual groups of respiratory symptoms, we got the same result that emission levels 1 and 3 differ significantly for all symptoms, and there is no difference between emission levels 3 and 4 for any of the respiratory symptoms ().
Analysis of Seasonal Differences
The aim of this analysis is to assess the effect of a certain time period (ie, months and seasons) on the distribution of relative number of inhabitants that visit hospital on each level of emissions, or an effect of each level of emissions on the distribution during the year. To avoid multiple testing problem and to clearly state what hypothesis we test, we chose month as time period (because this period could be appropriate, not too short or not too long, to capture seasonal effect on morbidity). We performed Pearson's chi-square test for independence in the hospital visits () and obtained a p value of .29. Thus, there is not strong enough evidence to claim that the distribution of morbidity in the different emission levels depends on a certain month or that the distribution of morbidity during the year depends on a certain emission level. presents total number of inhabitants who visited the LLR hospital in each month with residence in each of the emission clusters.
Another question we can ask is: Does the morbidity change during the year regardless of the emission level? presents the number of patients for each month without considering the emission level. We divided 12 months into 2 samples. The first sample consists of the summer months (April to September) and the second sample consists of the remaining winter months. The Wilcoxon 2-sample test was conducted, with the result (p = .015) showing that there is a significant difference for respiratory disease morbidity between summer and winter months. It remains, however, not clear what seasonal factors affect the hospital visits (eg, extreme weather conditions in summer months, high pollution load in winter months), or if the hospital visits are mainly related to specific respiratory symptoms.
Table 8 Total Number of Inhabitants Who Visited the LLR Hospital in Each Month, With Residence in Each of the Emissions Cluster (for Patients With Identified Address in the Urban Area—78 Clusters)
Table 9 Total Number of Patients in Each Month
Fig. 10 Difference of effect on individual symptom morbidity between each pairs of emission clusters (for each classified symptom, see ) (y-axis, each pair of emissions).
Analysis of Occurrence for a Respiratory Disease Symptom
A logistic regression model with the occurrence of the symptom as the response and the variables cluster, sex, and age as the regressors showed that only the symptoms 4 (common cold), 5 (cough), and 6 (fever) are significantly impacted by the emission level. Common cold and cough are less frequent in the higher polluted regions, whereas fever occurs more likely in the higher polluted regions. However, symptom recording and classification is perhaps the part of the retrospective data collection that is most subjective and thus least rigorous, and this may affect the result.
Conclusions and recommendations
The main sources for outdoor air pollution in Kanpur are industries, domestic fuel burning, and vehicles. An emission inventory for the urban area was established, and local emissions in the 2 km × 2 km grid square representing the home address of Kanpur inhabitants were used as a surrogate measure of exposure to outdoor air pollution.
There is clear evidence that outdoor air pollution is associated with cardiopulmonary diseases. We did not investigate the effects on cardiovascular disease in this study, but we have shown that people living in the more polluted regions had a higher risk of hospital visits related to respiratory diseases than those living in the less polluted areas. This phenomenon is in accordance with other study results.Citation 38 , Citation 40 – Citation 45
Our study has several limitations. The exposure is represented by emission category (cluster) for each individual home. This has both advantages (being a more robust method), and disadvantages; it forces the analysis into a cross-sectional mode, considering a cumulative or long-term effect of pollution on respiratory health.Citation 46 The retrospective data collection, especially to record respiratory symptoms, poses also some difficulties.
Our study could not consider time lags between air pollution and the occurrence of respiratory disease morbidityCitation 47 , Citation 48 due to a lack of temporal data on air pollution. Despite these shortcomings, we did show a clear relationship between pollution and respiratory disease. Clearly, more information is available in the data than we have used in this analysis, but we feel that our result is robust, and should be sufficient to trigger further work. In the future, this analysis can be supplemented by adding daily variability in pollution concentrations, allowing an analysis of short-term effects.
All the findings from this study suggest that long-term, systematic, prospective epidemiological studies on exposure to air pollution and its respiratory health effects are needed.Citation 49
This paper indicates that the polluted air was a clear threat to human health in Kanpur in 2006. This situation is alarming. Mitigation will require a combination of technical measures on all sources (this study was conducted before the massive conversion of the public transport to compressed natural gas) and urban planning. Also, it is necessary to establish adequate monitoring systems both for air quality and for human health, to be able to assess the trends, and the effectiveness of measures taken.
Supplement files.zip
Download Zip (140.1 KB)Acknowledgments
This study has been carried out under the project “Environmental Health Assessment: Respiratory Disease in relation to Air Pollution in Kanpur, Uttar Pradesh,” which was an 18-month cooperation project between the Indian Institute of Technology Kanpur (IITK), Ganesh Shankar Vidyarthi Memorial (GSVM) Medical College in Kanpur, State Pollution Control Board (SPCB) in Kanpur, and Norwegian Institute for Air Research (NILU), funded under Royal Norwegian Embassy New Delhi grant (IND 3025 05/051). In addition to the partners funded by this grant, the Central Pollution Control Board, Agra, participated in the project's intercomparison exercises and preparation of standard operating procedures (SOPs).
The authors would like to thank a number of colleagues for their invaluable contribution. The staff at the laboratory at CPCB and the students and staff at the IITK have been instrumental in all logistics and technical preparation, quality control, as well as monitoring activities. The authors would like to thank the station managers who diligently supported their efforts. The authors thank especially Mike J. Kobernus and Sonja Grossberndt at NILU for help with the language.
©Hai-Ying Liu, Alena Bartonova, Martin Schindler, Mukesh Sharma, Sailesh N. Behera, Kamlesh Katiyar, and Onkar Dikshit
References
- Pope , C A III , Thun , M J Namboodiri , M M . 1995 . Particulate air pollution as a predictor of mortality in a prospective study of U.S. Adults. . Am J Respir Crit Care Med , 151 : 669 – 674 .
- Xu , X , Li , B and Huang , H . 1995 . Air pollution and unscheduled hospital outpatient and emergency room visits . Environ Health Perspect , 103 : 286 – 289 .
- Brook , R D , Rajagopalan , S Pope , C A III . 2010 . Particulate matter air pollution and cardiovascular disease: an update to the scientific statement from the American Heart Association . Circulation , 121 : 2331 – 2378 .
- Chen , B and Kan , H . 2008 . Air pollution and population health: a global challenge . Environ Health Prevent Med , 13 : 94 – 101 .
- Sivertsen , B. “ Global ambient air pollution concentrations, trends ” . In Air Quality Guidelines, Global Update 2005 , Vol. 2006 , 31 – 59 . Copenhagen , , Denmark : World Health Organization, WHO Regional Office for Europe .
- Medina , S , Le Tertre , A , Saklad , M and Apheis Collaborative Network . 2009 . The Apheis project: Air Pollution and Health–A European Information System . Air Qual Atmos Health , 2 : 185 – 198 .
- Stieb , D M , Judek , S and Burnett , R T . 2002 . Meta-analysis of time-series studies of air pollution and mortality: effects of gases and particles and the influence of cause of death, age, and season . J Air Waste Manage Assoc , 52 : 470 – 484 .
- Katsouyanni , K , Touloumi , G Samoli , E . 2001 . Confounding and effect modification in the short-term effects of ambient particles on total mortality: results from 29 European cities within the APHEA2 project . Epidemiology , 12 : 521 – 531 .
- Arbex , M A , de Souza Conceic , G M Cendon , S P . 2009 . Urban air pollution and chronic obstructive pulmonary disease-related emergency department visits . J Epidemiol Community Health , 63 : 777 – 783 .
- Tramuto , F , Cusimano , R Cerame , G . 2011 . Urban air pollution and emergency room admissions for respiratory symptoms: a case-crossover study in Palermo, Italy . Environ Health , 10 : 1 – 11 .
- Miller , K A , Siscovick , D S Sheppard , L . 2007 . Long-term exposure to air pollution and incidence of cardiovascular events in women . N Engl J Med , 356 : 447 – 458 .
- Andersen , Z J , Hvidberg , M Jensen , S S . 2011 . Chronic obstructive pulmonary disease and long-term exposure to traffic-related air pollution: a cohort study . Am J Respir Crit Care Med , 183 : 455 – 461 .
- Wong , C M , Atkinson , R W Anderson , H R . 2002 . A tale of two cities: effects of air pollution on hospital admissions in Hong Kong and London compared . Environ Health Perspect , 110 : 67 – 77 .
- Hwang , J S and Chan , C C . 2002 . Effects of air pollution on daily clinic visits for lower respiratory tract illness . Am J Epidemiol , 155 : 1 – 10 .
- Health Effects Institute (HEI) . 2010 . Health Effects of Outdoor Air Pollution in Developing Countries of Asia: A Comprehensive Review , Boston : Health Effects Institute . . Report number 18.
- Wong , C-M , Vichit-Vadakan , N , Kan , H , Qian , Z and the PAPA Project Teams . 2008 . Public Health and Air Pollution in Asia (PAPA): a multicity study of short-term effects of air pollution on mortality . Environ Health Perspect , 16 : 1195 – 1202 .
- Chung , K F , Zhang , J and Zhong , N . 2011 . Outdoor air pollution and respiratory health in Asia . Respirology , 16 : 1023 – 1026 .
- Sharma , M and Maloo , S . 2005 . Assessment and characterization of ambient air PM10 and PM2.5 in the City of Kanpur, India . Atmos. Environ. , 39 : 6015 – 6026 .
- Sharma , M , Narendra , K V , Katiyar , S K , Sharma , R , Shukla , B P and Sengupta , B . 2004 . Effects of particulate air pollution on the respiratory health of subjects who live in three areas in Kanpur, India . Arch Environ Health , 59 : 348 – 358 .
- Kumar , R , Sharma , M , Srivastva , A , Thakur , J S , Jindal , S K and Parwana , H K . 2004 . Association of outdoor air pollution with chronic respiratory morbidity in an industrial town in northern India . Arch Environ Health , 59 : 471 – 477 .
- Nath , KJ. 2000 . “ Environmental health monitoring and management action plan ” . In Environmental Epidemiology in the South-East Asia Region—Report of a Regional Training , 7 – 8 . New Delhi , , India : World Health Organization . WHO Regional Office for South-East Asia
- Bartonova , A and Sharma , M . 2005 . Indoor and Ambient Air Exposure of PAHs and Fine Particulate to Women and Children: Health Impacts in terms of Morbidity , Kjeller , , Norway : Norwegian Institute for Air Research .
- Kumar , R , Nagar , J K Kumar , H . 2007 . Association of Indoor and outdoor air pollutant level with respiratory problems among children in an industrial area of Delhi, India . Arch Environ Occup Health , 62 : 75 – 80 .
- Rosati , J A , Yoneda , K Y , Yasmeen , S , Wood , S and Eldridge , M W . 2005 . Respiratory health and indoor air pollution at high elevation . Arch Environ Occup Health , 60 : 96 – 105 .
- Singh , R P . 2001 . Effect of wastewater disposal and extent of industrial pollution in and around Kanpur, Uttar Pradesh, India . Bull Eng Geol Environ , 60 : 31 – 35 .
- Sharma , M. 2010 . Air Quality Assessment, Emissions Inventory and Source Apportionment Studies for Kanpur City , New Delhi , , India : Central Pollution Control Board .
- Anonymous . R version 2.7.1 for Windows. The Comprehensive R Archive Network Web site . Available at: http://cran.r-project.org/bin/windows/base/old/2.7.1/.Updated June 23, 2008. Accessed October 7, 2004
- Anonymous . R: a language and environment for statistical computing. Mendeley Web site . Available at: http://www.mendeley.com/research/r-a-language-and-environment-for-statistical-computing-2/. Accessed October 7, 2008
- Oksanen , J , Kindt , R , Legendre , P , O’Hara , B , Henry , M and Stevens , H . The vegan package. University of Murcia Web site . Available at: http://ocw.um.es/ciencias/geobotanica/otros-recursos-1/documentos/vegan.pdf. Accessed February 16, 2008
- Kirk , R E . 1995 . Experimental Design: Procedures for the Behavioral Sciences. , 3rd ed , Pacific Grove , CA : Brooks/Cole Publishing Company .
- Oksanen , J. “ Cluster analysis: tutorial with R ” . University of Oulu Web site . Available at: http://cc.oulu.fi/~jarioksa/opetus/metodi/sessio3.pdf. Accessed March 6, 2012
- Greenwood , P E and Nikulin , M S . 1996 . A Guide to Chi-Squared Testing , New York : Wiley .
- Manning , C . “ Logistic regression (with R) ” . The Stanford University Web site . Available at: http://nlp.stanford.edu/~manning/courses/ling289/logistic.pdf. Accessed March 6, 2012
- Lemeshow , S and Hosmer , D W . 1989 . Applied Logistic Regression. , 2nd ed , New York : Wiley .
- Kleinbaum , D G . 1994 . Logistic Regression: A Self-Learning Text. , 2nd ed , New York : Springer .
- Anonymous . “ Wilcoxon rank sum and signed rank tests ” . Seminar for Statistics Web site . Available at: http://stat.ethz.ch/R-manual/R-patched/library/stats/html/wilcox.test.html. Accessed March 6, 2012
- Petroeschevsky , A , Simpson , R W , Thalib , L, and Rutherford , S . 2001 . Association between outdoor air pollution and hospital administrations in Brisbane, Australia . Arch Environ Health , 56 : 37 – 52 .
- Patel , S , Nellore , M RR , Sadhu , H G , Kulkarni , P K , Patel , B D and Parikh , D J . 2008 . Effects of Industrial pollution on respiratory morbidity among female residents of India . Arch Environ Occup Health , 63 : 87 – 92 .
- Sunil , K , Chhabra , S K , Pragti Chhabra , P and Gupta , R K . 2010 . Ambient air pollution and chronic respiratory morbidity in Delhi . Arch Environ Health , 56 : 58 – 64 .
- Segala , C . 1999 . Health effects of urban outdoor air pollution in children . Pediatr Pulmonol (Suppl) , 27 : 6 – 8 .
- Sagar , A , Bhattacharya , M and Joon , V . 2007 . A comparative study of air pollution-related morbidity among exposed population of Delhi . Indian J Community Med , 32 : 10 – 12 .
- Nawrot , T S , Alfaro-Moreno , E and Nemery , B . 2008 . Update in occupational and environmental respiratory disease 2007 . Am J Respir Crit Care Med , 177 : 696 – 700 .
- Mansourian , M , Javanmard , S H , Poursafa , P and Kelishadi , R . 2010 . Air pollution and hospitalization for respiratory diseases among children in Isfahan, Iran . Ghana Med J , 44 : 138 – 143 .
- Chen , H and Goldberg , M S . 2009 . The effects of outdoor air pollution on chronic illnesses . McGill J Med , 12 : 58 – 64 .
- Forbes , LJL , Patel , MD , Alicja , R Rudnicka , AR . 2009 . Chronic exposure to outdoor air pollution and diagnosed cardiovascular disease: meta-analyis of three large cross-sectional surveys . : 8 – 30 . Environ Health
- Brauer , M . 2010 . How much, how long, what, and where–air pollution exposure assessment for epidemiologic studies of respiratory disease . Proc Am Thorac Soc , 7 : 111 – 115 .
- Kalantzi , E G , Makris , D , Duquenne , M N , Kaklamani , S , Stapountzis , H and Gourgoulianis , K I . 2011 . Air pollutants and morbidity of cardiopulmonary diseases in a semi-urban Greek peninsula . Atmos Environ , 45 : 7121 – 7126 .
- Ignotti , E , Hacon , S DS Junger , W L . 2010 . Air pollution and hospital admissions for respiratory diseases in the subequatorial Amazon: a time series approach . Cadernos Saúde Pública , 26 : 747 – 761 .
- Öry , F G , Rahman , F U , Katagade , V , Shukla , A and Burdorf , A . 1997 . Respiratory disorders, skin complaints, and low-back trouble among tannery workers in Kanpur, India . Am Ind Hyg Assoc J. , 58 : 740 – 746 .