
Abstract
Many educational interventions seek to change teachers’ instructional practice. Standards-based observation systems are a common and useful tool to understand these interventions’ impact, but the process of measuring instructional change with observation systems is highly complex. This paper introduces a framework for examining and understanding potential instrumentation biases that arise when evaluations use observation systems to understand instructional change. The framework systematizes two processes that all studies must undertake: (1) the process of operationalizing the construct of teaching quality, and (2) the process of data collection. A study that engages in these processes generates observation scores that capture their own raters’ perspectives on specific segments of instruction. These scores must be generalized to draw conclusions about the intended constructs and settings. Systematizing these two processes highlights the necessary steps of a validity argument supporting evaluation conclusions and the instrumentation biases that threaten such conclusions. The framework is illustrated with an example from our recent work, which sought to understand instructional change since the adoption of the Common Core State Standards (CCSS).
Educational interventions often focus on changing instructional practice (Gallimore & Santagata, Citation2006). Directly measuring shifts in instructional practice is important for understanding the impacts of such interventions, as this highlights impacts that are not captured by shifts in test scores or other more distal outcomes. While many tools exist to examine shifts in instructional practice across time (e.g., student surveys; instructional logs), observation systems are an increasingly important and popular tool for this purpose (Bell et al., Citation2018). Observation systems are used as the primary outcome for interventions (e.g., Barnett et al., Citation2006; Boston, Citation2012; Brown et al., Citation2010; Cappella et al., Citation2012; Gore et al., Citation2017; Rivers et al., Citation2013; Steinberg & Sartain, Citation2015), as mediators to explain intervention impacts (e.g., McCormick et al., Citation2015; Reyes et al., Citation2012), as a component of coaching or training interventions (e.g., Cohen et al., Citation2016; Gregory et al., Citation2014; Hamre et al., Citation2012, Citation2014; Kraft & Hill, Citation2020), and as a tool for tracking fidelity of implementation (e.g., Thierry et al., Citation2020; Tong et al., Citation2019).
Observation systems consist of a rubric, which decomposes a theory of teaching quality into observable behaviors across a set of dimensions, and a series of mechanisms designed to help users (e.g., coaches, researchers, evaluators) apply the rubric to measure the quality of enacted instruction (e.g., trainings, video exemplars of specific practices; rules for sampling days; Bell et al., Citation2018). These systems are both fairly easy to adopt/use and offer the promise of validly measuring the specific, proximal changes in instruction, clarifying how interventions impact teaching.
However, the complexity of observation systems as a measurement tool creates many possibilities for instrumentation biases when drawing conclusions about program effects. Instrumentation bias is bias resulting from changes to the ways that an instrument functions across conditions (e.g., from pretest to post-test or between control and intervention conditions; Shadish et al., Citation2002). For example, a number of interventions are being designed around using observation systems to improve teaching, measuring shifts in teaching quality using the same observation system (e.g., Cohen et al., Citation2016; Gore et al., Citation2017; Gregory et al., Citation2014; Kraft & Hill, Citation2020). This risks over-alignment of intervention and outcome (c.f. Slavin & Madden, Citation2011). Namely, measured changes in the instrument being used do not correspond to broader changes in the construct the study intended to measure (Pianta et al., Citation2014). Said differently, the alignment of intervention and measurement instrument shifts the nature of what the measurement instrument captures.
Consider another possible instrumentation bias. In an experimental study of RULER, a social-emotional learning program (Rivers et al., Citation2013), the concern arose that there might be more RULER-specific lessons videotaped than would be expected based on the frequency of such lessons. This could indicate bias in the sampling of post-intervention lessons in the treatment group, making those lessons less representative of the average teaching in a classroom. If intervention-specific lessons tended to receive higher observation scores, this would positively bias estimates of changes in average teaching quality. As we highlight below, this threat could impact any study seeking to examine shifts in average teaching quality when the intervention studied includes intervention-specific practices that are relatively infrequently enacted (e.g., Brown et al., Citation2010; Cappella et al., Citation2012; McCormick et al., Citation2015). These and other challenges arise from the complexity of using observation systems to understand shifts in teaching quality. Importantly, typical experimental controls such as randomization will not protect against such instrumentation biases (Shadish et al., Citation2002).
This paper presents a framework to help researchers address potential instrumentation biases in the design, implementation, and analysis of evaluation efforts when using observation systems. In doing so, we break down two separate processes that can bias conclusions about an intervention’s effect. The first is the process of operationalizing teaching quality. The second is the process of sampling the segments of instruction to score from teachers’ overall instructional practice. Both of these processes involve a number of complex steps which could potentially bias the conclusions that researchers hope to draw about an intervention’s impact. While the focus is on standards-based observation systems, the framework should be more broadly applicable to efforts to understand instructional practice.
This paper is organized as follows. The next section introduces a framework for thinking about challenges when using observation systems to understand instructional interventions. The following section introduces a case study and applies this framework to it, illustrating how to draw valid conclusions in complex circumstances. We close with a discussion focusing on instrumentation as a threat to causal inference when using observation systems.
Framework for Using Observation Systems to Measure Instructional Change
Our conceptual framework focuses on instrumentation threats to the internal validity of conclusions. Internal validity discussions often focus on the role of randomization, but there are also less commonly studied threats to the internal validity of conclusions that randomization cannot solve, including instrumentation (Shadish et al., Citation2002).
Measuring changes in teaching quality requires measuring a specific construct (i.e., an aspect of teaching quality) within a specific setting (e.g., teachers’ average teaching across a year). For example, an experiment wants to draw conclusions about the amount of scaffolding (i.e., the construct) provided in treatment versus control classrooms (i.e., the settings). The observation scores that serve as evidence to support such conclusions, though, are assigned by specific raters by applying a given rubric’s operationalization of scaffolding to instances of instruction. Drawing conclusions about levels of a construct (i.e., scaffolding) in some settings (i.e., control and treatment classrooms), then, requires making a large number of inferences about what the specific observation scores captured by a study represent. Our framework breaks down those inferences and helps researchers to structure validity arguments to support those inferences.
summarizes our conceptual framework. Commonly, researchers will want to draw conclusions about the overall teaching quality that exists within teachers’ overall instructional practice (see leftmost parallelograms in ). The rectangles in show the processes that narrow this broad construct and setting in order to obtain the specific observation scores captured by a given study. Making the desired conclusions, requires generalizing observation scores across these processes to represent the broader constructs/settings, which are represented as parallelograms in .
Figure 1. Conceptual Framework for using observations to understand change in teaching quality. Note. Figure is adapted from White (Citation2022).
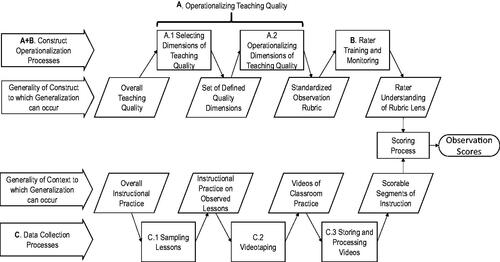
The top half of shows the process of operationalizing overall teaching quality in order to get observation scores that are meant to represent teaching quality. The parallelograms (bottom line of the top half of ) show different levels of generality to which the construct of teaching quality could be generalized while the rectangles show the processes that operationalize the construct of teaching quality. The bottom half of shows the process of sampling from teachers’ overall practice to generate the set of segments that are scored when generating observation scores. The parallelograms (top line of the bottom half of ) show the different levels of generality in the setting to which observation scores could be generalized while the rectangles show the sequence of processes that sample from teachers’ overall practice to obtain segments that can be scored.
Any conclusion about the impact of an intervention on instruction is, in essence, a conclusion about a construct (generalized from observation scores to one of the indicated levels of generality) that is attributed to a setting (generalized from observation scores to one of the indicated levels of generality). There are two ways to use . First, when designing or planning for studies, one can start at the left of and move to the right, noting the steps needed to obtain observation scores and planning so that one can validly generalize scores across those processes to the broader construct and setting. Second, one can start at the right with the observation scores that were obtained and build validity arguments that explain why one is able to generalize across each of the processes to make conclusions about more general constructs and setting. In either case, this framework lays bare the complexity in making broad statements about levels of teaching quality within a setting.
A. Operationalizing Teaching Quality
When studying instructional interventions, the theoretical construct of interest is usually teaching quality. The exact nature of Teaching quality is both too broad (and too contested) to ever fully measure (Bell et al., Citation2012), though some frameworks claim to do this (e.g., Schoenfeld, Citation2018). Rather, a study will typically select a subset of the possible facets of teaching quality to measure. Practically, this usually involves selecting an observation system, which conflates two important processes: Selecting Dimensions of Teaching Quality and Operationalizing Dimensions of Teaching Quality.
A.1 Selecting Dimensions of Teaching Quality
Selecting dimensions of teaching quality is a matter of determining what facets of the broader construct of overall teaching quality one wishes to measure. Note that making conclusions about overall teaching quality would require measuring a representative set of all possible dimensions of teaching quality. Given the many conflicting approaches to divide teaching quality into dimensions (e.g., Bell et al., Citation2018; Praetorius & Charalambous, Citation2018), this seems a difficult claim to justify. Rather, conclusions should generally be made about specific dimensions of teaching quality. This requires being specific about what aspects are (and are not) measured.
There are a number of considerations in selecting dimensions of teaching quality: the alignment of the selection with conceptions of teaching quality; the subject specificity of teaching quality; the appropriate grain size; and the relative roles of student versus teacher actions (Bell et al., Citation2019). In other words, selecting dimensions of teaching quality is a theory-driven and complex decision. In selecting some dimensions of teaching quality, these dimensions must be both named and explicitly defined. This is deceptively complicated since different observation rubrics use different terms for similar constructs and the same term for different constructs (Bell et al., Citation2019; Klette & Blikstad-Balas, Citation2018; Praetorius et al., Citation2018). Attention must be focused not on the name given to a dimension by a rubric, but the specific way the dimension is defined.
For example, some form of “student talk” is a common target of measurement. The Protocol for Language Arts Teaching Observation (PLATO; Grossman et al., Citation2013) captures aspects of student talk with the dimension of Classroom Discourse while the Framework for Teaching (FFT; Danielson, Citation2007) captures aspects of student talk with the dimension of Using Questioning and Discussion Techniques (QDT). PLATO’s Classroom Discourse emphasizes opportunities for students to talk and how the teacher takes up ideas introduced by students, while the FFT’s QDT emphasizes students’ joint responsibility for discussions and students asking high-level questions. These are very different aspects of student talk. From FFT’s perspective, PLATO does not fully capture the construct of student talk, as it fails to consider aspects that FFT treats as important (and vice versa). From FFT’s perspective, in fact, PLATO might not even fully capture the narrower construct of “classroom discourse” and FFT might not fully capture QDT from PLATO’s perspective. Despite the different dimension names, the two dimensions capture a similar construct while emphasizing different aspects of that construct. Two practical points follow. First, drawing conclusions about broad constructs, such as “student talk” or “classroom discourse”, is always contestable. Rather, studies will more readily be able to draw conclusions about narrower constructs, such as PLATO’s vision of Classroom Discourse. Second, researchers will have to carefully consider whether the specific definition and operationalization of each dimension meets their purposes.
Work is ongoing to compare and contrast the ways different observation rubrics define and organize dimensions of teaching quality (c.f., https://osf.io/rujv4; Charalambous & Praetorius, Citation2020). This work focuses on categorizing rubric dimensions into a common organizational framework (e.g., the MAIN-Teach model), as well as identifying specific differences in the behaviors and interactions captured by each rubric dimension. Such work provides specific details about how dimensions vary in both theory and practice, which should help guide researchers in selecting the right dimensions to measure and acknowledging the limitations of any measurement.
A.2 Operationalizing Dimensions of Teaching Quality
Operationalization is a matter of deciding exactly how one is going to measure the selected dimensions of teaching quality, transforming the sampled dimensions from theoretical constructs into an observation rubric to measure teaching quality. The key consideration is balancing the goal of fully capturing the theoretical dimension with the practical difficulties of measurement. These practical difficulties stem, in some part, from how data is being collected. For example, it is not uncommon for studies to rely on a single microphone, making it difficult to capture talk in small groups. Rubrics might have to focus only on whole class talk even if capturing all talk is better for measuring a construct.
One specific concern with operationalization in the context of intentional efforts to change instruction is whether the operationalization is capturing surface-level aspects of a lesson that are associated with the change effort, rather than deeper changes. For example, CLASS (Pianta et al., Citation2010) measures the Positive Climate of a classroom. One aspect (among many) of Positive Climate is students’ expressing positive emotions. An intervention where teachers instruct students to smile more would, presumably, increase the amount of displayed positive emotion and consequent CLASS scores, but this would not shift the underlying construct of Positive Climate, only superficial indicators of the construct. Less obvious examples of interventions capturing superficial shifts in teaching certainly exist (Slavin & Madden, Citation2011). Researchers should examine the possibility of this risk to avoid conflating superficial instructional changes that increase observation scores with deeper shifts to instructional quality that impact student learning or development.
Key Takeaways from Operationalizing of Teaching Quality (A.1 and A.2)
The most important takeaway from this section of the framework is that most studies will generally only be able to draw conclusions about specific operationalizations of selected dimensions of teaching quality. Most studies will sample dimensions of teaching quality and operationalize them through the selection of an existing rubric (or create their own rubric). This results in the study collecting data using a single operationalization of any given dimension of teaching quality. Empirically, the study can only draw conclusions about that operationalization. This should be explicit when discussing and interpreting studies. A large experiment that finds an intervention increases scores on, for example, PLATO’s Classroom Discourse dimension would not necessarily have found gains on FFT’s Using Questioning and Discussion Techniques, nor on similar constructs in other rubrics. Unless researchers can provide clear and convincing evidence that shifts would generalize to other operationalizations of the same construct, conclusions and interpretations of those conclusions should be appropriately narrow. It is all too easy to slip into language that classroom discourse has increased, or worse, that teaching quality has increased, both of which extrapolate beyond what most studies could plausibly conclude. Authors need to take care with their language to avoid such over-generalizing.
A second takeaway focuses on rubric developers. Rubric developers must be very explicit about the nature of the constructs they are defining, providing clear definitions that highlight both what is and what is not part of the given construct. Further, developers should explicitly argue how their operationalizations fully capture the intended construct, including honestly acknowledging ways that operationalizations are incomplete (e.g., due to limitations of observational data). Given the non-standardization of language in this area (Bell et al., Citation2019; Praetorius & Charalambous, Citation2018), this explicitness is necessary to clarify the construct being measured and the limitations of that measurement. Such explicitness by rubric developers is necessary to guide applied researchers toward making accurate and appropriate conclusions. Work comparing observation rubrics to determine areas of overlap and how different rubrics define and operationalize similar dimensions is ongoing (Charalambous & Praetorius, Citation2020). This should help clarify distinctions across rubrics and could potentially serve as a source of evidence to support researchers in generalizing beyond a given observation rubric.
B. Rater Training and Monitoring
At this point, we have discussed the steps involved in moving from the construct of teaching quality to an operationalized observation rubric. Raters are then needed to apply observation rubrics to collect data. The key concern in this process is whether raters are accurately and reliably applying the observation rubric as intended or whether the observation scores are more appropriately considered to be raters’ idiosyncratic impressions of teaching quality.
There are two broad components of how observation systems support raters in providing accurate and reliable scores: rater training and rater monitoring. These processes vary widely within- and across-observation rubrics and studies; this variation may lead to large impacts on the quality of observation scores (Liu et al., Citation2019; Woehr & Huffcutt, Citation1994). Rater training is the initial process of learning how to apply the rubric and often ends with a certification test that raters must pass (Graham et al., Citation2012). Certification tests are usually of unknown quality (White, Citation2018) and not all rubrics require certification (Praetorius & Charalambous, Citation2018). Further, the little evidence on the effectiveness of rater training suggests that it is not always as useful as hoped (Praetorius et al., Citation2012).
Rater monitoring is an ongoing process that occurs while scoring is being conducted, guarding against rater drift (Tong et al., Citation2019) and ensuring the continued validity of scores (Joe et al., Citation2013). Details about the exact nature of rater monitoring are often lacking in studies (Praetorius & Charalambous, Citation2018). Further, rater monitoring processes might not provide strong assurances that observation scores capture the intended construct of teaching quality (White & Ronfeldt, Citation2021).
Due to these concerns and in line with our goal of using the framework to support validity arguments, we focus not on the specific training and monitoring mechanisms, but on the specific inference that needs to be supported to generalize across these processes. Namely, generalizing across the process of rater training and monitoring requires arguing that the scores assigned by raters would lead to the same substantive conclusions as those assigned by experts in the observation rubric (e.g., master raters, rubric developers; i.e., that the scores represent the construct as operationalized by the rubric). The first important point to make is that standard estimates of rater error (e.g., Cohen’s Kappa) cannot by themselves provide such assurances (White, Citation2021; Wilhelm et al., Citation2018). This is because some conclusions may be highly robust to rater error while others may be highly susceptible to even small levels of rater error. For example, if rater error is associated with teacher’s sex, leading male teachers to receive lower scores than female teachers (e.g., Campbell & Ronfeldt, Citation2018), then even low levels of rater error could have large impacts on conclusions about whether male and female teachers are equally skilled. However, if rater error is random, much higher levels of rater error might not bias such conclusions (but will reduce power to detect effects). Rather than relying on estimating inter-rater statistics and comparing those to some standard, there is a need to develop methods to explore the robustness of conclusions to the observed levels and types of rater error (White, Citation2021).
An important question is how to justify claims that observation scores reflect the intended construct. High rater reliability is a first step, but it is not sufficient. Taking a cognitive view of the scoring processes, we can identify at least three steps in a rater’s scoring process: (1) creating an internal representation of the observation rubric; (2) creating a mental representation of the segment of instruction (along rubric dimensions); and (3) comparing these two (Bejar, Citation2012). The strongest justifications would highlight these three processes, demonstrating that raters have accurate internal representations of the rubric, can decompose lessons to create accurate internal representations of a lesson, and are able to come to the appropriate score given the evidence collected. Research suggests raters cannot always do this. Bell and colleagues (Bell et al., Citation2014, Citation2018) found that even highly experienced raters misunderstood key aspects of observation rubrics and reasoned in ways that are unlikely to result in high quality scores when scoring. The construct-irrelevant variance introduced to observation scores when this occurs could affect study conclusions, challenging the process of generalizing across rater training and monitoring.
The difficulties of generalizing across the specific raters scoring an observation rubric just discussed are important considerations for all researchers using observation systems, but clear guidance and general solutions are difficult to provide. There are, though, two vital challenges related to rater error where more explicit guidance can be provided. First, steps should be taken to reduce the conflation of rater error and treatment effects. Videotaping supports this because it allows researchers to code baseline videos and post-intervention videos simultaneously. This avoids conflating rater drift (i.e. changes in how raters score across time) and treatment effects (c.f., Casabianca et al., Citation2015). Additionally, assigning raters equal numbers of treatment and control videos and randomizing the order in which raters score videos will reduce the conflation of rater error and treatment effects. These guidelines, however, lead to scoring videos at the end of a grant, limiting the time available for analysis and requiring surging staffing capacity at the end of a grant period.
Second, the intervention may shift instruction in detectable ways, leading to biases in scoring. For example, intervention paraphernalia and terminology may be detectable on video or intervention-specific lessons may be taped. Astute raters can pick up on these cues, which could impact their ratings through confirmation bias. Then, researchers should test for differences in the quality of scoring across intervention status. At a basic level, this should involve testing for inter-rater reliability separately in both treatment and control videos. Further, checks on the presence of intervention-specific lessons or artifacts should be conducted and their presence coded so that statistical analyses can explore whether intervention effects were limited to lessons that are closely-tied to the intervention (and where rater confirmation bias could affect scoring; see case study below). Last, at the end of the study, focus groups with raters can directly explore raters’ perceptions.
Key Takeaways from Rater Training and Monitoring
The diversity of approaches to rater training and monitoring (Liu et al., Citation2019) along with the limited research on their effectiveness (Praetorius & Charalambous, Citation2018) and the challenges inherent in examining rater error (Bell et al., Citation2014) makes generalizing across processes of rater training and monitoring complex. Most studies rely on descriptions of rater training and monitoring processes and citing estimates of inter-rater reliability as evidence to support this inference (c.f., White & Ronfeldt, Citation2021), but we think this is insufficient. New methodologies that explore the robustness or sensitivity of specific study conclusions to observed levels of rater error are needed (White, Citation2021). Until such methodologies exist, the combination of demonstrating high levels of rater reliability and exploring rater cognition, along with the specific design recommendations suggested above will provide the strongest set of evidence to generalize across rater training and monitoring processes. Without strong evidence to support this generalizing, observation scores are probably best considered as raters’ idiosyncratic perceptions of teaching quality rather than the intended construct of teaching quality as operationalized in the observation rubric. Further, an important and related point is that the biases in the scoring process are only problematic if they differ across treatment conditions and/or pre-/post-treatment time points.
C. Data Collection Processes
This section discusses the processes involved in data collection, which are shown on the bottom half of . The framework starts with Overall Instructional Practice (e.g., teachers’ average teaching quality across a school year) as the target context for generalizing observation scores (see bottom left of ). When looking at interventions, the goal is often to make claims about average teaching quality across a year (or some other unit of time). Making such claims, though, requires that the process of sampling specific days of instruction and of videotaping captured a representative range of instruction. Importantly, evaluation studies rarely try to generalize to a single teachers’ practice, but generalize to the practice of intervention (or control) teachers overall, which is simpler (Hiebert et al., Citation2003). Standard generalizability theory approaches that estimate the reliability with which a single teacher’s instruction can be measured (e.g., Kane et al., Citation2012), given a set number of raters and days of instruction, then, are not of particular use here.
C.1. Sampling Lessons
There are a number of choices to be made in the sampling of lessons. Each year, researchers will have to select the classrooms to observe, the time of year to observe, and whether to focus on specific types of instruction (e.g., specific content areas). These choices may impact the resulting observation scores as teaching quality varies across the course of the school year (e.g., Casabianca et al., Citation2015; Plank & Condliffe, Citation2013), school day (Curby et al., Citation2011), students taught (Carlisle et al., Citation2011; Grossman et al., Citation2014), and other characteristics of the lesson and classroom. This variability probably differs across dimensions of teaching quality (Praetorius et al., Citation2014). Further, evaluations will generally persist across multiple years and the students, grade, and/or subject taught by a teacher can change across years, which can systematically affect observation scores (e.g. Grossman et al., Citation2014; Steinberg & Garrett, Citation2016). It is not clear how to address these changes as adjusting scores may over-correct for any effects (c.f. Milanowski, Citation2017). Fortunately, so long as the shifts are similar across intervention and control classrooms, estimates of intervention effects should remain unbiased.
The key take-away for sampling lessons is that three separate considerations must be balanced. First, how broad is the sampling frame for selecting lessons (i.e. to what population of lessons is the study generalizing to; e.g. all writing instruction vs. all instruction). Second, what are the potential threats to the internal validity of study conclusions (i.e. how might the intervention affect sampling). Third, what practical data collection considerations exist. In balancing these considerations, the goal is to be able to argue that (1) the observed lessons are a representative set of all the possible lessons within the setting to which one wishes to generalize, which enables generalizing to the broader setting; and (2) there are no differences in sampling in the treatment and control settings that might bias estimates of change.
Tradeoffs exist when addressing these considerations. One common tradeoff is flexibility around when observations occur. Randomly sampling lessons from a well-specified sampling frame is the best way to minimize sampling biases. Practical considerations make this challenging, given the demands of negotiating access and consent within complex school environments (e.g., shifting schedules, testing periods). These considerations can be balanced by randomly assigning teachers to specific scoring windows (e.g., specifying a 2 week period within-which teachers should film, rather than specifying the exact day; White et al., Citation2022). All else being equal, narrower windows limit teachers’ flexibility, making access harder but decreasing teacher choice in sampling (and decreasing possible sampling biases). The narrower the sampling frame (i.e. the more specific the type of instruction one wishes to observe), the wider the filming window must be and the less choice teachers have in selecting a lesson. For example, if a specific type of instruction (e.g., writing) were only taught once a week, a week long sampling window would be required to ensure that the instruction could be observed within each window and a 1 week window would provide teachers no choice in which lesson is observed (i.e. since the desired type of instruction occurs only once in the 1 week window). Especially when sampling frames are narrow, working to understand school contexts to balance the competing demands of a good sample of lessons with practical considerations is necessary.
Teacher choice in which lessons are sampled can lead to biases in treatment effect estimates that are difficult to detect. For example, an expository writing intervention may define the sampling frame as all writing lessons so that the relative frequency of expository writing can be estimated. Intervention teachers may be reminded of the intervention when providing expository writing instruction and so more likely to notify researchers when such writing occurs (compared to other forms of writing), or may intentionally invite researchers to observe such instruction to demonstrate what they have learned. This would create a positive sampling bias in only the intervention group, artificially inflating estimates of the frequency of expository writing in the intervention group.
While we have focused on challenges from teachers’ choice in lessons, it is important to acknowledge other challenges. Consider, for example, the risk of Simpson's paradox (Blyth, Citation1972). Simpson’s paradox occurs when an overall correlation disappears or reverses direction when looking within sub-groups. For example, scores from observation rubrics are generally higher in reading than in grammar instruction (Grossman et al., Citation2014; c.f. Kelcey & Carlisle, Citation2013 for a broader discussion). If an intervention leads to more grammar instruction, average observation scores may decrease even when teaching quality in both reading and grammar improve. In this case, even with random sampling of lessons, the conclusion based on the average teaching quality may lead to incorrect inference, unless shifts in content are accounted for. We highlight this clearly with our case study below. Importantly, Simpson’s paradox can occur from any shift in the content and/or structure of instruction when such shifts are associated with average differences in observation scores (e.g., content, grouping structures, specific teaching routines). We recommend researchers consider how instructional interventions might shift instruction and measure each of those shifts, not just those directly connected to teaching quality (see case study example below).
The process of sampling lessons is highly complex. Two general principals are clear. First, biases in treatment effect estimates are best avoided by creating consistency in sampling both between baseline and post-intervention data collection and between treatment and control teachers. That said, as we discussed above, even when data collection procedures are similar over time, biases can occur. Second, sampling should be as close to random as possible (within specified sampling frames) and spaced across time to ensure videos are representative of the full sampling frame. Both of these goals are practically challenging.
C.2. Videotaping Lessons
Videotaping restricts what raters see and hear and provides a specific orientation that guides rater focus (e.g. Jaeger, Citation1993). Further, it can affect observation scores (Casabianca et al., Citation2013). The most important point to consider for videotaping is the alignment of videotaping and both the way teaching quality is operationalized and the intervention. Our broad experience is that some instructional approaches (e.g., small-group instruction) create far more challenges in video and/or audio quality than others (e.g., recitation), so that shifts in instructional practices (e.g., the frequency of group work) could create meaningful differences in audio and/or video quality across treatment conditions in many intervention studies. Note that this point reinforces our suggestion above of considering shifts in the content or format of instruction that might result from an intervention. To prevent these differences in video and/or audio quality across treatment conditions, researchers need to carefully consider what instruction might look like in each condition and plan for videotaping that captures all relevant features of instruction. For example, when teaching quality focuses on student-to-student interactions, videotaping requires multiple cameras and microphones to capture all student interactions (e.g. Klette et al., Citation2017). Similarly, content focused interventions may need to view what students are working on during lessons.
The key takeaway from this section is that the set of videotapes (or observations) collected for a study are the data that a study has to make empirical statements. However, most studies will want to make claims about more than the videos that happened to have been collected. If researchers want to generalize beyond the collected videos, a specific and explicit case for why this generalization inference can be supported is needed.
C.3. Storing and Processing Videos
After collecting video, the next step is to store and process the video files. Videos must often be processed to remove non-consenting students (and their voices), to prepare videos for coding (e.g., 15 minute segments are often scored so videos must be segmented), or to ensure consistency across videos. For example, one challenge that has arisen frequently in our work is that the start of the video does not consistently occur at the start of the lesson. Some videos have some dead time before the lesson while others begin after the lesson starts. When the focus is on teaching quality during organized instruction, we recommend trimming videos to remove dead time at the start of videos to create greater consistency across videos.
A number of other video processing steps also occur. When multiple camera or audio sources are recorded, there is a need to merge these sources (which may happen automatically through software). This merging may pre-select specific video and audio streams, may allow raters to flexibly switch between sources, or simultaneously display multiple video files at once. Each of these choices has the potential to affect scoring, but little to no research has been conducted on the possible effects of different choices.
Key Takeaways from Data Collection Processes
Most studies using classroom observation systems have method sections that simply describe the sampling process. The many potential pitfalls and sources of biases discussed here makes the case that researchers must go beyond this simple description and argue why the sampling process is sufficient to allow researchers to generalize observation scores to represent more than just the segments that raters scored. First and foremost, this requires explicitly specifying the generality of the context to which generalization is desired (Simons et al., Citation2017). This also requires arguing that the sampling of lessons, videotaping, and processing of videos were done in ways that allow researchers to generalize the scored segments across these processes to represent the intended context. Last, researchers must make the case that differences in these processes across the intervention and control groups did not bias conclusions about intervention effects.
Case Study: Shifts in the Common Core State Standards (CCSS)
In this section, we present a case study to highlight how this framework can be applied, focusing on two uses of the framework: (1) identifying how to design a study to minimize validity threats; and (2) generalizing study results to make clear and precise conclusions. For the first use, we discuss two key challenges of the case study and how the framework supports efforts to minimize the impact of these challenges. For the second use, we discuss the level of generality to which the case study can make conclusions.
In 2010, most states in the US adopted the Common Core State Standards (CCSS; Lavenia et al, Citation2015; National Governors Association Center for Best Practices [NGA] & Council of Chief State School Officers [CCSSO], Citation2010). These standards represented an important shift in the policy context around instruction, shifting both internal components of the educational system (e.g. learning goals; standardized tests) and the broader school improvement industry that provides information, products (e.g. textbooks), and services (e.g. professional development) to schools (Rowan & White, Citation2022). We focus on English language arts (ELA). The ELA CCSS was designed to promote three key shifts: (1) “regular practice with complex texts and their academic language”; (2) “Reading, writing, and speaking grounded in evidence from texts, both literary and informational”; (3) “Building knowledge through content-rich nonfiction” (NGA & CCSSO, Citation2010). These key shifts involved changes to both the content of instruction and the ways that students and teachers interact with each other and with content.
The case study comes from the Teaching over Time (ToT) project (White et al., Citation2022). The goal of this project was to (descriptively) understand within-teacher shifts in instructional practice from 2010, shortly before the CCSS was adopted, to 2018, after the CCSS had an opportunity to shift instructional practice. The ToT project began in 2017 so it was reliant on using archival data from the Measures of Effective Teaching (MET) project (Kane et al., Citation2012) to obtain 2010 video data. This use of archival data led to differences in data collection procedures across time points, the first key challenge we discuss. The second key challenge in the ToT study that we discuss is the question of how to define teaching quality given the dual efforts of the ELA CCSS to shift both instruction’s content and its quality (i.e. interactions of teachers and students with each other and content). In discussing these challenges, we highlight how the framework can support researchers in designing studies to minimize the potential impact of these challenges on conclusions. We first provide details about the ToT project data and then discuss these two key challenges in detail. We then provide a brief outline of how the framework can be used to construct partial validity arguments to support study conclusions, focusing on the challenge of generalizing observation scores to make conclusions about a specific construct within a specific setting.
Description of Case Study Data
The ToT project assembled a video corpus that included 4 videotaped lessons from the same 97 4–8th grade ELA teachers in 2010 and 2018. These 97 teachers represented almost all teachers that participated in the MET project in 2010 and were still present in the same district and teaching ELA in grades 4–8 during 2018. This makes the ToT sample a sample of highly experienced teachers who spent their career in some of the largest school districts in the US.
First Key Challenge: Differences in Data Collection
In discussing the first key challenge, we focus on a practical decision that had to be made due to the structure of the ToT study. Namely, financial considerations led to different approaches to videotaping across time points. In discussing this challenge, we highlight three general uses of the framework. First, the framework can help researchers limit the impact of necessary study design features that pose a potential threat to study conclusions. Second, the framework helps researchers identify ways to measure the potential impact of the challenge and explore the robustness of conclusions to the challenge. Last, failing the first two, the framework can help researchers identify problems that should be noted as study limitations.
The first key challenge is driven by the reliance on archival MET video data (White et al., Citation2018). The MET data was collected long before the start of the ToT study. MET included geographically diverse districts. Further, MET filmed lessons within spaced filming windows using a 360-degree view camera that required videographers to operate (White et al., Citation2018). Repeating these procedures would have been prohibitively expensive for the ToT study and unnecessary given new technologies. The ToT study found a camera solution that let teachers film their own lessons with remote support, creating differences in videotaping across the time points. These differences, due to the design of the ToT study, are conflated with the desired “treatment” effect of differences across time. The risk of this choice is that differences in videotaping could bias estimates of the change in instruction across time.
In exploring the impact of differences in videotaping across time using the framework, we focus on the processes (i.e. the rectangles) laid out in . Each process represents an active step a study takes. These steps can be adjusted to minimize the impact of differences in videotaping and to collect information about the impact of these differences. We note three key areas for discussion regarding differences in videotaping. First, the differences in videotaping could led to biases caused by differences in the sampling of lessons across time points. Second, differences in videotaping could be mitigated during the storing and processing of videos. Third, differences in videotaping might have impacted the way raters scored videos.
The sampling of lessons in the MET study could not be affected by ToT researchers, so the goal of the ToT study was to construct a 2018 lesson sample that was as similar as possible to the MET lesson sample. The differences in videotaping complicated this because teachers received the camera in the mail and so had a great deal of choice in which lesson to videotape. The ToT study tried to maximize the similarities across time points by providing videotaping instructions and guidelines in 2018 that matched those in 2010 (e.g., having teachers submit 1 video within each of several spaced filming windows; using identical language to describe the type of instruction to videotape). Further, quality control efforts around videotaping reviewed each videotape completed by teachers and requested that teachers retape where needed to ensure that video-quality stayed at high levels. This minimized the differences across time points within the constraints of the differences in videotaping. The result was relatively small differences in the distribution of videotaping across the school year, but some differences still existed. Namely, the 2010 lessons were later in the school year. The robustness of study conclusions to this difference in the timing of videotapes was then explored by running statistical models with and without controls for the time of year of videotaping. The results were the same, suggesting results are robust to the remaining differences in when lessons were recorded.
Importantly, however, the distribution of lessons across the school year does not represent the only threat identified here. Teacher choice in which lessons to videotape and/or teacher self-censoring of videotapes could have impacted the sampling of lessons in 2018 without affecting the distribution of videos across the school year. Teachers reported on the typicality of each lesson and open communication was maintained through videotaping to try to understand and minimize these risks, but they cannot be eliminated, so the risk of teacher choice or self-censoring impacting the sampling of lessons is a key study limitation.
The storing and processing of videos can help mitigate the impact of differences in what was captured on videotape. For example, during quality-check procedures, ToT researchers noted that 2018 videos often started before students arrived in classrooms while 2010 videos often started as the lesson began. This videotaping artifact led many 2018 videos to start with a lengthy period of non-instructional time, which could impact the scores assigned to videos. To ensure consistency, all videos were trimmed to begin when the teacher initiated instruction by addressing students. A side effect here was removing independent student work on warm-up problems before the teacher addressed the class (more common in 2010). If changes in instruction during the CCSS-era occurred in these warm-up activities, the ToT study would miss these changes. Then, the ToT study can generalize not to lessons as a whole, but to the portion of lessons that comes after teachers first address students.
Last, the differences in videotaping led videos to be visibly different across time, which could impacted the scoring of videos across time (i.e., through expectation effects or differences in audio/video quality). The process of rater training and monitoring is a clear opportunity to minimize this risk. The ToT study designed rater training and weekly calibration sessions to focus on both 2010 and 2018 videos so that raters had experience with both styles of video. Training also discussed how video/audio quality might impact scoring, encouraged raters to bring forth challenges that arose in their scoring, and encouraged raters to take extensive notes and then code from these notes. During an end of project focus group, raters reported that they felt equally capable of scoring videos from each time point, suggesting that these efforts were at least somewhat successful.
Overall, given the challenge posed by differences in videotaping, the framework helps to systematically consider how the videotaping differences propagated through the study, impacting many choices in study design. While the framework portrays a set of discrete processes, the processes are interdependent and it is the total across the processes that determines the types of conclusions a study can reasonably draw. For example, trimming videos removed important artifacts of the videotaping process but also made aspects of instruction invisible to the study. Tradeoffs like this are likely common. The framework, then, does not represent an instruction template, but rather explicitly highlights the processes in which these tradeoffs and challenges will occur. This provides a cognitive scaffold to help researchers work through plans for addressing study design to minimize the risk of bias, to measure the potential impact of such bias, and to identify limitations that exist to study conclusions that could not be mitigated.
Second Key Challenge: Defining and Operationalizing Teaching Quality
The second key challenge we discuss in the case study is the challenge of defining and operationalizing teaching quality. This is a challenge that all projects will face. Rather than providing a full treatment, as we did in the first challenge, we focus on the ToT study’s attempt to measure shifts in the quality of instruction across time and how this effort is complicated by shifts in the content of instruction. The goal of highlighting this challenge is to emphasize the importance of carefully defining and explaining the nature of teaching quality that the study seeks to measure and the importance of measuring a wide range of potential instructional shifts that might accompany an intervention.
As we noted above, the CCSS was designed to change both the content and the quality of instruction, where quality here means the ways that students and teachers interact with each other and with content (see White et al., under review). To capture the quality of interactions, the case study adopted the Protocol for Language Arts Teaching Observation (PLATO; Grossman et al., Citation2013), which focuses on the discipline-specific instructional approaches that CCSS was designed to shift (e.g., student’s work with authentic texts). Here, we focus only on PLATO’s Disciplinary Demand domain for simplicity. The Disciplinary Demand domain captures the “extent to which teachers ask students to engage in intellectually challenging or demanding activities and talk about ELA or disciplinary content” (Grossman et al., Citation2014) and is measured through the elements of intellectual challenge, classroom discourse, and text-based instruction. Disciplinary Demand is an important domain of effective ELA instruction (Grossman et al., Citation2014) that the CCSS should directly impact.
As we discussed earlier, it is important for studies to broadly consider how interventions impact instruction and measure those changes broadly to better understand shifts to instruction. Applied to the ToT study and considering both what we know about the PLATO rubric and the processes shown in the framework, the ToT study identified two reasons to capture the content of instruction. First, the issues around sampling of lessons just discussed and the CCSS’s heavy focus on the content of instruction led to the possibility that teachers could choose to oversample CCSS-content related lessons for filming in 2018. Measuring content allowed for an exploration of whether shifts in quality of instruction were robust to controls for the content of instruction, which could be associated with lesson sampling biases. Second, the PLATO rubric is known to be sensitive to the content of instruction (Grossman et al., Citation2014) so shifts in the content of instruction could lead to the sort of Simpson’s Paradoxes discussed above. Due to space limitations and our desire to highlight construction operationalization issues in this section, we focus only on the second reason.
The ToT study measured the content of instruction using a study-specific observation rubric (White et al., Citation2022). This rubric broadly tracked the content being taught across reading and writing (but not speaking, listening, or grammar) using the ELA CCSS anchor standards. Four dichotomous variables were created to capture content shifts promoted by the ELA CCSS. These four content areas are (1) whether the lesson focused on close reading, (2) whether the lesson focused on expository writing, (3) whether the lesson focused on informational text, and (4) whether the lesson content was presented at or above CCSS grade-level standards. Taken together, these four variables capture at a broad grain size the range of the content shifts that the CCSS was trying to promote.
We show partial results for the Disciplinary Demand domain of the ToT study in (see White et al., under review) for the main results. The regressions shown in are OLS teacher-fixed effect models that nest lessons within teachers and cluster standard errors at the teacher and rater level. The marginal model shows the estimate of the ToT time effect after adjusting for the timing of videotaping (discussed above) and rater, teacher, and grade fixed effects. The conditional model adds controls for the content of instruction, as just discussed. The marginal model suggests a statistically significant effect across time of 0.10, or 0.1 points on the 4 point PLATO scale, while the conditional model suggests a non-significant effect that is about half as large.
Table 1. Fixed effect regression models predicting change in disciplinary demand scores.
In looking across these two regression models, the importance of carefully defining teaching quality and understanding the full range of shifts in instruction that an intervention creates becomes clear. The marginal model, which identified a statistically significant increase in PLATO’s Disciplinary Demand, estimates the overall average shift in PLATO’s Disciplinary Demand. The conditional model looks at the average shift in PLATO’s Disciplinary Demand after conditioning on the content variables, or the within-content shift in PLATO’s Disciplinary Demand. Additionally, the conditional model shows that close reading lessons and lessons that met grade-level expectations were higher in quality than other lessons. Note that those lessons are more common in 2018 than in 2010 (White et al., Citation2022). Then, looking across the models, we can conclude that there was an increase in PLATO’s Disciplinary Demand in the sample of teachers, but that this change appears to be largely the result of shifts in the content of instruction (i.e., the type of instruction that scores higher occurs more often). The conclusion depends very specifically on the question being asked. There is a change in the content of instruction, not a change in teachers’ capacity to teacher specific content. If we ask whether students receive instruction at higher quality, the answer is yes. If we ask whether teachers developed their capacity to teach, the answer is no.
The key takeaway is the need to broadly consider how an intervention affects instruction and measure for these impacts broadly so that the study can more richly describe the impacts of the intervention. If the ToT study had not captured content shifts, the conclusions of the study would have been somewhat misleading. A second, connected takeaway is the importance of very carefully measuring teaching quality and making precise conclusions. After all, the conclusions one would have drawn from the marginal and conditional models shown here are different.
Generalizing ToT Score Observation Scores
The goal of this section is to highlight how the framework can support the validity of specific study conclusions. We start from the modern validity theory premise that any interpretation or use of observation scores should be supported with a validity argument (Bell et al., Citation2012). We also note that the ToT project only observed that a set of observation scores they collected from their own raters based on ∼1600 15-min segments increased across the two time periods. However, the project seeks to make much more general conclusions about teachers’ practice and specific domains of teaching quality (i.e., Disciplinary Demand). The framework lays out an outline for supporting parts of a validity argument to support study conclusions. This is because the processes (i.e., the rectangles) must be generalized across in order to interpret observation scores as representing the broader constructs in the broader contexts. We evaluate the ToT project’s ability to generalize across these processes here.
The first step in generalizing the observation scores to represent a broader construct is generalizing across rater training and monitoring processes to conclude that the change in observed Disciplinary Demand scores reflects a change in teaching quality as viewed by the PLATO rubric. In evaluating whether such generalizing is warranted, we note the evidence to support the generalizing. All raters passed PLATO training and certification. During calibration, all raters demonstrated that they were able to notice appropriate pieces of evidence and reason with the PLATO rubric. However, inter-rater agreement was generally modest and there is no evidence on whether raters would provide the same scores as PLATO master scorers. Then, we have some, but not strong, evidence that the difference in observation scores represents a difference in the construct of Disciplinary Demand as operationalized by PLATO.
The next step would be generalizing beyond the specific operationalization of PLATO’s Disciplinary Demand to capture the broader construct. There is no evidence regarding whether other operationalizations of Disciplinary Demand (or similar domains) would show the same growth across time. Then, no evidence exists to support drawing conclusions about broader constructs than PLATO’s operationalization of Disciplinary Demand and the ToT project cannot generalize the construct further. Note, in addition, the discussion above where we highlighted that while overall Disciplinary Demand scores appeared to have increased, the Disciplinary Demand scores within specific content areas have not shown a clear increase, which further complicates the conclusion about the construct. That is, conclusions will vary based on whether the desired construct is the marginal or conditional shift in Disciplinary Demand.
Beyond generalizing to broader constructs, the ToT study must also generalize beyond the specific segments scored to build an argument of what those segments represent. A number of facts are key to consider here. During the processing of videos, the ToT study kept only the first 30 minutes of a lesson, starting from when the teacher verbally addressed the class, so conclusions only apply to the first 30 min after teachers address the class. Second, raters reported no challenges with video/audio quality that might hamper their scoring and videos appeared to capture all aspects of the classroom needed to score Disciplinary Demand. We might argue, then, that the processes of videotaping and processing videos can be generalized across so that the scored segments can be interpreted as representing the first 30 min of lessons after teachers first address the class. Note that in generalizing across these steps, we explicitly note the limitations (e.g., first 30 min).
Last, there is the challenge of generalizing across the sampling of lessons, which we have discussed above. Teachers in 2018 (and to a lesser extent in 2010) had flexibility in what lessons were observed and it is unclear if and to what extent they exercised this flexibility. That said, the videos appeared to reflect a broad diversity of content and instructional approaches, were spaced across much of the school year, and were reported (by teachers during the ToT time point) to be generally reflective of their practice. Then, the ToT study has some evidence that might support generalizing conclusions about observation scores in a limited way to the set of lessons that teachers were willing to share with researchers, though the important caveat that we do not know how such lessons relate to lessons as a whole is needed. A further caveat to this generalizing is the risk that teachers’ greater choice in 2018 led to the samples being different across time points, which could bias conclusions about change over time.
Overall, then, the ToT study might tentatively (with the noted limitations) make conclusions about differences in PLATO’s operationalization of Disciplinary Demand within the first thirty minutes of the typical lesson that teachers are willing to submit (starting from when teachers address the class). Within this setting, we conclude that there was an increase in Disciplinary Demand (as defined and operationalized by PLATO), but this increase appears to be the result of shifts in content, as teachers started to teach more of the type of content that they already taught at higher levels of Disciplinary Demand.
This conclusion should be contrasted with those more likely in a typical study. After all, the ToT study followed best practices for the field, given the constraints of the design. Through using this framework, we make more realistic, though much more complex, conclusions about our ability to understand changes in teaching quality in a group of teachers since the CCSS was adopted. This complexity is unavoidable due to the numerous chains of assumptions about the context being measured and the construct being measured required for making valid conclusions using observation systems. Researchers should be appropriately modest when drawing conclusions, especially when drawing implications for policy or practice (Simons et al., Citation2017).
Discussion
This paper presented a conceptual framework for using observation systems to measure changes in teaching quality in the context of instructional interventions. Observation systems are a highly complex, but important tool for understanding the impact of instructional interventions. We have argued that using observation systems requires a complex set of steps to sample from and transform the construct of teaching quality and the complex setting of instructional practice into scores from an observation rubric. The framework breaks this transformation down, laying out how constructs and settings change as the result of each step. Making claims or conclusions, then, is a matter of making the validity argument that we can generalize observation scores across each step to more abstract notions of the construct or context. However, this generalization is neither easy nor straightforward, as the framework shows.
There are many risks of instrumentation biases that arise with the use of observation systems. The most troublesome are those related to the intervention itself, as these can bias estimates of the intervention’s effect. The intervention can create instrumentation biases by creating superficial changes that affect rater scoring, by shifting what videos teachers choose to submit, or by shifting the relative frequency of the teaching of specific content. As the case study demonstrates, if researchers do not think carefully about these threats and address them in the design or analysis of data, they may draw incorrect conclusions. For example, coding whether observed lessons are intervention-specific lessons can help researchers explore whether instruction has shifted only in intervention-specific lessons or more broadly (see our approach to dealing with content above). But if coding for intervention-specific lessons does not occur, one cannot make these careful distinctions. Tests such as these (and any controls for lesson content or format) should be pre-specified in any program evaluation context in order to reduce “researcher degrees of freedom” in analyses (Simmons et al., Citation2011). Pre-specifying these analyses requires two careful thought about how the intervention might shift instruction and how these shifts might interact with the observation rubric to shift observation scores. Our framework could support this planning.
The Framework as a Cognitive Scaffold in the Design and Analysis of Studies
We view our framework as a cognitive scaffold to support researchers in the design and analysis of intervention studies that use observation systems. Then, a major contribution of this paper is not necessarily a set of specific guidelines or rules for how to conduct studies or what to add into articles, but the contribution comes from supporting researchers in more carefully and systematically examining what potential biases exist and how these biases can be dealt with. This was shown clearly in the first key challenge of the case study that we discussed. There, we showed how, given a challenge stemming from the design of the study, the framework supports researchers in considering the different ways that challenge could potentially bias conclusions so that the study could be designed to both mitigate this risk and measure the potential impact of the risk for later sensitivity analyses. In supporting this goal, the framework explicitly lays out the series of processes that a study must conduct in order to operationalize constructs and collect data. These processes then represent the study design points where researchers can try to mitigate potential threats to valid study conclusions.
The discussion of generalizing ToT scores in the case study demonstrated a second way that the framework can serve as a cognitive scaffold to support researchers in evaluation work with observation systems. Here, we emphasized the level to which observation scores could be generalized to, which determines how much study conclusions can be generalized. The emphasis is on the parallelograms in , which identify specific levels of generality for the construct of teaching quality and the context about which the study seeks to make a conclusion. In our discussion, we highlighted how the processes had to be generalized across to draw conclusions about more generalized constructs and in broader contexts. In this use, the framework acts as an outline for a partial validity argument, highlighting how researchers can draw either broad conclusions or narrow conclusions from a study. The framework also makes clear that the broader the conclusion being drawn (i.e., the more general the construct or context about which a conclusion is drawn), the more difficult it is to support the conclusion and the more processes across which one must generalize (with each generalization supported by an explicit validity argument). This explicitness will help researchers to consider the level at which conclusions can reasonably be made.
The cognitive scaffold provided by this framework is an important tool to support researchers in making precise and valid conclusions about efforts to change instruction using observation systems. It also connects with broader worries about the overgeneralized claims from research and the growing impetus to push for authors to explicitly discuss and constrain the level of generality that one believes is appropriate (c.f. Simons et al., Citation2017). It might be challenging to make the arguments necessary to support proper generalizing within the space confines of typical journal articles. Online methodological appendices are one solution to allow adequate space for the validity arguments highlighted here. We should expect and require greater use of such appendices in order to ensure that researchers are carefully and precisely making conclusions that are well-supported by strong validity arguments.
Implementation Recommendations
While we think an important benefit of this framework comes from its ability to serve as a cognitive scaffold as just discussed, we can make a number of more concrete recommendations based on this framework too. This is because some challenges of measuring intervention effects using observation systems are likely to be common and so general solutions can be proposed. For example, intervention status will often be clear from the video based on the language or paraphernalia visible in the classroom. Then, a plan for how to train or monitor raters to ensure that this does not bias scoring is needed to support strong inferences about the impact of the intervention. Similarly, the issue of how the chosen operationalization of teaching quality maps and connects to other similar operationalizations of similar constructs will likely arise across most studies. The general suggestion of providing explicit definitions and clear operationalizations of teaching quality is then broadly applicable. It is important to highlight that current work is ongoing to understand the similarities and differences between common rubrics and to create frameworks to understand how different operationalizations compare (e.g., Charalambous & Praetorius, Citation2020). This general work could help to support broader conclusions about the constructs being measured.
The most important recommendation, however, is the recommendation that researchers be explicit and precise with their conclusions. Further, reviewers, journal editors, and funding agencies should hold researchers to this standard. The difference between making conclusions about teaching quality in general and making conclusions about a specific operationalization of teaching quality matters. As does the difference between making conclusions about teachers’ overall practice and making conclusions about the lessons that teachers are willing to volunteer to share with researchers. Losing these distinctions risks massively over-generalizing claims about the findings of studies. Retaining these distinctions properly highlights the dependence of findings on the validity of specific tools, provides more detailed understandings that could be important for examining program logic models, and highlights potential limitations in our knowledge of the impact of the program on practice.
Limitations of the Framework
It is important for us to briefly discuss the limitations of the framework. This framework is not meant to comprehensively lay out the structure of a validity argument nor identify every potential challenge that might arise in using observation systems in evaluations of instructional interventions. For example, there is growing concern about differences in individual students’ experiences of the same classroom, especially in preschool and kindergarten (e.g., Kim et al., Citation2019). Our framework provides no explicit pathway that highlights this specific challenge, even though differences in individual student responses to interventions could be a common problem in instructional interventions. That said, once this problem has been identified, the framework does highlight data collection and construct operationalization processes relevant to addressing this challenge. For example, after identifying the challenge of individual differences, the framework can be used to consider how this challenge could impact videotaping and what steps we can take during videotaping to reduce this risk, much in the same way as we demonstrated when discussing the first key challenge in the case study. Similarly, while the framework helps identify places where bias might be introduced, it does not provide guidance for estimating the amount of bias introduced, which will vary based on contextual features of the classroom. Then, this framework is only a partial tool, but we think it could still make strong contributions to increasing the quality of evaluations using observation systems.
Conclusions
This paper introduced a framework to examine how observation systems can be used to draw conclusions about change in teaching quality in response to an intervention. The framework highlights the complexity of this goal from a measurement perspective. There are numerous challenges to carefully deciding what to measure and how to measure it, training and monitoring raters, and managing a well-planned data collection effort. We believe careful consideration and critical thought about each of these steps is the only way to have faith in a study's conclusions. Despite the complexity of this work, we believe it is vital because it opens up the black box of instruction, the core of what schools and teachers are meant to do.
Author Note
All views expressed in this paper are those of the authors. A previous version of this work was presented at the AEFP 45th Annual Conference.
Open Research Statements
Study and Analysis Plan Registration
There is no registration associated with the case study reported in this manuscript.
Data, Code, and Materials Transparency
The data and code supporting analyses for the case study reported in this manuscript are not publicly accessible. Due to the nature of this research, participants did not agree for their data to be shared publicly.
Design and Analysis Reporting Guidelines
Not applicable.
Transparency Declaration
The lead author (the manuscript’s guarantor) affirms that the manuscript provides an honest, accurate, and transparent account of the case study analyses presented as an example of using the framework discussed in this manuscript.
Replication Statement
Not applicable.
Disclosure statement
No potential conflict of interest was reported by the author(s).
Additional information
Funding
References
- Barnett, S., Yarosz, D., Thomas, J., & Hornbeck, A. (2006). Educational effectiveness of a Vygotskian approach to preschool education: A randomized trial (pp. 1–37). National Institute for Early Education Research.
- Bejar, I. (2012). Rater cognition: Implications for validity. Educational Measurement: Issues and Practice, 31(3), 2–9. https://doi.org/10.1111/j.1745-3992.2012.00238.x
- Bell, C. A., Dobbelaer, M. J., Klette, K., & Visscher, A. (2019). Qualities of classroom observation systems. School Effectiveness and School Improvement, 30(1), 3–27. https://doi.org/10.1080/09243453.2018.1539014
- Bell, C. A., Gitomer, D. H., McCaffrey, D. F., Hamre, B. K., Pianta, R. C., & Qi, Y. (2012). An argument approach to observation protocol validity. Educational Assessment, 17(2–3), 62–87. https://doi.org/10.1080/10627197.2012.715014
- Bell, C. A., Jones, N. D., Qi, Y., & Lewis, J. M. (2018). Strategies for assessing classroom teaching: Examining administrator thinking as validity evidence. Educational Assessment, 23(4), 229–249. https://doi.org/10.1080/10627197.2018.1513788
- Bell, C. A., Qi, Y., Croft, A. J., Leusner, D., McCaffrey, D. F., Gitomer, D. H., & Pianta, R. C. (2014). Improving observational score quality: Challenges in observer thinking. In T. J. Kane, K. A. Kerr, & R. C. Pianta (Eds.), Designing teacher evaluation systems: New guidance from the measures of effective teaching project (pp. 50–97). Jossey-Bass.
- Blyth, C. R. (1972). On Simpson’s paradox and the sure-thing principle. Journal of the American Statistical Association, 67(338), 364–366. https://doi.org/10.1080/01621459.1972.10482387
- Boston, M. (2012). Assessing instructional quality in mathematics. The Elementary School Journal, 113(1), 76–104. https://doi.org/10.1086/666387
- Brown, J. L., Jones, S. M., LaRusso, M. D., & Aber, J. L. (2010). Improving classroom quality: Teacher influences and experimental impacts of the 4Rs program. Journal of Educational Psychology, 102(1), 153–167. https://doi.org/10.1037/a0018160
- Campbell, S., & Ronfeldt, M. (2018). Observational evaluation of teachers: Measuring more than we bargained for? American Educational Research Journal, 55(6), 1233–1267. https://doi.org/10.3102/0002831218776216
- Cappella, E., Hamre, B. K., Kim, H. Y., Henry, D. B., Frazier, S. L., Atkins, M. S., & Schoenwald, S. (2012). Teacher consultation and coaching within mental health practice: Classroom and child effects in urban elementary schools. Journal of Consulting and Clinical Psychology, 80(4), 597–610. https://doi.org/10.1037/a0027725
- Carlisle, J., Kelcey, B., Berebitsky, D., & Phelps, G. (2011). Embracing the complexity of instruction: A study of the effects of teachers’ instruction on students’ reading comprehension. Scientific Studies of Reading, 15(5), 409–439. https://doi.org/10.1080/10888438.2010.497521
- Casabianca, J. M., Lockwood, J. R., & McCaffrey, D. F. (2015). Trends in classroom observation scores. Educational and Psychological Measurement, 75(2), 311–337. https://doi.org/10.1177/0013164414539163
- Casabianca, J. M., McCaffrey, D. F., Gitomer, D. H., Bell, C. A., Hamre, B. K., & Pianta, R. C. (2013). Effect of observation mode on measures of secondary mathematics teaching. Educational and Psychological Measurement, 73(5), 757–783. https://doi.org/10.1177/0013164413486987
- Charalambous, C. Y., & Praetorius, A-K. (2020). Creating a forum for researching teaching and its quality more synergistically. Studies in Educational Evaluation, 67, 8. https://doi.org/10/gwsf
- Cohen, J., Schuldt, L. C., Brown, L., & Grossman, P. (2016). Leveraging observation tools for instructional improvement: Exploring variability in uptake of ambitious instructional practices. Teachers College Record, 118, 1–36.
- Curby, T. W., Stuhlman, M. W., Grimm, K., Mashburn, A., Chomat-Mooney, L., Downer, J., Hamre, B. K., & Pianta, R. C. (2011). Within-day variability in the quality of classroom interactions during third and fifth grade. The Elementary School Journal, 112(1), 16–37. https://doi.org/10.1086/660682
- Danielson, C. (2007). Enhancing professional practice: A framework for teaching (2nd ed.). Association for Supervision & Curriculum Development.
- Gallimore, R., & Santagata, R. (2006). Researching teaching: The problem of studying a system resistant to change. In Strengthening research methodology: Psychological measurement and evaluation (pp. 11–28). American Psychological Association. https://doi.org/10.1037/11384-001
- Gore, J., Lloyd, A., Smith, M., Bowe, J., Ellis, H., & Lubans, D. (2017). Effects of professional development on the quality of teaching: Results from a randomised controlled trial of Quality Teaching Rounds. Teaching and Teacher Education, 68, 99–113. https://doi.org/10.1016/j.tate.2017.08.007
- Graham, M., Milanowski, A. T., & Miller, J. (2012). Measuring and promoting inter-rater agreement of teacher and principal performance ratings (No. ED532068). Center for Educator Compensation Reform. http://eric.ed.gov/?id=ED532068
- Gregory, A., Allen, J. P., Mikami, A. Y., Hafen, C. A., & Pianta, R. C. (2014). Effects of a professional development program on behavioral engagement of students in middle and high school. Psychology in the Schools, 51(2), 143–163. https://doi.org/10.1002/pits.21741
- Grossman, P., Cohen, J. J., & Brown, L. (2014). Understanding instructional quality in English language arts. In Designing teacher evaluation systems: New guidance from the measures of effecting project (pp. 303–331). Jossey-Bass.
- Grossman, P., Loeb, S., Cohen, J. J., & Wyckoff, J. (2013). Measure for measure: The relationship between measures of instructional practice in middle school English language arts and teachers’ value-added scores. American Journal of Education, 119(3), 445–470. https://doi.org/10.1086/669901
- Hamre, B. K., Hatfield, B., Pianta, R. C., & Jamil, F. (2014). Evidence for general and domain-specific elements of teacher–child interactions: Associations with preschool children’s development. Child Development, 85(3), 1257–1274. https://doi.org/10.1111/cdev.12184
- Hamre, B. K., Pianta, R. C., Mashburn, A., & Downer, J. T. (2012). Promoting young children’s social competence through the preschool PATHS curriculum and MyTeachingPartner professional development resources. Early Education & Development, 23(6), 809–832. https://doi.org/10.1080/10409289.2011.607360
- Hiebert, J., Gallimore, R., Garnier, H., Givvin, K. B., Hollingsworth, H., Jacobs, J., Chui, A. M.-Y., Wearne, D., Smith, M., Kersting, N., Manaster, A., Tseng, E., Etterbeek, W., Manaster, C., Gonzales, P., & Stigler, J. (2003). Teaching Mathematics in seven countries: Results from the TIMSS 1999 video study. National Center for Education Statistics. https://doi.org/10.1037/e610352011-003
- Jaeger, R. M. (1993). Live vs. Memorex: Psychometric and practical issues in the collection of data on teachers’ performances in the classroom. Center for Educational Research and Evaluation, University of North Carolina. http://eric.ed.gov/?id=ED360325
- Joe, J., Kosa, J., Tierney, J., & Tocci, C. (2013). Observer calibration. Teachscape.
- Kane, T. J., Staiger, D. O., McCaffrey, D., Cantrell, S., Archer, J., Buhayar, S., & Parker, D. (2012). Gathering feedback for teaching: Combining high-quality observations with student surveys and achievement gains. Bill & Melinda Gates Foundation, Measures of Effective Teaching Project. http://eric.ed.gov/?id=ED540960
- Kelcey, B., & Carlisle, J. (2013). Learning about teachers’ literacy instruction from classroom observations. Reading Research Quarterly, 48(3), 301–317. https://doi.org/10.1002/rrq.51
- Kim, H., Cameron, C. E., Kelly, C. A., West, H., Mashburn, A. J., & Grissmer, D. W. (2019). Using an individualized observational measure to understand children’s interactions in underserved kindergarten classrooms. Journal of Psychoeducational Assessment, 37(8), 935–956. https://doi.org/10.1177/0734282918819579
- Klette, K., & Blikstad-Balas, M. (2018). Observation manuals as lenses to classroom teaching: Pitfalls and possibilities. European Educational Research Journal, 17(1), 129–146. https://doi.org/10.1177/1474904117703228
- Klette, K., Blikstad-Balas, M., & Roe, A. (2017). Linking instruction and student achievement. A research design for a new generation of classroom studies. Acta Didactica Norge, 11(3), 10. https://doi.org/10.5617/adno.4729
- Kraft, M. A., & Hill, H. C. (2020). Developing ambitious mathematics instruction through web-based coaching: A randomized field trial. American Educational Research Journal, 57(6), 2378–2414. https://doi.org/10.3102/0002831220916840
- LaVenia, M., Cohen-Vogel, L., & Lang, L. B. (2015). The common core state standards initiative: An event history analysis of state adoption. American Journal of Education, 121(2), 145–182. https://doi.org/10.1086/679389
- Liu, S., Bell, C. A., Jones, N. D., & McCaffrey, D. F. (2019). Classroom observation systems in context: A case for the validation of observation systems. Educational Assessment, Evaluation and Accountability, 31(1), 61–95. https://doi.org/10.1007/s11092-018-09291-3
- McCormick, M. P., Cappella, E., O’Connor, E. E., & McClowry, S. G. (2015). Social-emotional learning and academic achievement: Using causal methods to explore classroom-level mechanisms. AERA Open, 1(3), 233285841560395. https://doi.org/10.1177/2332858415603959
- Milanowski, A. (2017). Lower performance evaluation practice ratings for teachers of disadvantaged students: Bias or reflection of reality? AERA Open, 3(1), 233285841668555. https://doi.org/10.1177/2332858416685550
- NGA Center for Best Practices, & CCSSO. (2010). Common core state standards: English language arts. National Governors Association Center for Best Practices, Council of Chief State School Officers. http://www.corestandards.org/
- Pianta, R. C., DeCoster, J., Cabell, S., Burchinal, M., Hamre, B. K., Downer, J., LoCasale-Crouch, J., Williford, A., & Howes, C. (2014). Dose–response relations between preschool teachers’ exposure to components of professional development and increases in quality of their interactions with children. Early Childhood Research Quarterly, 29(4), 499–508. https://doi.org/10.1016/j.ecresq.2014.06.001
- Pianta, R. C., Hamre, B. K., & Mintz, S. L. (2010). CLASS upper elementary manual. Teachstone.
- Plank, S. B., & Condliffe, B. (2013). Pressures of the season: An examination of classroom quality and high-stakes accountability. American Educational Research Journal, 50(5), 1152–1182. https://doi.org/10.3102/0002831213500691
- Praetorius, A.-K., & Charalambous, C. Y. (2018). Classroom observation frameworks for studying instructional quality: Looking back and looking forward. ZDM, 50(3), 535–553. https://doi.org/10.1007/s11858-018-0946-0
- Praetorius, A.-K., Klieme, E., Herbert, B., & Pinger, P. (2018). Generic dimensions of teaching quality: The German framework of Three Basic Dimensions. ZDM, 50(3), 407–426. https://doi.org/10.1007/s11858-018-0918-4
- Praetorius, A.-K., Lenske, G., & Helmke, A. (2012). Observer ratings of instructional quality: Do they fulfill what they promise? Learning and Instruction, 22(6), 387–400. https://doi.org/10.1016/j.learninstruc.2012.03.002
- Praetorius, A.-K., Pauli, C., Reusser, K., Rakoczy, K., & Klieme, E. (2014). One lesson is all you need? Stability of instructional quality across lessons. Learning and Instruction, 31, 2–12. https://doi.org/10.1016/j.learninstruc.2013.12.002
- Reyes, M. R., Brackett, M. A., Rivers, S. E., White, M., & Salovey, P. (2012). Classroom emotional climate, student engagement, and academic achievement. Journal of Educational Psychology, 104(3), 700–713. https://doi.org/10.1037/a0027268
- Rivers, S. E., Brackett, M. A., Reyes, M. R., Elbertson, N. A., & Salovey, P. (2013). Improving the social and emotional climate of classrooms: A clustered randomized controlled trial testing the RULER approach. Prevention Science : The Official Journal of the Society for Prevention Research, 14(1), 77–87. https://doi.org/10.1007/s11121-012-0305-2
- Rowan, B., & White, M. (2022). The common core state standards initiative as an innovation network. American Educational Research Journal, 59(1), 73–111. https://doi.org/10.3102/00028312211006689
- Schoenfeld, A. H. (2018). Video analyses for research and professional development: The teaching for robust understanding (TRU) framework. ZDM, 50(3), 491–506. https://doi.org/10.1007/s11858-017-0908-y
- Shadish, W. R., Cook, T. D., & Campbell, D. T. (2002). Experimental and quasi-experimental designs for generalized causal inference. Houghton Mifflin.
- Simmons, J. P., Nelson, L. D., & Simonsohn, U. (2011). False-Positive psychology: Undisclosed flexibility in data collection and analysis allows presenting anything as significant. Psychological Science, 22(11), 1359–1366. https://doi.org/10.1177/0956797611417632
- Simons, D. J., Shoda, Y., & Lindsay, D. S. (2017). Constraints on Generality (COG): A proposed addition to all empirical papers. Perspectives on Psychological Science : A Journal of the Association for Psychological Science, 12(6), 1123–1128. https://doi.org/10.1177/1745691617708630
- Slavin, R., & Madden, N. A. (2011). Measures inherent to treatments in program effectiveness reviews. Journal of Research on Educational Effectiveness, 4(4), 370–380. https://doi.org/10.1080/19345747.2011.558986
- Steinberg, M. P., & Garrett, R. (2016). Classroom composition and measured teacher performance: What do teacher observation scores really measure? Educational Evaluation and Policy Analysis, 38, 293–317. https://doi.org/10.3102/0162373715616249
- Steinberg, M. P., & Sartain, L. (2015). Does teacher evaluation improve school performance? Experimental evidence from Chicago’s excellence in teaching project. Education Finance and Policy, 10(4), 535–572. https://doi.org/10.1162/EDFP_a_00173
- Thierry, K. L., Vincent, R. L., & Norris, K. (2020). Teacher-level predictors of the fidelity of implementation of a social-emotional learning curriculum. Early Education and Development, 0(0), 1–15. https://doi.org/10.1080/10409289.2020.1849896
- Tong, F., Tang, S., Irby, B. J., Lara-Alecio, R., Guerrero, C., & Lopez, T. (2019). A process for establishing and maintaining inter-rater reliability for two observation instruments as a fidelity of implementation measure: A large-scale randomized controlled trial perspective. Studies in Educational Evaluation, 62, 18–29. https://doi.org/10.1016/j.stueduc.2019.04.008
- White, M. (2021, August 31). Moving from institutional practices to challenging the robustness of conclusions: The case of rater Error [Invited Keynote]. QUINT PhD Summer Institute 2021.
- White, M. (2022). 3. A validity framework for the design and analysis of studies using standardized observation systems. In M. Blikstad-Balas, K. Klette, & M. Tengberg (Eds.), Ways of analyzing teaching quality: Potentials and pitfalls (pp. 89–120). Scandinavian University Press. https://doi.org/10.18261/9788215045054-2021
- White, M. C. (2018). Rater performance standards for classroom observation instruments. Educational Researcher, 47(8), 492–501. 0013189X18785623. https://doi.org/10.3102/0013189X18785623
- White, M. C., Rowan, B., Alter, G., Blankenship, L., Greene, C., & Windisch, S. (2018). User guide to the measures of effective teaching longitudinal database (MET LDB). The University of Michigan.
- White, M., Maher, B., & Rowan, B. (2022). Common core-related shifts in english language arts teaching from 2010 to 2018: A video study. The Elementary School Journal.
- White, M., & Ronfeldt, M. (2021). Monitoring rater quality in observational systems: Issues due to unreliable estimates of rater quality. University of Michigan.
- Wilhelm, A. G., Rouse, A. G., & Jones, F. (2018). Exploring differences in measurement and reporting of classroom observation inter-rater reliability. Practical Assessment, Research & Evaluation, 23(4), 16.
- Woehr, D. J., & Huffcutt, A. I. (1994). Rater training for performance appraisal: A quantitative review. Journal of Occupational and Organizational Psychology, 67(3), 189–205. https://doi.org/10.1111/j.2044-8325.1994.tb00562.x