
 ?Mathematical formulae have been encoded as MathML and are displayed in this HTML version using MathJax in order to improve their display. Uncheck the box to turn MathJax off. This feature requires Javascript. Click on a formula to zoom.
Abstract
Randomized controlled trials have proliferated in education, in part because they provide an unbiased estimator for the causal impact of interventions. It is increasingly recognized that many such trials in education have low power to detect an effect if indeed there is one. However, it is less well known that low powered trials tend to systematically exaggerate effect sizes among the subset of interventions that show promising results ( We conduct a retrospective design analysis to quantify this bias across 22 such promising trials, finding that the estimated effect sizes are exaggerated by an average of 52% or more. Promising trial bias can be reduced ex-ante by increasing the power of the trials that are commissioned and guarded against ex-post by including estimates of the exaggeration ratio when reporting trial findings. Our results also suggest that challenges around implementation fidelity are not the only reason that apparently successful interventions often fail to subsequently scale up. Instead, the effect from the initial promising trial may simply be exaggerated.
Introduction
Randomized controlled trials (RCTs) have proliferated in education research in recent years (Connolly et al., Citation2018). Funders are attracted to descriptions of a “gold standard” research design (Pocock, Citation1982), policy makers have emphasized the importance of subjecting educators’ views to rigorous tests (e.g., Haynes et al., Citation2012), and researchers are drawn to an unbiased estimator for the causal impact of interventions (e.g., Torgerson & Torgerson, Citation2001). In England, the publicly-funded Education Endowment Foundation (EEF) has now completed over 100 such RCTs (Dawson et al., Citation2018). In the US, the Every Student Succeeds Act privileges RCTs as providing “Tier I” evidence and the Institute of Education Science has now commissioned over 350 RCTs (Hedges & Schauer, Citation2018).
Despite the increasing popularity of RCTs in education—and the gradual accumulation of both null and positive results—an awareness of their limitations is growing. For example, researchers have shown that many education trials have statistical power well below 80% to detect effects of the magnitudes commonly found in the education literature (Cheung & Slavin, Citation2016; Spybrook et al., Citation2016; Torgerson et al., Citation2005). This leads to trials that neither provide good evidence in support of an effect, nor evidence that there is no effect. Indeed, Lortie-Forgues and Inglis (Citation2019) estimate that 40% of education RCTs are uninformative with respect to impact.
We address a related limitation of RCTs in education. Rather than focusing on when trials do not provide any evidence one way or another, we focus instead on when trials conclude that there is an effect of a given magnitude, but this finding is erroneous. More specifically, we ask: when a researcher concludes from an education RCT that an intervention does indeed have an effect, to what extent is the estimated effect an exaggeration of the true impact (Type-M, or magnitude error) and how likely is the true effect to be in the other (negative) direction (Type-S, or sign error) (Gelman & Carlin, Citation2014)? Despite RCTs providing an unbiased estimator in general, we find that estimates from education RCTs deemed to show promising results () display surprisingly high levels of Type M error. By contrast, we find that Type S errors are unlikely in such trials.
It should be noted that the Type M error we identify is not the familiar (mean zero) random error that is inherent to all RCTs. Rather, this error constitutes systematic upward bias of effect sizes among trials that find statistically significant results. This leads “warehouses” or “toolkits” listing promising education interventions to contain inflated effect size estimates and means that promising results are less likely to replicate in subsequent trials. We refer to this as promising trials bias. Given that this results from conditioning the set of trials under consideration on their p values, it can be thought of as the study-level analogue of survivor bias: when differential dropout of observations renders a sample unrepresentative of the population of interest. Analogously, while in general RCTs have mean zero error, the set of trials that identify statistically significant results are no longer representative of RCTs in general and tend to overestimate effect sizes.
This research is closely related to several strands of the recent academic literature. In particular, it builds on work by Gelman and Tuerlinckx (Citation2000) and Gelman and Carlin (Citation2014) concerned with the lack of information often conveyed by RCTs, even when p < 0.05. We apply this thinking to the education setting, using empirical data to quantify the extent of this problem for the field. In that sense, our research is analogous to work by Button et al. (Citation2013), which showed that underpowered studies in neuroscience lead to overestimated effect sizes and a lack of reproducibility. By estimating the extent to which an identical study of an apparently promising intervention would produce a different result, our analysis is also relevant to recent work on the relationship between p values and replicability of research (Anderson, Citation2020; Colquhoun, Citation2017; Makel & Plucker, Citation2014; Vasishth et al., Citation2018). Our suggestions for using external information (assumed effect sizes taken from the literature) to interpret the results from education trials are also related to those recently made by Deke and Finucane (Citation2019).
In the first section of the paper, we begin by setting out a conceptual framework for understanding erroneous findings in RCTs, using an adapted version of the diagrams developed by Gelman and Tuerlinckx (Citation2000). Then we set out our empirical approach to estimating the probability and severity of erroneous findings, paying particular attention to our use and selection of assumed effect sizes. Next, we report our estimates of Type M and Type S errors in 22 “promising” RCTs (all deemed to have provided evidence of efficacy based in part on ). Finally, we conclude with a discussion of the implications of our findings for the design, analysis, interpretation, and commissioning of RCTs in education research.
Conceptualizing Erroneous Findings in Trials
To bring clarity to the idea of erroneous findings, it is helpful to briefly restate the basis on which we would expect to obtain unbiased causal estimates of impact from RCTs. Individuals who could be exposed to a policy or program have two potential outcomes, one which would be observed if they were exposed to the treatment and another which would be observed if they were not so exposed. To quantify the effect of the intervention, we would like to calculate the average treatment effect. This is equal to the mean of the differences between individuals’ two possible outcomes (i.e., the outcome if they received the treatment and the outcome if they did not). Unfortunately, it is never possible to observe both of these quantities for a single individual, as clearly no one can be simultaneously exposed to, and not exposed to, a treatment.
However it is possible for us to randomly assign individuals to treatment and control groups in an RCT. By calculating the difference in the mean outcomes in these groups, we are able to produce an estimate of
Although we know that
and
are equal in expectation, across many hypothetical repetitions of the random allocation process (Holland, Citation1986), for any given instantiation of an RCT it is possible that
The inequality between D and
in individual RCTs is the main focus of this paper. More specifically, we study two ways of characterizing the estimation error of
with respect to D. First, Type M [magnitude] error, which can now be defined as cases in which D
and
has p
The magnitude of Type M error, also known as the exaggeration ratio, is equivalent to
(assuming D is not equal to zero). Second, Type S [sign] error, which is present when (
D < 0) or
) and
has p <
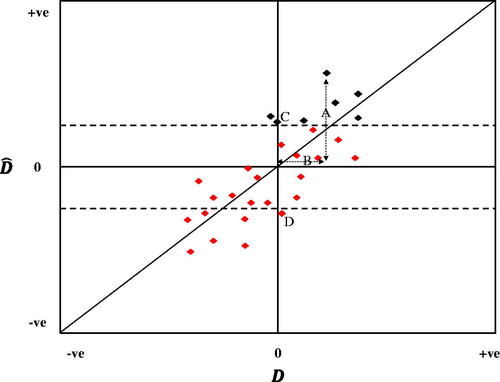
The distinction between these types of error can be further clarified visually by extending the diagram originally used by Gelman and Tuerlinckx (Citation2000) to illustrate Type S error. shows a hypothetical, purely illustrative plot of D and across many perfectly implemented RCTs of different interventions which, for simplicity, have been assumed to have identical standard errors. Points within the dotted lines indicate estimates that are not significantly different from zero, points outside the dotted lines indicate estimates that are. The trials in black might be considered to be “promising” in that they have
and p <
By construction, all of the trials represented by black dots display some degree of Type M error, since all of them have p <
and none of them fall on the 45-degree line on which D
The trial with the highest value of
shows Type M error of magnitude A/B, since D
and p <
The trial labeled D is a case of Type S error in that
(x axis) but
(y axis) and p <
Figure 1. Illustrating Type M, false positive and Type S errors in trials.
Erroneous Findings, Statistical Power and the Statistical Significance Filter
The previous sections illustrate how impact estimates from specific RCTs will in general diverge from the true effect, given finite sample size. This is not particularly problematic in and of itself since these errors have a mean of zero across trials and statistical inference accounts for the random error inherent to trials. However, our focus in this paper is on a specific subset of RCTs: those that have been deemed to show evidence of impact based on p < Amongst this group of trials, we would expect Type M errors to systematically inflate estimated effect sizes, a problem we refer to as promising trials bias. To see why, consider that when
= 0.05 an estimate must be 1.96 standard errors away from zero to be declared a discovery, and the most exaggerated estimates are systematically more likely to clear this threshold. In effect, the requirement for p <
means that, the less exaggerated a result is, the more likely it is to be filtered out from being a declared a discovery.
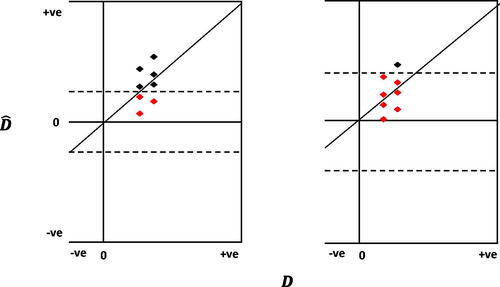
This “statistical significance filter” can also be seen in . The two panels show the same set of RCT point estimates, but with the estimates in the right-hand panel assumed to come from trials with lower power, and all else equal. Increased standard errors mean only one of the five point estimates with in the left-hand panel remains so in the right-hand panel, and this is the estimate with the largest Type M error. The relationship between power (or sample size) and Type M error can also be explicitly calculated for any given true effect size and alpha level (using Gelman and Carlin (Citation2014) retrodesign() R function. For instance, shows this relationship for d = 0.06 (the mean effect size found by Lortie-Forgues and Inglis (Citation2019) in their analysis of EEF and NCEE trials) and
= 0.05, among trials with
As shown in , as power approaches 1, the exaggeration ratio also approaches 1 (indicating no exaggeration). Conversely, when trials have lower power, effect size estimates for promising interventions tend to be more exaggerated.
Figure 2. The relationship between the power of a trial and the exaggeration ratio (Type M error), assuming D = 0.06, α = 0.05, and p < α. Notes: The thin gray line shows that the exaggeration ratio for a trial with power of 0.8 is close to one (no exaggeration).
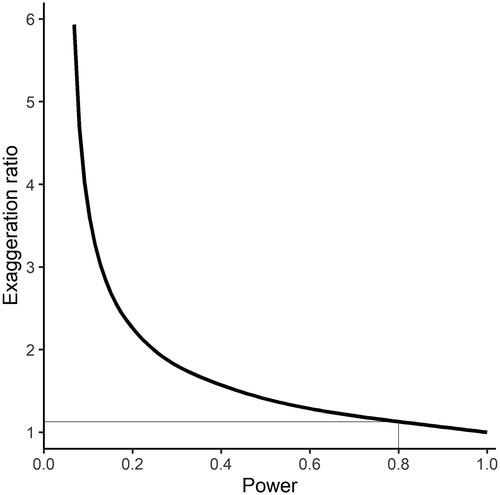
Figure 3. Lower powered studies inflate Type M error. Notes: Hypothetical data for illustrative purposes. The right panel assumes all else is equal to the left panel, besides the power of the studies.
Where decisions about commissioning scale-up or replication trials are based on lower-powered initial trials showing promising results, promising trials bias will create difficulties with replication since the most exaggerated trials are also the least likely to replicate in terms of estimated effect sizes or p < (Button et al., Citation2013; Vasishth et al., Citation2018). Consider, for example, the Education Endowment Foundation’s (EEF) approach to commissioning. They conduct initial “efficacy” trials (with relatively small samples, under ideal conditions) and then deem a subset of these interventions to be “promising” based on the results. Promising interventions are then often tested in subsequent “effectiveness” trials (with larger samples and under everyday conditions). Promising trials bias means we would expect impact estimates from promising efficacy trials to reduce in size in subsequent effectiveness trials due to a process of mean reversion. In the rest of the paper, we aim to quantify this effect.
Method
Estimating Type-M and Type-S Error
In Section “Erroneous Findings, Statistical Power and the Statistical Significance Filter,” we set out how RCTs provide an unbiased estimator for the causal impact of an intervention but, when we focus on a specific estimate from a single trial, sampling variation means that the estimate will very likely contain error of some magnitude. The retrospective design analysis (Gelman & Carlin, Citation2014) that we conduct here aims to move back in the other direction (from the specific trial to the general) by asking: for each published RCT, what results would we be likely to obtain under hypothetical replications of the study? Doing so requires us to adopt a probability model, which specifies the assumed probability distribution for the effect size estimates that would be obtained in a hypothetical replication of the trial ().
Following Gelman and Carlin (Citation2014), the probability model for is a normal distribution defined by two quantities. The first is an assumption about the true effect size (
). This centers the probability model by determining the most likely effect size estimate to be obtained in a hypothetical replication. This assumption plays a critical role in design analysis and we hence discuss it at some length in Section “Selection and Justification of Assumed Effect Sizes.” The second quantity that defines the probability model for
is the standard error of the estimated effect in the original trial. This determines the variance in the effect size estimates that would be obtained under hypothetical replications. The third quantity necessary for our analysis is the statistical significance threshold
which determines the region of the probability model for
in which a hypothetical replication is far enough from zero that it would be declared a discovery (Gelman & Tuerlinckx, Citation2000). Using these elements, we can estimate the expected magnitude of Type M error by repeatedly simulating draws from this probability model and averaging the differences between
and
for all draws of
more than 1.96
SE way from zero (in the case of
). Note that the effect size estimate from the original trial (
is not used in this process. We estimate the probability of Type S error by calculating the proportion of the probability model that protrudes more than 1.96
SE in the opposite direction (+/−) to the true effect, D. We implement this using the R function retrodesign() (Gelman & Carlin, Citation2014), but note that this can also be done using the Stata module rdesigni (Klein, Citation2017).
Sample of RCTs
Recall that our motivation is to understand erroneous findings in trials that have been deemed to show promising results. Our empirical analysis therefore employs the largest set of published education trials that are systematically replicated when they show evidence of impact—those commissioned by the Education Endowment Foundation. This constitutes over 100 published trials, 22 of which have been deemed to show “promising” results by the EEF at some point (Foliano et al., Citation2019; Gorard et al., Citation2014, Citation2015a, Citation2015b, Citation2017; Hodgen et al, Citation2019; Jay et al., Citation2017; Lord et al., Citation2015; McNally et al., Citation2016; Miller et al., Citation2016; Motteram et al., Citation2016; Nunes et al., Citation2018; Nunes et al., Citation2019; Patel et al., Citation2017; Rienzo et al., Citation2015; Sibieta et al., Citation2016; Speckesser et al., Citation2018; Stokes et al., Citation2018; Styles & Bradshaw Citation2015; Torgerson et al., Citation2018; Tracey et al., Citation2019; Worth et al., Citation2015; Wright et al., Citation2019; all are marked with an * in the reference list). In cases where trials are deemed to have shown promising results, and where the intervention developer is happy to cooperate on further research, the EEF commissions a further trial of the original intervention. Of the 22 trials in our sample, 8 have so far been replicated and had their results published (marked with a † in the reference list).
The EEF maintains a list of interventions deemed to have shown promising results on their website.Footnote1 Their most recent guidance (Education Endowment Foundation, Citation2020) explicitly rejects the use of p < 0.05 as a cutoff for declaring a trial to have shown promising results, stating that they rely instead on a combination of the estimated effect size and a “continuous” (i.e., not dichotomized around 0.05) p value (EEF, Citation2020). Since our estimates of Type M and Type S error are a function of the level, this poses something of a challenge for our analysis.
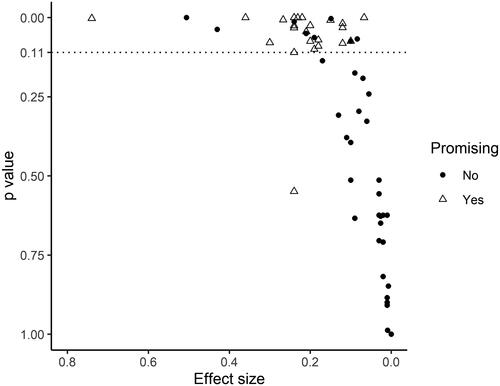
shows a scatter plot of all first-stage EEF trials that yielded a positive effect size estimate, with the p value on the x axis (reversed) and the effect size on the y axis. Where trials analyze multiple outcomes and associated p values, we plot the lowest p value for that trial. Our justification for using the lowest p value is that these are the only results that we know unambiguously to be deemed as “promising” by the EEF. Triangles are those initial (or “efficacy”) trials that were deemed “promising” and for which a replication (or “effectiveness”) trial was subsequently commissioned. It is clear from the graph that there is a sharp increase in the probability of trials being recommissioned when the lowest p value is below 0.11 (above the dotted horizontal line). In addition, when p is less than 0.11, the probability of a trial being deemed promising (and recommissioned) seems unrelated to effect size. We therefore adopt as the EEF’s implicit
in our calculation of Type M and Type S errors. This requires excluding from our analysis one trial that the EEF had previously deemed promising despite p > 0.11.
Figure 4. Scatterplot of EEF first-stage trials. Notes: Vertical axis shows the lowest p value in each EEF trial and horizontal axis shows the effect size associated with that p value. Number of trials = 59. Triangles are trials of interventions deemed to have been “promising” by EEF at any point.
We acknowledge that this implicit is somewhat out of line with the social scientific literature, where p < 0.05 remains the dominant convention for rejecting the null and declaring a discovery. Accordingly, in Appendix , we report a parallel set of results for trials that reported p < 0.05 using
in our calculations of Type M and Type S error. This set of results is more in line with what might be expected from the academic literature in general. As an additional sensitivity test, we also conducted an alternative version of our analysis at the trial level, in which we aggregate all results from within a trial. The methods and results of this alternative analysis are set out in Appendix B.
Selection and Justification of Assumed Effect Sizes
As noted above, the calculation of a trial’s Type M/S error relies on an assumption about the true effect size. Gelman and Carlin (Citation2014, p. 642) recommend thinking about the true effect as “that which would be observed in a hypothetical infinitely large sample.” This makes sense in that, in a well-implemented RCT, bias approaches zero as the sample grows toward infinity (Imai et al., Citation2008). While this provides a precise way of conceptualizing the true effect size, it leaves open the question of how to determine the value of the assumption in each case.
What would constitute an ideal source of evidence for our assumed effect size (AES)? First, our AES would ideally be derived from a separate experimental study using standardized tests as outcome measures (similar to those used in EEF trials) or, where available, meta-analysis of all relevant studies using such methods (Gelman & Carlin, Citation2014). Second, the external studies should be of a similar intervention, targeting a similar subject, in a similar age/grade (Cheung & Slavin, Citation2016; Kraft, Citation2020). Third, the external studies should be free from publication bias (Gage et al., Citation2017). The next three paragraphs describe the three different sources we use for our AES and briefly discuss their strengths and weaknesses, which are also summarized in .
Table 1. Comparing the three sources of assumed effect size (AES).
Our first source of AES is a recent meta-review of 750 education RCTs that used standardized tests as outcome measures (Kraft, Citation2020). In particular, we use the median effect size for the grade of the pupils enrolled in each of the trials in our sample, for the subject (mathematics or English) targeted by the intervention (see Appendix ). The strength of this source of AES is that it is summarizes information from a very wide range of studies and tailors these to both grade and subject for each of the trials in our sample. The corresponding downside is that it is potentially infected by publication bias.
Our second source of AES is the National Center for Education Evaluation (NCEE) database of trials. The NCEE is similar to the EEF in that it uses government funding to run RCTs of interventions that have previously shown promise and then publishes the results in a transparent way, regardless of the outcome. From this, we derived our second set of AES based on the average NCEE effect size in the subject area being targeted by each of the trials in our sample. In cases where the EEF trial targeted multiple subjects, we use the outcome associated with the lowest p value (for the same reasons given above). An important strength of this source is that it constitutes a highly analogous, out-of-sample set of trial results, which is free from publication bias and can be applied to all of the trials in our sample. However, while this source tailors the AES to the subject domain being targeted by each of the interventions in our sample trials, it does not tailor the AES to the age/grade or the specifics of the intervention. Nevertheless, the trials are all of interventions that have shown promising evidence in previous evaluations, suggesting they will be broadly comparable to those in EEF trials.
Our third set of AES are specific to each EEF intervention and are derived from evaluations of similar interventions published in the academic literature. In order to maximize comparability of effect sizes, we restrict these to evaluations using experimental designs and employing standardized tests as outcome measures (Gelman & Carlin, Citation2014; Cheung & Slavin, Citation2016). Where possible, we relied on the results of meta-analyses summarizing experimental studies that employed standardized tests as outcome measures, in order to get the most complete picture of the existing literature. To ensure a thorough search was conducted, two team members independently searched for suitable studies from which to derive AES for all 22 interventions in our sample. Using this approach, we were able to identify appropriate intervention-specific AES for 8 of the 22 trials in our sample (the sources and justification for each of these are set out in Appendix A ). For the other 14 trials, we could not find any suitable study for a similar intervention from which to derive intervention specific AES. The advantage of this final source of AES is that they are tailored directly to each intervention. The disadvantage is that they may be subject to publication bias and are not available for 14 of our 22 trials.
Results: Type M and Type S Error
In , we present estimates of the Type M error (left panel) and Type S error (right panel) for each trial, for each of the three sources of AES. The white diamonds indicate the mean Type M error reported as a ratio (left hand panel) and the mean Type S error reported as a probability (right hand panel). The NCEE AES yield the largest and most dispersed estimates of both types of error, followed by the Kraft AES and then the intervention-specific AES. This in part reflects the smaller average effect sizes found in NCEE trials, which might be expected, given that they employ standardized test as outcome measures and publish trial findings regardless of the results. shows a numerical summary of the results.
Figure 5. Type M and Type S error by source of assumed effect size (AES). Notes: Vertical axis in the left-hand panel shows the exaggeration ratio. Vertical axis in the right-hand panel shows the probability. Each dot is a trial. Diamonds show the mean.
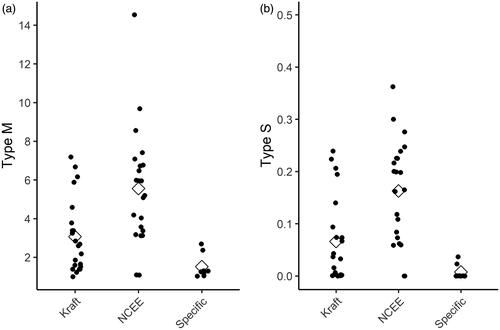
Table 2. Type S and Type M error estimates under different assumed effect size (AES).
Our estimates of mean Type M error range from 1.52 (intervention specific AES) through 3.08 (Kraft AES) up to 5.55 (NCEE AES). While these results are clearly somewhat different in magnitude, the findings suggest that trials of the sort analyzed here show large Type M error across all three sets of assumptions we make about D. Further, as makes clear, these means conceal wide variation across trials. Even when we use our intervention specific AES, very few individual trials have a Type M error estimate close to one. In Appendix , we show the equivalent results for the subset of trials with p < 0.05 (as opposed to p < 0.11) and assuming The mean Type M error falls to 1.20 when we use our intervention specific AES, although this is based on just four interventions. The mean Type M under the Kraft and NCEE assumptions fall slightly to 2.85 and 5.85, respectively. Our alternative analysis at the trial (rather than result) level yielded comparable results (see Appendix B). In sum, across all our analyses, we find consistent evidence of substantial promising trial bias in this sample of RCTs.
Our estimates of the mean probability of Type S error range from 1% (intervention specific AES) through 7% (Kraft AES) up to 16% (NCEE AES). Whilst the latter two results arguably represent sizable probabilities that a positive finding in fact reflects negative impact, our intervention specific AES suggests a very low mean probability of Type S error. By contrast with our findings relating to Type M error then, our findings cannot be said to be robust to our choice of AES for D. For the Kraft and NCEE AES, there is again wide variation at the level of individual trials, with, e.g., half of trials having an estimated probability of Type S error above 20% based on the NCEE AES. When we restrict the sample to trials with p < 0.05 and assume the mean Type S is even smaller. In sum, in our sample, when an intervention has been trialed and been found to show promising results (
and p <
), the probability that its true effect is in fact negative is low.
Discussion
We set out to investigate the prevalence and magnitude of promising trials bias in education RCTs. Even when using our intervention specific AES—which result in our lowest estimates of Type M error—we find that the average promising trial in our sample exaggerates the true effect size by 52%. Arguably the most reasonable AES to use in such calculations are those derived from NCEE trials, since this constitutes a highly analogous out-of-sample benchmark, not affected by publication bias. Using the NCEE assumptions, the estimated effect sizes in our sample exaggerate the true effect sizes by a factor of 5.55 on average. Indeed, regardless of which of the three sets of assumptions that we employ, we would expect the estimated effects in a set of trials showing promising results to be quite substantially exaggerated. These results graphically illustrate the very limited information contained within point estimates of “promising” findings from low-powered education trials.
Limitations
These findings should, of course, be interpreted in light of the limitations of this study. Since we set out to make claims about the probability of a hypotheses conditional on the data, it was necessary for us to invoke assumes effect sizes in our analysis. The true value of D cannot be known with certainty and our conclusions depend on the accuracy of the assumptions we have made. Having said that, we believe our setting is unusually well suited to providing good empirical benchmarks to inform these AES. First, we were able to draw on three different empirical sources in order to calibrate our AES. Though none of these is ideal (see ) they collectively provide good evidence about the effect sizes that might be expected. Most importantly, our finding of large Type M errors is insensitive to which of the three AES we use. Another limitation relates to our sample. Our focus on promising trials limited us to just 22 EEF RCTs. Future work should therefore look to expand this research, as and when more trials are published.
Implications
Given the magnitude of the Type M errors we observed across our sample of deemed-to-be-promising trials, it is clear that promising trials bias is an important issue for trial commissioners. We suggest that funders should supplement effect sizes and p values with retrospective design analyses of the sort conducted here when deciding whether to commission additional trials of previously evaluated interventions. Some trials with p < 0.05 are very unlikely to replicate on any plausible AES and funders should consider this when making decisions about whether to fund follow-up (effectiveness) trials. In addition, funders should increase the power of all of the trials that they do commission. This would, of course, increase the cost of these trials. However, it would also reduce the amount of money that funders waste on follow-up (effectiveness) trials based on exaggerated findings from poorly powered initial trials.
The findings also have implications for educators looking to understand the costs and benefits of different programmes or interventions. In particular, it would be prudent for them to expect smaller effects than would be suggested by single trial results listed in “warehouses” or “toolkits” of promising interventions. The statistical significance filter means that these are likely substantially upwardly biased.
In addition, these findings have implications for researchers who design and analyze RCTs. We believe that researchers should consider using prospective design analysis when planning RCTs in education. In particular, the information regarding the potential for Type M error in trials of different sizes complements calculations regarding the minimum detectable effect size. Gelman and Carlin summarize this as moving from asking only “What is the power of a test?” to also asking “What might be expected to happen in [future] studies of this size?” (2014, p. 649). Trial analysts should also report retrospective estimates of Type M errors in order to give readers the answer to the question: how likely is it that an exact replication of this trial would come to a different conclusion? The two general sources of empirical evidence for AES that we set out in this paper provide a useful starting point for researchers looking to conduct either prospective or retrospective design analysis.
Our findings also prompt two further reflections about impact evaluation more generally. First, our analysis raises questions about the appropriateness of elevating RCTs above other evaluation designs in education. RCTs sidestep the fundamental problem of causal inference at the cost of replacing it with the challenge of randomization inference. In education, where effect sizes tend to be small (Kraft, Citation2020), this is problematic, since many trials end up having low power and yielding uninformative findings (Lortie-Forgues & Inglis, Citation2019). Observational evaluation designs such as matching and comparative interrupted time series do not constitute unbiased estimators in the way that RCTs do. However, they often have much larger sample sizes and empirical research shows that such non-experimental designs come close to reproducing those from education trials on average, without the attendant problems with power (Clair et al., Citation2016; Cook, Citation2017; Sims et al., Citation2022; Weidmann & Miratrix, Citation2020). At the very least, this suggests that evidence from a range of rigorous large-scale observational evaluations should be seen as complementary, rather than inferior, to RCTs.
Second, our research raises questions about the significance of implementation fidelity in challenges around “scaling up” interventions. Many other researchers have noticed that scale-up or effectiveness trials often find smaller effects than are found in initial or efficacy trials of the same intervention (e.g., Protzko & Schooler, Citation2017). In education, researchers almost always account for this with reference to the difficulties of maintaining fidelity when an intervention is implemented at scale (e.g., Elmore, Citation1996; Fletcher-Wood & Zuccollo, Citation2020; Honig, Citation2006). Our analysis suggests a different, or at least supplementary, account. In a context where initial efficacy trials tend to have low power, the statistical significance filters means that we would expect smaller—perhaps much smaller—effects in subsequent effectiveness trials, even if implementation fidelity was perfectly maintained. Thus, researchers cannot simply point to difficulties in implementation when scale-up trials fail to replicate initially promising results.
Open Research Statements
Study and Analysis Plan Registration
There is no registration associated with the case study reported in this manuscript.
Data, Code, and Materials Transparency
The data (https://doi.org/10.6084/m9.figshare.19787296) and code (https://doi.org/10.6084/m9.figshare.19787344.v1) that support the findings of this study are openly available on figshare.
Design and Analysis Reporting Guidelines
Not applicable.
Transparency Declaration
The lead author (the manuscript's guarantor) affirms that the manuscript provides an honest, accurate, and transparent account of the study being reported. No important aspects of the study have been omitted, and any discrepancies from the study as planned have been explained.
Replication Statement
Not applicable.
Notes
1 The list can be found here. Please note that interventions are also removed from this list if subsequent trials of the same intervention to do not find an effect. https://educationendowmentfoundation.org.uk/tools/promising
References
- Anderson, S. F. (2020). Misinterpreting p: The discrepancy between p values and the probability the null hypothesis is true, the influence of multiple testing, and implications for the replication crisis. Psychological Methods, 25(5), 596–609. https://doi.org/10.1037/met0000248
- Button, K. S., Ioannidis, J. P., Mokrysz, C., Nosek, B. A., Flint, J., Robinson, E. S., & Munafo, M. R. (2013). Power failure: Why small sample size undermines the reliability of neuroscience. Nature Reviews. Neuroscience, 14(5), 365–376.
- Cheung, A. C., & Slavin, R. E. (2016). How methodological features affect effect sizes in education. Educational Researcher, 45(5), 283–292. https://doi.org/10.3102/0013189X16656615
- Clair, T., Hallberg, K., & Cook, T. D. (2016). The validity and precision of the comparative interrupted time-series design: Three within-study comparisons. Journal of Educational and Behavioral Statistics, 41(3), 269–299. https://doi.org/10.3102/1076998616636854
- Colquhoun, D. (2017). The reproducibility of research and the misinterpretation of p-values. Royal Society Open Science, 4(12), 171085. https://doi.org/10.1098/rsos.171085
- Connolly, P., Keenan, C., & Urbanska, K. (2018). The trials of evidence-based practice in education: A systematic review of randomised controlled trials in education research 1980–2016. Educational Research, 60(3), 276–291. https://doi.org/10.1080/00131881.2018.1493353
- Cook, T. (2017). Empirical demonstrations of the internal validity of certain quasi-experimental designs. https://cspv.colorado.edu/blueprints/tom-cook-talks-october-13-2017/tom_cook_technical_talk_presentation_2017-10-13.pptx
- Dawson, A., Yeomans, E., & Brown, E. R. (2018). Methodological challenges in education RCTs: Reflections from England’s Education Endowment Foundation. Educational Research, 60(3), 292–310. https://doi.org/10.1080/00131881.2018.1500079
- Deke, J., & Finucane, M. (2019). Moving beyond statistical significance: the BASIE (BAyeSian Interpretation of Estimates) framework for interpreting findings from impact evaluations. U.S. Department of Health and Human Services.
- Education Endowment Foundation. (2020). Statement on statistical significance and uncertainty of impact estimates for EEF evaluations. https://educationendowmentfoundation.org.uk/public/files/Evaluation/Writing_a_Research_Report/Statement_on_statistical_significance_and_uncertainty_of_impact_estimates_for_EEF_evaluations
- Elmore, R. (1996). Getting to scale with good educational practice. Harvard Educational Review, 66(1), 1–26. https://doi.org/10.17763/haer.66.1.g73266758j348t33
- Fletcher-Wood, H., & Zuccollo, J. (2020). The effects of high-quality professional development on teachers and students: A rapid review and meta-analysis. Education Policy Institute.
- Foliano, F., Rolfe, H., Buzzeo, J., Runge, J., & Wilkinson, D. (2019). Changing mindsets effectiveness trial: Evaluation report and executive summary. Education Endowment Foundation.†
- Klein, D. (2017). RDESIGNI: Stata module to perform design analysis, Statistical Software Components S458423. Boston College Department of Economics.
- Gage, N. A., Cook, B. G., & Reichow, B. (2017). Publication bias in special education meta-analyses. Exceptional Children, 83(4), 428–445. https://doi.org/10.1177/0014402917691016
- Gelman, A., & Carlin, J. (2014). Beyond power calculations: Assessing Type S (Sign) and Type M (magnitude) errors. Perspectives on Psychological Science, 9(6), 641–651.
- Gelman, A., & Tuerlinckx, F. (2000). Type S error rates for classical and Bayesian single and multiple comparison procedures. Computational Statistics, 15(3), 373–390. https://doi.org/10.1007/s001800000040
- Gorard, S., Siddiqui, N., & Huat See, B. (2014). Switch-on reading: Evaluation report and executive summary. Education Endowment Foundation.*†
- Gorard, S., Siddiqui, N., & Huat See, B. (2015a). Philosophy for children: Evaluation report and executive summary. Education Endowment Foundation.*
- Gorard, S., Siddiqui, N., & Huat See, B. (2015b). Accelerated Reader: Evaluation report and executive summary. Education Endowment Foundation.*
- Gorard, S., Siddiqui, N., Huat See, B., Smith, E., & White, P. (2017). Children’s university: Evaluation report and executive summary. Education Endowment Foundation.*
- Haynes, L., Service, O., Goldacre, B., & Torgerson, D. (2012). Test, learn, adapt: Developing public policy with randomised controlled trials. UK Cabinet Office.
- Hedges, L. V., & Schauer, J. (2018). Randomised trials in education in the USA. Educational Research, 60(3), 265–275. https://doi.org/10.1080/00131881.2018.1493350
- Hodgen, J., Adkins, M., Ainsworth, S., & Evans, S. (2019). Catch up numeracy: Evaluation report and executive summary. Education Endowment Foundation.†
- Holland, P. W. (1986). Statistics and causal inference. Journal of the American Statistical Association, 81(396), 945–960. https://doi.org/10.1080/01621459.1986.10478354
- Honig, M. I. (2006). New directions in education policy implementation. State University of New York Press.
- Imai, K., King, G., & Stuart, E. A. (2008). Misunderstandings between experimentalists and observationalists about causal inference. Journal of the Royal Statistical Society: Series A (Statistics in Society), 171(2), 481–502. https://doi.org/10.1111/j.1467-985X.2007.00527.x
- Jay, T., Willis, B., Thomas, P., Taylor, R., Moore, N., Burnett, C., Merchant, G., & Stevens, A. (2017). Dialogic teaching: Evaluation report and executive summary. Education Endowment Foundation.*
- Kraft, M. A. (2020). Interpreting effect sizes of education interventions. Educational Researcher, 49(4), 241–253. https://doi.org/10.3102/0013189X20912798
- Lord, P., Bradshaw, S., Stevens, E., & Styles, B. (2015). Perry beaches coaching programme: Evaluation report and executive summary. Education Endowment Foundation.*
- Lortie-Forgues, H., & Inglis, M. (2019). Rigorous large-scale educational RCTs are often uninformative: Should we be concerned? Educational Researcher, 48(3), 158–166. https://doi.org/10.3102/0013189X19832850
- Lynch, K., Hill, H. C., Gonzalez, K. E., & Pollard, C. (2019). Strengthening the research base that informs STEM instructional improvement efforts: A meta-analysis. Educational Evaluation and Policy Analysis, 41(3), 260–293. https://doi.org/10.3102/0162373719849044
- Makel, M. C., & Plucker, J. A. (2014). Facts are more important than novelty: Replication in the education sciences. Educational Researcher, 43(6), 304–316. https://doi.org/10.3102/0013189X14545513
- McNally, S., Ruiz-Valenzuela, J., & Rolfe, H. (2016). ABRA online reading support: Evaluation report and executive summary. Education Endowment Foundation.*
- Miller, S., Davison, J., Yohanis, J., Sloan, S., Gildea, A., & Thurston, A. (2016). Texting parents: Evaluation report and executive summary. Education Endowment Foundation.*
- Motteram, G., Choudry, S., Kalambouka, A., Hutcheson, G., & Barton, A. (2016). ReflectED: Evaluation report and executive summary. Education Endowment Foundation.*
- Nunes, T., Barros, R., Evangelou, M., Strand, S., Mathers, S., & Sanders-Ellis, D. (2018). FirstClass@Number: Evaluation report and executive summary. Education Endowment Foundation.*
- Nunes, T., Malmberg, L., Evans, D., Sanders-Ellis, D., Baker, S., Barros, R., Bryant, P., & Evangelou, M. (2019). onebillion: Evaluation report and executive summary. Education Endowment Foundation.*
- Outhwaite, L. A., Faulder, M., Gulliford, A., & Pitchford, N. J. (2019). Raising early achievement in math with interactive apps: A randomized control trial. Journal of Educational Psychology, 111(2), 284–298.
- Patel, R., Jabin, N., Bussard, L., Cartagena, J., Haywood, S., & Lumpkin, M. (2017). Switch-on effectiveness trial: Evaluation report and executive summary. Education Endowment Foundation. †
- Pocock, S. J. (1982). Statistical aspects of clinical trial design. Journal of the Royal Statistical Society: Series D (the Statistician), 31, 1–18.
- Protzko, J., & Schooler, J. W. (2017). Decline effects: Types, mechanisms, and personal reflections. In S. O. Lilienfeld & I. D. Waldman (Eds.), Psychological science under scrutiny: Recent challenges and proposed solutions (pp. 85–107). Wiley-Blackwell.
- Ritter, G. W., Barnett, J. H., Denny, G. S., & Albin, G. R. (2009). The effectiveness of volunteer tutoring programs for elementary and middle school students: A meta-analysis. Review of Educational Research, 79(1), 3–38. https://doi.org/10.3102/0034654308325690
- Rienzo, C., Rolfe, H., & Wilkinson, D. (2015). Changing mindsets: Evaluation report and executive summary. Education Endowment Foundation.*†
- Sibieta, L., Kotecha, M., & Skipp, A. (2016). Nuffield early language intervention: Evaluation report and executive summary. Education Endowment Foundation.*
- Sims, S., Anders, J., & Zieger, L. (2022). The internal validity of the school-level comparative interrupted time series design: Evidence from four new within-study comparisons. Journal of Research on Educational Effectiveness, 1–22. https://doi.org/10.1080/19345747.2022.2051652
- Sisk, V. F., Burgoyne, A. P., Sun, J., Butler, J. L., & Macnamara, B. N. (2018). To what extent and under which circumstances are growth mind-sets important to academic achievement? Two meta-analyses. Psychological Science, 29(4), 549–571.
- See, B. H., Morris, R., Gorard, S., & Siddiqui, N. (2019). Evaluation of the impact of Maths Counts delivered by teaching assistants on primary school pupils’ attainment in maths. Educational Research and Evaluation, 25(3–4), 203–224. https://doi.org/10.1080/13803611.2019.1686031
- Slavin, R. E., Lake, C., Chambers, B., Cheung, A., & Davis, S. (2009). Effective reading programs for the elementary grades: A best-evidence synthesis. Review of Educational Research, 79(4), 1391–1466. https://doi.org/10.3102/0034654309341374
- Speckesser, S., Runge, J., Foliano, F., Bursnall, M., Hudson-Sharp, N., Rolfe, H., & Anders, J. (2018). Embedding formative assessment: Evaluation report and executive summary. Education Endowment Foundation.*
- Spybrook, J., Shi, R., & Kelcey, B. (2016). Progress in the past decade: An examination of the precision of cluster randomized trials funded by the US Institute of Education Sciences. International Journal of Research & Method in Education, 39(3), 255–267. https://doi.org/10.1080/1743727X.2016.1150454
- Stokes, L., Hudson-Sharp, N., Dorsett, R., Rolfe, H., Anders, J., George, A., Buzzeo, J., & Munro-Lott, N. (2018). Mathematical reasoning: Evaluation report and executive summary. Education Endowment Foundation.†
- Styles, B., & Bradshaw, S. (2015). Talk for literacy: Evaluation report and executive summary. Education Endowment Foundation.*
- Torgerson, C. J., & Torgerson, D. J. (2001). The need for randomised controlled trials in educational research. British Journal of Educational Studies, 49(3), 316–328. https://doi.org/10.1111/1467-8527.t01-1-00178
- Torgerson, C. J., Torgerson, D. J., Birks, Y. F., & Porthouse, J. (2005). A comparison of randomised controlled trials in health and education. British Educational Research Journal, 31(6), 761–785. https://doi.org/10.1080/01411920500314919
- Torgerson, C., Bell, K., Coleman, E., Elliott, L., Fairhurst, C., Gascoine, L., Hewitt, C., & Torgerson, D. (2018). Tutor trust affordable primary tuition: Evaluation report and executive summary. Education Endowment Foundation.*
- Tracey, L., Boehnke, J., Elliott, L., Thorley, K., Ellison, S., & Bowyer-Crane, C. (2019). Grammar for writing: Evaluation report and executive summary. Education Endowment Foundation.†
- Vasishth, S., Mertzen, D., Jäger, L. A., & Gelman, A. (2018). The statistical significance filter leads to overoptimistic expectations of replicability. Journal of Memory and Language, 103, 151–175. https://doi.org/10.1016/j.jml.2018.07.004
- Weidmann, B., & Miratrix, L. (2020). Lurking inferential monsters? Quantifying selection bias in non-experimental evaluations of school programs. Journal of Policy Analysis & Management, 40(3), 964–986. https://doi.org/10.1002/pam.22236
- Worth, J., Sizmur, J., Ager, R., & Styles, B. (2015). Improving numeracy and literacy: Evaluation report and executive summary. Education Endowment Foundation.*†
- Wright, H., Dorsett, R., Anders, J., Buzzeo, J., Runge, J., & Sanders, M. (2019). Improving working memory: Evaluation report and executive summary. Education Endowment Foundation.*
Appendix A
Table A1. Intervention-specific assumed effect sizes (AES).
Table A2. Summarizing Type S and Type M error estimates for trials with p < 0.05.
Appendix B. Type M and Type S at the trial level
We also conducted an alternative version of our analysis at the trial level, rather than the result level. The aggregation was achieved using the R function “agg” in the package “Mad.” Because effect sizes in multi-outcomes trials are often dependent (i.e., same participants are tested on multiple outcomes), and correlation between outcomes are often not reported in the original trial, we conducted our analysis twice, once assuming outcomes within trials were correlated r = 0.5 and one assuming outcomes were uncorrelated (r = 0.0). When a trial had multiple outcomes associated with distinct AES, we calculated Type M and Type S using the averaged value of those AES. Twenty of the 23 promising trials had an aggregated p value less than or equal to 0.11. The results from this trial-level analysis (reported below) are not sensitive to assumptions of dependence between outcomes and are highly similar to the results of the outcome-level analysis described in the paper.
Table B1. Summarizing Type S and Type M error estimates under different assumed affect size (AES) for analysis conducted at the trial level (assuming within trial outcomes correlated r = 0.5).
Table B2. Summarizing Type S and Type M error estimates under different assumed effect size (AES) for analysis conducted at the trial level (assuming within trial outcomes uncorrelated).