
 ?Mathematical formulae have been encoded as MathML and are displayed in this HTML version using MathJax in order to improve their display. Uncheck the box to turn MathJax off. This feature requires Javascript. Click on a formula to zoom.
ABSTRACT
Matola, a major Mozambican city, has witnessed flooding, mainly caused by rainfall. The study aims to produce flood-hazard and flood-risk maps for Matola using the hydrological model TFM-DYN. For 2000, 2020, and 2040, the modeled extent of medium-risk area is 50.6 km2 (13.7%), 44.8 km2 (12.2%), and 39.0 km2 (10.6%) and of high-risk area is 43.3 km2 (11.8%), 31.8 km2 (8.6%), and 28.9 km2 (7.8%), respectively. In 2000, 61,978.4 inhabitants were exposed to medium-risk and 53,036.8 to high-risk. In 2020, 130,628.3 inhabitants were vulnerable to medium-risk and 92,722.8 to high-risk. By 2040, 203,999.8 inhabitants will face medium-risk and 151,169.1 high-flood-risk.
KEYWORDS:
1. Introduction
Flood occurrences as natural disasters are increasing globally. Under 100 floods were recorded annually before 1998, but over 100 floods have been recorded annually since then (Ritchie & Roser, Citation2020). Climate change will alter the flooding pattern in continents such as Africa where prolonged heavy rains may increase in volume and occurrence (Douglas et al., Citation2008). For example, Southern African countries such as Mozambique, Malawi, South Africa, and Zimbabwe have experienced floods in 2000, and most recently in 2018, 2019, and 2020 (Douglas et al., Citation2008; Mkhandi et al., Citation2000; Muthoni et al., Citation2019; Rahut et al., Citation2021; ReliefWeb, Citation2000). The same is true of East African countries such as Somalia, Kenya, and Tanzania (Little et al., Citation2001; Macleod et al., Citation2021), and of West African countries such as Senegal, Burkina Faso, Equatorial Guinea, Togo, and Nigeria (Engel et al., Citation2017; Wagner et al., Citation2021).
In Mozambique, the three largest recorded floods occurred in the twenty-first century: the first in 2000 in almost all rivers of the country, the second in central Mozambique in 2007/2008, and the third in 2013 in the south, resulting in numerous casualties, hundreds of thousands of displaced people, and over four million affected people in urban and rural areas (GFDRR et al., Citation2014; OMS & MH, Citation2008). Additionally, floods in 2019 were associated with a strong cyclone ‘Idai’ (WMO, Citation2019), and climate-change projections for Mozambique indicate higher expected flood risk across the country as the likelihood of direct impact from strong tropical cyclones and intense rainfall may increase over coming decades (MFA, Citation2018; WMO, Citation2019).
Flood risk is the probability of inundation and associated consequences for human health and life, economic activities, cultural heritage, and environment associated with flood events (EU Floods Directive, Citation2007; Kelman, Citation2018; Sayers et al., Citation2013). The key component of flood-risk assessment is accurately estimating the flood hazard (i.e., flood magnitude and frequency) and potential impact on human activities (Alfieri et al., Citation2015). Hazard arises from the exposure of people, property, systems, and other elements present in hazard zones and thereby subject to potential losses (Kelman, Citation2018, p. 283). Vulnerability is the extent to which a system is susceptible to floods due to exposure (i.e., a perturbation), in conjunction with its ability (or inability) to cope, recover, or adapt (Balica et al., Citation2013, p. 3). According to Alfieri et al. (Citation2015), these three components of flood-risk assessment – hazard, exposure, and vulnerability – change over time due to socioeconomic development and the possible influence of changing climate, complicating the assessment of present and future flood risk. Assessing the extent of present and future flood risk is crucial for land-use management in the face of flooding, to avoid losses.
Hydraulic modeling is central to assessing flood risk, involving the use of hydraulic models to understand streamflow characteristics such as water depth, inundation extent, and flow velocity (Echogdali et al., Citation2018; Ntanganedzeni & Nobert, Citation2020). Advanced hydrological models are widely used in developed countries in operational and pre-operational flood forecasting and warning systems both in small catchments with short response times and in large basins (Casagrande et al., Citation2017). Examples of such systems are the Advanced Hydrologic Prediction Service (AHPS) in the USA (Casagrande et al., Citation2017; Demargne et al., Citation2014), the European Flood Awareness System (EFAS) used for flood warnings in Europe (Alfieri et al., Citation2014; Casagrande et al., Citation2017), and other national systems. Yet, many of these advanced hydrological models are not readily accessible, require large financial investments, are very complicated to manipulate, or require hard-to-access input data (Nkwunonwo et al., Citation2020; Nogherotto et al., Citation2019). However, detailed flood-risk assessment is extremely necessary in developing countries.
Detailed risk assessment of future urban flooding requires projections of atmospheric variables such as precipitation and storms (Alfieri et al., Citation2015; Ward et al., Citation2013), population growth projections, and spatial and temporal projections of urban development and land-use change (Löwe et al., Citation2017; Messner & Meyer, Citation2005). Flood-risk assessment requires relatively detailed information on precipitation, topography, asset distribution, and population density over time in order to determine present and future flood risk. Consequently, most flood-risk assessment studies performed using advanced hydrological models are performed at the scale of regions, countries, and river basins, where local information is more accessible, especially in developed countries (Alfieri et al., Citation2015). Uncertainties related to projected space–time transformations of land use generated by socioeconomic development have received less attention in the flood-risk projection community (e.g., Hinkel et al., Citation2014; Linde et al., 2011 cited by Muis et al., Citation2015). Therefore, probabilistic estimates of current and future urban flood risk are especially rare for developing countries such as Mozambique, where the data for such analyses are scarce (Aerts et al., Citation2014; Muis et al., Citation2015). For example, the Annual Contingency Plan for 2019, approved by the Mozambican government, highlights that the Municipal Council of the City of Matola (hereafter, ‘Matola’) remains a flood-risk city (CM, Citation2018, p. 14). However, the plan lacks detailed analysis of flood risk, such as the estimated areas subject to different levels of flood risk and their vulnerable populations. This lack of detail results from difficulties accessing the advanced hydrological models needed to perform flood-risk analyses and from the scarcity of data needed for such analyses – in the case of Matola, particularly for quantifying the probability of flood events for both the present and especially the future.
Facing the challenge of producing present and future flood-hazard and -risk maps for Matola, and given data scarcity, we chose to use a newly developed version of the triangular form-based multiple-flow (TFM) algorithm denoted the TFM-DYN model (Pilesjö & Hasan, Citation2014). We chose this new hydrological model because it simulates flow and produces estimates of water depth and velocity in an area over time using few and readily available input data on elevation, rainfall, surface roughness, and infiltration in the form of ASCII raster data processed in ArcMap v10.5.1, which is required to run the model. Python v3.4 software was used to process the input data, analyze results, and visualize the resulting maps. Additionally, to determine the risk facing Matola, the population density, maximum water velocity, and maximum water depth were combined using the fuzzy logic function in ArcGIS 10.5.1.
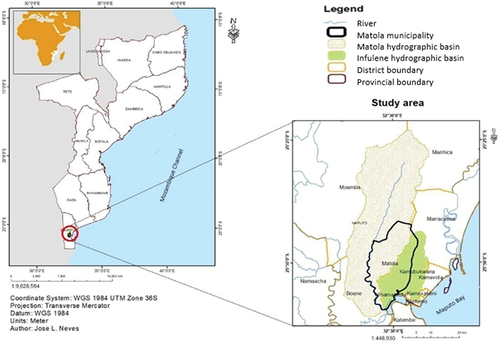
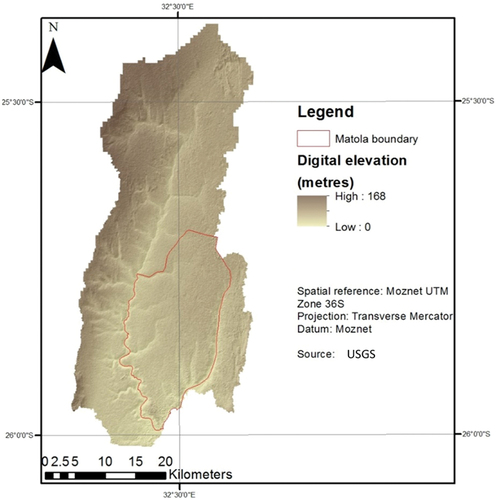
Matola is situated on the coast between the Infulene and Matola rivers (see, ) and is vulnerable to flooding from both the rivers and the sea. During the 2000 floods, the most devastating in the last 150 years, some areas experienced partial destruction while others experienced the total destruction of houses and basic infrastructure such as hospitals, electrical and telephone lines, water supply systems, roads, and bridges (GFDRR et al., Citation2014; ReliefWeb, Citation2000). Matola is characterized by population increase (INE, Citation2008, Citation2010, Citation2019), urban growth, and land-use change, marked by the horizontal urban spread of industrial, commercial, housing, transport, and other infrastructures, replacing agricultural and green areas (Araújo, Citation2003, p. 170). The urban areal expansion of Mozambican cities such as Matola is driven by greatly increasing urban population, a process expected to continue for the next 20 years (Araújo, Citation2003; Maloa, Citation2019; Neves, Citation2018; UN-Habitat, Citation2018).
Figure 1. Matola is located in southern Mozambique and is the capital of Maputo Province. It lies in the catchments of the infulene and Matola rivers, and includes a short coastline in Maputo Bay.
These previous experiences and future projections of population growth and flood occurrence highlight the need for risk assessment for Matola, in order to design and implement plans for present and future sustainable land use. To address the lack of research on flood-risk probability, this paper will study such hazard and risk assessments considering present and future scenarios for Matola. This paper will model urban pluvial flooding based on GIS analysis to produce flood-hazard and -risk maps of Matola for 2000, 2020, and 2040.
The specific objectives are to produce land-use/land-cover (LULC) evolution maps, flood-hazard maps, and risk maps of Matola for 2000, 2020, and 2040. Two research questions were addressed: 1) How are flood hazard and risk distributed in Matola in the past, present, and future, considering the various changes in land use, population, and climate-change scenarios? 2) How can flood-risk maps be developed given data scarcity?
The study informs the academic community, flood-risk managers, urban planners, and others interested in flood-risk management, presenting a methodology that can be replicated for flood-risk assessment considering present and future scenarios. The resulting maps are important for designing and implementing sustainable land-use plans, preventing flood losses, and advancing the development of flood-mitigation and adaptation measures in Matola.
2. Methodology and data
2.1 Surface water modeling
Various hydrological models exist for modeling water flow, but many are not readily accessible, are complicated, or require hard-to-access input data (Haque et al., Citation2019; Nkwunonwo et al., Citation2020; Nogherotto et al., Citation2019). This study uses a newly developed version of the triangular form-based multiple-flow (TFM) algorithm developed by Pilesjö and Hasan (Citation2014). This user-friendly dynamic model, denoted TFM-DYN, requires few and readily available input data. The model simulates water flow and produces estimates of water depth and velocity in an area over time (see, ), allowing the temporal and spatial analysis of water depth and velocity. Elevation, rainfall, surface roughness, and infiltration in the form of ASCII raster data are required to run the model. Here, ArcMap v10.5.1 (with Spatial Analyst) and Python v3.4 software are used to process the input data, analyze the results, and visualize the resulting maps.
Figure 2. A conceptual model of TFM-DYN (Pilesjö & Hasan, Citation2014). Four raster layers are needed as input data to run the model, which then runs dynamically with a defined time step to estimate the changes in water distribution, accumulation, and velocity of the accumulated water.
An advantage of TFM-DYN is that the model includes a multiple-flow algorithm, allowing water to flow from one cell in a grid representing the land surface to many cells, whereas a single-flow algorithm restricts the flow by allowing water to move to only one cell (Zhou et al., Citation2011). In TFM-DYN, each cell is divided into eight triangular segments of constant slope and aspect from which flow can travel both between segments and into the cells surrounding it in a three × three cell block (Pilesjö & Hasan, Citation2014).
In this study, the global model simulation was set to a 1-s time step run by the model, while the total duration was 2.5 h, including a 2-h storm duration followed by 30 min of water flow with no precipitation. Output data were set to be saved every 5 min for the velocity and water depth starting at time 0, producing two × 31 output files. Velocity was saved as the maximum of the eight segments of each cell. The maximum water depth and velocity for each cell throughout the run were then derived from these 31 files. The water depth at the beginning of the model was set to 0 m.
2.2. Data
2.2.1 Land cover
Land use/land cover (LULC) data covering the study area were extracted using 30-m-resolution satellite images for 2000 and 2020 downloaded from the United States Geological Survey (USGS) website, while for 2040 urbanization was simulated in ArcGIS 10.5 to estimate LULC. The LULC Manning’s values generated by ArcGIS were adjusted according to LULC classes from the National Cartography and Remote Sensing Center in Mozambique (CENACARTA) (see, ).
Table 1. LULC classes as per CENACARTA.
The LULC layers for 2000 and 2020 were extracted using a maximum-likelihood classification (MLC), and the results are presented in . Urban growth in Matola is almost completely horizontal, with agricultural and green areas constantly being replaced with planned housing and urban sprawl. Matola’s urban growth patterns indicate rapid urban development in most of the area. Unplanned housing is often built in areas that would normally not be approved for residences, and is built using materials offering little resilience to flooding.
Figure 3. LULC in the study area in a) 2000, b) 2020, and c) 2040.
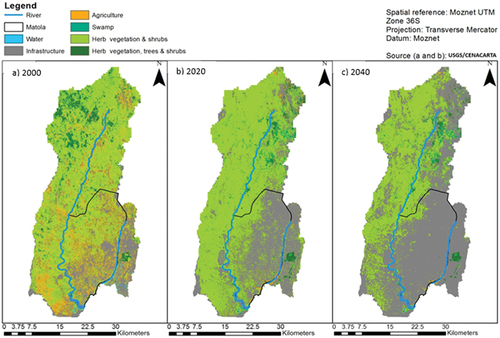
Matola’s various areas are not well connected to drainage systems and, for example, reduced ground permeability is not addressed by the municipal government (NevesCitation2018). Industrial areas in the south-east of the city are also expanding, although this study does not differentiate between semi-urban and urban areas. Given the lack of urban growth data relevant to Matola, urban growth was simulated in ArcGIS 10.5 to estimate LULC in 2040 ().
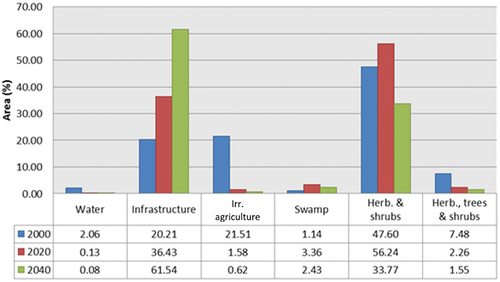
The infrastructure class was ‘expanded’ by a range of one cell (30 × 30 m), causing the eight cells around any infrastructure cell to be converted unless they were already the same class. Infrastructure increased by 25% from 2020 to 2040 using this method. This was deemed relevant horizontal expansion when compared to the 16% increase in urban area from 2000 to 2020 (). Population increase was a factor to consider, as the population is projected to rise to 1,859,014 by 2040, almost double the 2020 total of 1,032,197 (INE, Citation2010, Citation2019), exerting great pressure on land use (Maloa, Citation2019; Ribeiro, Citation2019).
Figure 4. Percentage of area covered by each LULC class in the study area in 2000, 2020 and 2040.
2.2.2 Elevation data
In urban flood modeling, high-resolution elevation data in the form of a digital elevation model (DEM) are preferred, as they better represent the real world than does a more general model (Pakoksung & Takagi, Citation2020; Paul et al., Citation2020; Pilesjö & Hasan, Citation2014). High resolution is important in the x and y dimensions as well as the z dimension. Higher resolution makes water flow more realistically, as topographical features such as small valleys and ridges are considered (Karlsson & Arnberg, Citation2011; Paul et al., Citation2020). The DEM used here has the highest spatial resolution available from the USGS of 30 m in the x and y dimensions and 1 m in the z dimension. The DEM, representing elevation in 1-m integer values, did not represent the real physical environment sufficiently for this study. To compensate for the integer values, the vertical resolution of the DEM was changed to centimeters instead of meters. Although this could only be done based on the existing 1-m integer DEM, it nevertheless more realistically represents the real physical environment. A three × three-cell mean filter was applied to the original DEM, resulting in a new DEM with numbers to two decimal places (equal to cm resolution). With the filter, the original DEM was ‘flattened out,’ as sharp borders between cells due to the low z-dimension resolution were removed. In this context, this was deemed to improve the representativity of the DEM ().
Figure 5. Elevation map of the infulene and Matola river catchments.
2.2.3 Rainfall
Daily rainfall data over eight measurement stations in the Matola and Infulene catchments were available for 2000 from the South Regional Water Administration (ARA-Sul) of the National Directorate of Water (DNA). Stations positioned in the catchment had rainfall data for 6 February 2000, the day that intense rainfall occurred, causing the biggest floods registered in Matola, with an average rainfall of 151.9 mm. As rain gauges can underestimate rainfall in heavy-rain events, the data were increased by 10% to compensate (Liang et al., Citation2012). The rainfall input to the TFM-DYN model must be in the form of a raster layer and a hyetograph, with each raster-layer cell being a weight of a standard storm hyetograph based on average rainfall (see below). To create a raster layer comprising weights, the stations were each assigned an average rainfall weight, which were then interpolated to Thiessen polygons. The interpolated layer was then applied with a low-pass filter to create a 1-km-wide buffer zone to smooth the border weights. The hyetograph was simulated using an intensity-duration-frequency (I-D-F) curve and the alternating block method commonly used in storm design (Awadallah et al., Citation2017; Chen et al., Citation2009). The I-D-F curve was calculated using Equation 1 (MISAU, CMAM, PSM and Royal Haskoning DHV, Citation2017):
Equation 1 where:
I is the intensity of rainfall in mm/h
a and b are coefficients that vary depending on location and return period
t is the time period in minutes
The a and b coefficients for Maputo/Matola (MISAU, CMAM, PSM and Royal Haskoning DHV, Citation2017) were used in this study, and the return period was 50 years (a = 1,027 and b = −0.57749). The I-D-F curve is shown in .
Figure 6. I-D-F curve for Maputo.
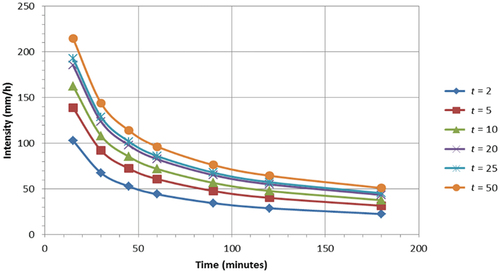
From an I-D-F curve, a design storm can be derived using different methods. The intensity was calculated for 2 h in 15-min steps, then rearranged, scaled to the average rainfall in mm/day on 6 February, and displayed as the graph shown in . This I-D-F curve provides a simple way for rainfall to vary both spatially and temporally in the TFM-DYN. Rainfall changes are hard to project in Mozambique because of its unique position west of Madagascar and the Indian Ocean. Generally, while the total rainfall might not increase very much, in extreme events a large or small increase in rainfall is expected (Dosio et al., Citation2019; Li et al., Citation2015). A modest 10% increase in wet-season extreme-event rainfall from 2000 to 2020 and 2040 was chosen, resulting in the hyetographs shown in .
Figure 7. Intensity of rain over a 2-h design storm for Maputo assuming a 50-y return period. total average rainfall over the study area = 171.1 mm/day.
Figure 8. Hyetograph showing a 10% increase in mm/h (from ) over a 2-h storm period. total average rainfall over the study area = 213.8 mm/day.
2.2.4 Surface roughness
Surface roughness affects the velocity of flow over the landscape. Manning’s n values are commonly used to represent surface roughness in hydrological modeling (Kalyanapu et al., Citation2009; Mtamba et al., Citation2015). The value of Manning’s coefficient can range from 0 to 1, with a higher value decreasing flow velocity, resulting in a greater accumulated water depth (Mtamba et al., Citation2015). Different methods can be used to estimate Manning’s n, including visual inspection, physically based approaches, optimization techniques, and GIS or remote-sensing approaches. A GIS or remote-sensing approach is used here, specifically using ArcGIS 10.5. This is the best approach when modeling a large area, as it is normally less labor intensive than other techniques (Kalyanapu et al., Citation2009). In this method, Manning’s n values are commonly acquired from tables in the literature and can then be assigned to a LULC dataset. Surface roughness was determined using look-up-tables in Mtamba et al. (Citation2015) and Papaioannou et al. (Citation2018). The final Manning’s coefficient for each LULC can be seen in .
Table 2. LULC classes and their corresponding surface roughness coefficients according to Mtamba et al. (Citation2015) and Papaioannou et al. (Citation2018).
2.2.5 Infiltration
The infiltration of an area can change greatly depending on the soil and LULC class. Most of the study area consists of arenosols, with fluvisols predominant along rivers. Arenosols are commonly found in arid and semi-arid environments, and are classified by the FAO as having a composition of more than 70% sand and less than 15% clay (Dahlgren et al., Citation2008). According to Savva and Frenken (Citation2002), sandy soils in sub-Saharan Africa typically have an infiltration rate of at least 30 mm/hr and a base infiltration rate of <30 mm. The base infiltration rate is the steady-state infiltration through soil. This infiltration rate was chosen because the TFM-DYN model was run using a fixed infiltration rate for each LULC class. Values for the different classes are listed in .
Table 3. Infiltration values assigned to each LULC class according to Dahlgren (Citation2008) and Savva and Frenken (Citation2002).
The Maputo/Matola city area has many low-lying wetlands, and the surrounding soils are described as hydromorphic sandy soils with poor drainage and a shallow water table (Dahlgren, Citation2008). Flooding in the early months of the year is typically worsened by waterlogged soils due to frequent rainfall preceding an extreme rain event. Consequently, the infiltration rates shown in are relatively low, as the study assumes that previous saturation causes low infiltration.
2.3 Risk Maps
Population density and the maximum water depth and velocity produced by the TFM-DYN model were used in the risk maps. Matola population data and LULC data were used to estimate the population density in each neighborhood. The population was 424,662 in 1997 and 1,032,197 in 2020, and by 2040 it is projected to rise to 1,859,014 (INE, Citation2008, Citation2010, Citation2019). The closest year to 2000 with available population data is 1997, so it was used for the 2000 scenario. The population distribution over the neighborhoods could not be obtained, so population density was estimated using the urban distribution in the LULC data. Population density per infrastructure cell in the Matola city area was determined by first dividing the total population by the number of cells. Then the population per cell was multiplied by the number of infrastructure cells in each neighborhood, giving the population in each of them. To determine flood risk, the population density, maximum water velocity, and maximum water depth were all assigned linear fuzzy memberships, with greater depths and densities being given higher weights (the minimum value was weighted 0 and the maximum 1), and were then combined using the fuzzy logic function in ArcGIS 10.5.1.
3. Results
3.1. Water depth
TFM-DYN was run for the whole catchment area of the Matola and Infulene rivers, but the output is shown only for Matola city, encompassing parts of each catchment. The total area exposed to the 2000 floods in Matola city is 368.4 km2 (), and the maximum water depth sorted into different hazard classes is a number close to that presented by Gomez et al. (Citation2018) (). The results indicate that of the total flooded area, 52.6% is submerged in 0.01–0.5 m of water in 2000, decreasing to 46.2% in 2020 and 35.6% in 2040. The total area exposed to this low hazard class is 193.7, 170.2, and 131.2 km2 in 2000, 2020, and 2040, respectively. Most of the flooded area is in this low hazard class (0.01–0.5 m of depth) in 2000 and 2020; in 2040, the largest area is expected to be in the very-low-hazard class (0–0.1 m of depth) with 173.1 km2 corresponding to 47.0%. Additionally, 34.4% in 2000, corresponding to 126.7 km2, and 40.0% in 2020, corresponding to 147.4 km2, is in this very-low-hazard class. Of the total exposed area, an extensive area is exposed to medium-hazard class (0.5–1 m of depth) with 7.3% corresponding to 26.8 km2, 7.5% corresponding to 27.6 km2, and 8.0% corresponding to 29.5 km2 in 2000, 2020, and 2040, respectively (). However, a significant area is also exposed to high-hazard class (1–2 m of depth) and very-high-hazard class (2–5 m of depth): 4.1% in 2000, increasing to 4.4% in 2020 and 6.0% in 2040 of high-hazard flooding; and 1.3% in 2000, increasing to 1.4% in 2020 and 2.7% in 2040 of very-high-hazard class of flooding. Clearly, much of the high-hazard class lies near river channels and much of the very-high-hazard class lies near or in river channels, areas with greater depths. Furthermore, a significant area of the city is also exposed to extreme flood depths exceeding 5 m in these years, particularly in river channels ().
Figure 9. Flood-hazard map of Matola city. Maximum depth for each cell during the storm period in a) 2000, b) 2020, and c) 2040. Depths are classified according to . Greater depths appear in darker colors. Bottom-right and top-left insets show more detail in two areas of Matola city where changes in depth between the years can be more easily seen and compared.
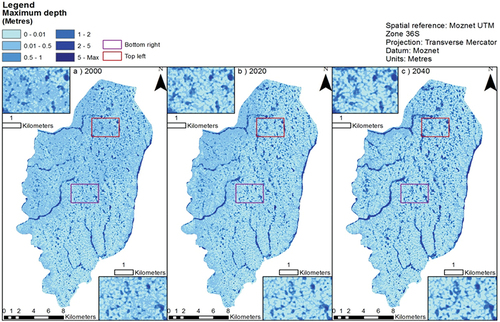
Figure 10. Distribution of flood depth over Matola city based on .
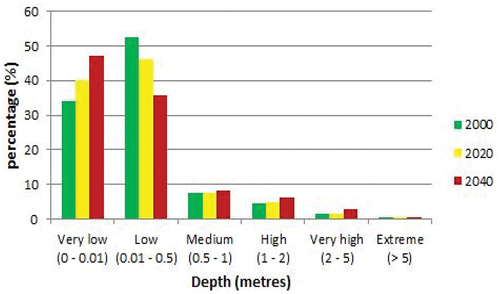
Table 4. Depths classified into different hazard risk classes (Gomez et al., Citation2018).
clearly shows the changes occurring over four randomly chosen cells in the study area. Points a, b, and c are located in northern Matola, while d lies in the south. From these instances we can see that the depth starts to increase sharply 35–85 min into the event, usually before peak rainfall is reached. shows that the flow pattern differs between 2000, 2020, and 2040, possibly indicating that the LULC classes changed between 2000 and 2020 and between 2020 and 2040.
Figure 11. Water depth recorded in 5-min intervals over the 2.5-h model duration for each year starting from time 0. Four randomly selected points in the study area are shown.
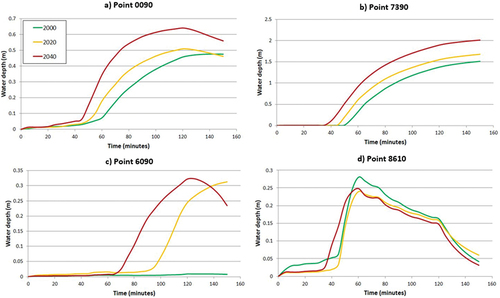
shows that the depth patterns are similar for all years but differ in magnitude. Although incoming rainfall stops at minute 120, the depth rises from minute 120 to 150. The increase in the urban area mainly explains the depth difference between 2000 and 2020 in all cases. In 2040, the changes can be explained both by increases in the urban area and by increased rainfall. c and d show that the depths are lower (<0.35 m). shows no flooding in 2000; however, this changes for 2020 and 2040. The LULC class selected in or around the cell causes more water to be directed to this location. shows a different depth pattern, in which peak depth appears very early (after approx. 60 min) and slowly decreases throughout the event.
3.2. Water velocity
shows the maximum water velocity in each cell during the modeled storms for 2000, 2020, and 2040. The average maximum velocity for each year was 0.99, 1.18, and 1.68 m/s, respectively. The water velocity is highest along drainage channels. The results indicate that of the total area of Matola affected by pluvial floods, in 2000 cells with a maximum velocity of 0.5–1 m/s occupied a greater area than did cells with other maximum velocities, with cells having a maximum velocity of 0–0.5 m/s occupying 33.0% and 28.8% of the area, respectively. In 2020, the scenario changes because cells with a maximum velocity of 1–1.5 m/s occupy the largest area, followed by cells with a maximum of 0.5–1 m/s occupying 27.5% and 26.9% of the area, respectively. By 2040 this change intensifies, as the area occupied by cells with a maximum velocity of 1–1.5 m/s increases to 35.9% of the area of Matola, followed by cells with a maximum of 0.5–1 m/s occupying 19.2% ().
Figure 12. Maximum velocity for each cell during the storm in a) 2000, b) 2020, and c) 2040. Higher velocities appear in darker colors. Bottom-right and top-left insets show more detail in two areas of Matola city were changes in velocity between the years can be more easily seen and compared.
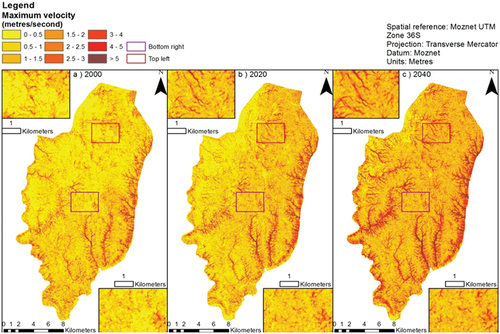
Figure 13. Distribution of velocity over Matola based on .
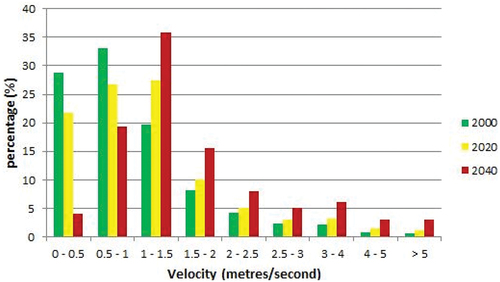
We can further note that the number of cells with a maximum velocity of 0–1 m/s in flat areas decreased over the years, whereas cells with a maximum velocity of over 1 m/s in sloping areas increased over the years (). These findings indicate that the LULC changes caused by the increasing urban area have an increasing effect on the velocity of water flow, influencing the flow direction as the water encounters more obstacles to its circulation through new buildings in flat areas. This is obvious in the visible change between 2000 and 2020, with incoming rainfall remaining the same, but rapid urbanization having occurred.
3.3. Flood risk
Flood risk was categorized into five levels, i.e., very low, low, medium, high, and very high, using the Jenks’ natural breaks method in GIS, because it identifies the classes statically with similar values and also divides the classes, with big differences existing between attribute values.
The results indicate that, overall, most of the Matola area faces very low risk, with 49.4% in 2000, 57.7% in 2020, and 62.4% in 2040 of the area facing such risk, corresponding to 182.0, 212.4, and 229.7 km2, respectively. Thus, of the 424,662 inhabitants of Matola during flooding in year 2000, 222,926.1 inhabitants were in relatively safe areas. In 2020, of the 1,032,197 inhabitants, 619,318.2 were in relatively safe areas, and in 2040, of the projected 1,859,014 inhabitants, 1,201,506.8 will be in relatively safe areas (, ). These are areas whose flooding depth is the least (0–0.01 m) and water velocity is low to very low, and are therefore areas of very low or of almost non-existent vulnerability, as their inhabitants and infrastructure are not exposed to the direct impact of disturbance caused by the floods.
Figure 14. Flood-risk map of Matola in a) 2000, b) 2020, and c) 2040. Bottom-right and top-left insets show more detail in two areas of Matola city where changes in risk each year can be more easily seen and compared.
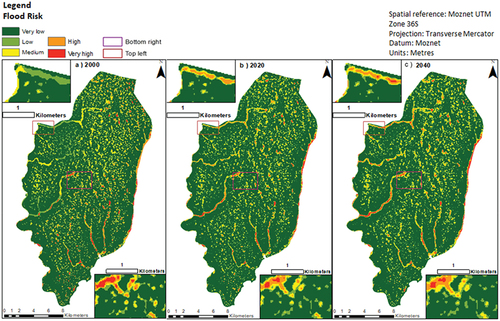
Table 5. Area and population affected by flooding at each level of risk.
Low-risk areas are widespread throughout Matola, though tending to decrease in extent from 2000 to 2020 and 2040, from 19.2% of the total area corresponding to 70.8 km2 to 17.6% corresponding to 65.0 km2 and 15.7% corresponding to 57.8 km2, respectively. In total, 86,720.7 inhabitants in 2000 and 189,527.7 in 2020 were exposed to a low risk of flooding, increasing to 302,338.3 inhabitants by 2040. In turn, the medium- and high-flood-risk areas put many inhabitants in a vulnerable situation, although fewer than those in very-low- and low-risk areas. In 2000, 61,978.4 inhabitants were exposed to medium flood risk in an area of 50.6 km2, representing 13.7% of Matola. Additionally, 53,036.8 inhabitants were exposed to high risk in an area of 43.3 km2, representing 11.8% of Matola. These medium- and high-risk areas are areas with flooding depths of approximately 0.5–5 m (, ).
The results also show that in 2020, 130,628.3 inhabitants were at medium risk of flooding in an area of 44.8 km2, corresponding to 12.2% of Matola, and that 92,722.8 inhabitants were at high risk in an area of 31.8 km2, corresponding to 8.6%. In turn, in 2040, 203,999.8 inhabitants will face medium risk of flooding in an area of 39.0 km2, corresponding to 10.6% of Matola, and 151,169.1 inhabitants will face high risk, in an area of 28.9 km2 corresponding to 7.8%.
The top-left inset in the map shown in belongs to the Sidwava neighborhood, where the results indicate that in 2000 there were only very low, low, and medium levels of flood risk. By 2020 the flood risk had increased to a high level, and by 2040, the risk will increase further to a very high level. In Sidwava, the population exposed to medium flood risk is estimated at 136 inhabitants for 2000, 1,462 inhabitants for 2020, and 3,224 inhabitants for 2040 ().
In the bottom-right inset in the map shown in , belonging to the Kobe neighborhood, the results indicate the occurrence of all flood risk levels, with the very-high-risk area decreasing and the high-, medium-, low-, and very-low-risk areas increasing from 2000 to 2020 and 2040 (). In Kobe, the population exposed to medium and high risk is estimated at 1,355 inhabitants for 2000, 6,347 inhabitants for 2020, and about 9,532 inhabitants for 2040.
The number of people vulnerable to flooding in Matola clearly changes from 2000 to 2020 and 2040, because the average number of people per 30 × 30-m cell increased/will increase from 3 to 4 and 5, respectively. Additionally, the great changes in urban area and urban infrastructure evolving from south to north bring about changes in flood-risk patterns in the three modeled years, as the LULC changes influence water flow direction and accumulation patterns (, ).
4. Discussion
Although studies of flood-risk analysis have been conducted in Mozambique, we lack research on detailed flood-risk assessment maps, particularly at local levels such as Matola. Here, we developed detailed flood-hazard and -risk assessment maps of Matola for 2000, 2020, and 2040. From 2000 to 2040, we see an increase in areas flooded to a depth of 0–0.01 m, a decrease in areas flooded to 0.01–0.5 m, and an increase in areas flooded over 0.5 m. The flow velocity increases greatly from 2000 to 2040, with more areas flooded to greater depths and at higher flow velocities, showing the effect of urbanization on flood hazards in Matola.
The above shift in flooding depths is due solely to land-use changes over time, as the infrastructure LULC class increases in each scenario, decreasing infiltration and surface roughness. However, infiltration is already low due to saturated soils, so surface roughness must be the main driving factor. Higher flow velocities can mean that less water accumulates to a depth of 0.01–0.5 m, instead flowing to lower-elevation areas and increasing the extent of the medium, high, very-high, and extreme hazard classes. It could also be that LULC changes influence flow direction and accumulation patterns due to the small changes in water flow that changed velocity and infiltration.
The study presents new discoveries as the results clearly indicate that the area exposed to medium and high flood risk tends to decrease from 2000 to 2040, although the number of inhabitants exposed to flood hazard increases. This is due to the population increase in flood-risk areas associated with urban growth marked by fully horizontal urban spread in Matola. This urban spread is caused by commercial, housing, transport, and other infrastructures replacing agricultural, green, and floodplain areas with non-existent or deficient drainage systems, or other water-control systems needed for flood control, in both newly planned and informal, unplanned land development (Araújo, Citation2003; NevesCitation2018). This scenario leads to increased population density in areas exposed to medium, high and very high flooding hazard classes and, therefore, to more vulnerability to flooding.
Estimation of the current and future urban flood risk for Matola faced a common and frustrating issue, as mentioned above, in that data for many developing countries are missing, scarce, or of low resolution (Aerts et al., Citation2014; Muis et al., Citation2015), so many factors must be estimated or assumed. Additionally, in all modeling, there are uncertainties due to the results representing only what could happen according to the input data, and the results are difficult to validate.
However, one possible method of flood-model validation is to compare model output with data from real events, such as remotely sensed images taken during flood events and/or reports of the number of affected people during the events (Nogherotto et al., Citation2019). Luu et al. (Citation2020) produced a risk-assessment map that included many relevant factors: flood hazard represented by water depth; exposure represented by land use, distance to river, and population density; and vulnerability represented by road density and poverty rate. Using historical flood data allows validation of the model study. Thus, this study can be verified not with images, but by the similarity of the modeled to real affected population, as follows. In this study, the sum of the number of inhabitants vulnerable to medium (61,978.4 inhabitants) and high flood risk (53,036.8 inhabitants) corroborates results published during the 2000 floods, indicating that in Matola, an estimated 100,000 people were affected by the floods (GFDRR et al., Citation2014; ReliefWeb, Citation2000). This gives some credibility to and confidence in the present results, based on Pilesjö and Hasan’s (2014) TFM-DYN hydrological model. In addition to validation based on historical flood data, a strength of this study is that it applies a futuristic perspective, visualizing in flood-hazard and -risk maps what could happen in the future. This constitutes a great contribution to the field of flood-risk study and assessment.
The present results are indispensable for urban planning in Matola as, given the presented scenario, urban planning must adjust to the flooding through adaptation measures. Flood adaptation is needed since studies of climate change and rainfall patterns clearly show that in southern Mozambique there is a recurrent and an increasing trend of heavy rainfall associated with cyclones that will cause floods approaching or exceeding the height of those in 2000 (Li et al., Citation2015; MFA, Citation2018; WMO, Citation2019). Additionally, studies show that urban population growth will continue (INE, Citation2010, Citation2019), likely over coming decades (Araújo, Citation2003; Maloa, Citation2019; Neves,Citation2018; UN-Habitat, Citation2018). It is necessary to ensure that land-use forms and investments in urban infrastructure are resilient to climate change, particularly flood hazards. Future research could usefully examine adaptation and mitigation actions implemented in urban planning in Matola municipality.
5. Conclusion
In many developing countries, such as Mozambique, high-quality data for flood-risk assessment are unavailable. This study aimed to model pluvial flooding in the city of Matola through combining scarce data to produce flood-hazard and -risk maps. Our findings indicate that much of the total flooded area, i.e., 52.6% and 46.2%, is in the low-hazard class (0.01–0.5 m of depth) in 2000 and 2020, respectively. In 2040, the largest flooded area, i.e., 47.0% of Matola, is expected to be in the very-low-hazard class (0–0.1 m of depth). Additionally, a significant flooded area is exposed to medium-hazard class (0.5–1 m of depth), high- hazard (1–2 m of depth), and very-high-hazard classes (2–5 m of depth) flooding, increasing from 2000 to 2020 and 2040. It is clear that much of the area subject to high and very-high-hazard flooding lies close to or in the river channels. The water velocity findings indicate that in 2000, cells with a maximum velocity of 0.5–1 m/s occupy 33.0% of the area. In 2020, the scenario changes, and cells with a maximum velocity of 1–1.5 m/s occupy 27.5% of the area. The change continues, and by 2040 cells with a maximum velocity of 1–1.5 m/s occupy 35.9% of the area of Matola. Cells with other maximum velocities are also undergoing changes resulting from LULC changes over the years, shifting the trajectory of water through buildings and other constructions, and changing the patterns of water accumulation.
The results indicate that, overall, most of the Matola area faces very low flooding risk, and areas facing the lowest-depth (0–0.01 m) flooding risk account for 49.4% of the area in 2000, 57.7% in 2020, and 62.4% in 2040, affecting about half the population in each year. These are areas of very low or almost nonexistent flood vulnerability, as their population and infrastructure are not exposed to the direct impact of flood disturbance.
In turn, the medium- and high-flood-risk areas put many inhabitants in a vulnerable situation, although fewer than those in very-low- and low-risk areas. In 2000, 61,978.4 inhabitants were exposed to medium risk of flooding in an area of 50.6 km2 and 53,036.8 inhabitants were exposed to high risk in an area of 43.3 km2. In 2020, 130,628.3 inhabitants were vulnerable to medium risk of flooding in an area of 44.8 km2 and 92,722.8 inhabitants were vulnerable to high risk in an area of 31.8 km2. In turn, in 2040, 203,999.8 inhabitants may face a medium risk of flooding in an area of 39.0 km2 corresponding to 10.6% of the area, and 151,169.1 inhabitants may face a high risk in an area of 28.9 km2. Changes in LULC and population growth play major roles in the changing risk profile over the years studied and in consequent population increase in flood-vulnerable areas. The findings indicate the need for planned adaptation measures to cope with urban flooding given the 2040 scenario presented. The hydrological modeling methodology presented here – i.e., creating maps showing maximum water depth, velocity, and risk in Matola in the past, present, and future despite data scarcity – could be useful for other cities in Mozambique or elsewhere for the same purposes. This study will aid risk assessment and/or disaster risk management of flood hazards, in the interest of better urban planning and introducing actions to adapt to and/or mitigate flooding.
Acknowledgments
The research was carried out within and financed by the Sida – UEM collaboration programme.
We appreciate to Margareta Espling, Mattias Sandberg and Inocêncio Pereira for their support during the production of this research. We extend our acknowledgments to the comments by the three anonymous reviewers which has improved the paper.
Disclosure statement
No potential conflict of interest was reported by the author(s).
Additional information
Notes on contributors
José Lourenço Neves
José Lourenço Neves Teaching and Researcher Assistant at the Faculdade de Ciências da Terra e Ambiente da Universidade Pedagógica de Maputo, Mozambique, since 2009. Works in the area of Geography, tourism and environment, territorial and urban planning and climate change. Since 2019 PhD candidate at the University of Gothenburg, Sweden, where research on urban flooding and urban planning for flood resilience.
Tanja Katharina Sellick
Tanja Katharina Sellick Graduated in Physical Geography and Ecosystem Science, in the Department of Physical Geography and Ecosystem Science, Lund University, having researched on hydrological modelling.
Abdulghani Hasan
Abdulghani Hasan GIS specialist in GIS Center, Department of Physical Geography and Ecosystem Science, Lund University, Sweden. As hydrological modelling specialist, he also works in collaboration with Swedish Meteorological and Hydrological Institute. Researcher in projects related to climate change, hydrology, from wich he produced and published several scientifc articles.
Petter Pilesjö
Petter Pilesjö Professor at Department of Physical Geography and Ecosystem Science, Lund University, Sweden. GIS Specialist, directing the GIS Center in Lund University. Collaborator in Center for Middle Estern Studies in Lund University. Research in projects related to climate change, hydrology, and land use in various parts of the world, from which produced and published several scientific articles.
Notes
1. Very high flood risk areas were excluded from the population density calculation as they are river/creeks channels, therefore we put zero (0) affected population.
References
- Aerts, J., Botzen, W. J. W., Emanuel, K., Lin, N., Moel, H., & Michel-Kerjan, E. (2014). De evaluating flood resilience strategies for coastal megacities. Sci, 80) 344(6183), 473–475. https://doi.org/10.1126/science.1248222
- Alfieri, L., Pappenberger, F., Wetterhall, F., Haiden, T., Richardson, D., & Salamon, P. (2014). Evaluation of ensemble streamflow predictions in Europe. Journal of Hydrology, 517(3), 913–922. https://doi.org/10.1016/j.jhydrol.2014.06.035
- Alfieri, L., Feyen, L., Dottori, F., & Bianchi, A. (2015). Ensemble flood risk assessment in Europe under high end climate scenarios. Global Environmental Change, 35(4), 199–212. https://doi.org/10.1016/j.gloenvcha.2015.09.004
- Araújo, M. G. M. (2003). Os Espaços Urbanos em Moçambique. GEOUSP Espaço e Tempo, 7, 14, 165–182. https://doi.org/10.11606/issn.2179-0892.geousp.2003.123846
- Awadallah, A., Elsayed, A., & Abdelbaky, A. (2017). Development of design storm hyetographs in hyper-arid and arid regions: Case study of Sultanate of Oman. Arabian Journal of Geosciences, 10(20), 8. https://doi.org/10.1007/s12517-017-3240-5
- Balica, S. F., Beevers, L., Popescu, I., & Wright, N. G. (2013). Parametric and physically based modelling techniques for flood risk and vulnerability assessment: a comparison. Journal of Environmental Modelling & Software, 41(3), 81–92 https://doi.org/10.1016/j.envsoft.2012.11.002.
- Casagrande, L., Tomasellal, J., Alvala, R. C. S., Bottino, M. J., & Caram, R. D. O. (2017). Early flood warning in the itajai´-ac¸u river basin using numerical weather forecasting and hydrological modeling. Nat Hazards, 88(2), 741–757. https://doi.org/10.1007/s11069-017-2889-0
- Chen, J., Hill, A., & Urbano, L. D. (2009). A GIS-based model for urban flood inundation. Journal of Hydrology, 373(1–2), 184–192. https://doi.org/10.1016/j.jhydrol.2009.04.021
- CM. (2018). Annual contingency plan 2019. republic of Mozambique. approved by the 36th ordinary session of the council of ministers. CM, 53.
- Dahlgren, R. A, MaciasF.Arbestain M.C.ChesworthW. RobargeW.P., BacheB.W. EmersonW. (2008). Arenosols Chesworth, W. Encyclopedia of soil science. 48–49. Springer Netherlands.
- Demargne, J., Limin, W., Regonda, S. K., Brown, J. D., Lee, H., Minxue, H., Seo, D.-J., Hartman, R., Herr, H. D., Fresch, M., Schaake, J., & Zhu, Y. (2014). The science of NOAA’s operational hydrologic ensemble forecast service. American Meteorological Society, 95(1), 79–98. https://doi.org/10.1175/BAMS-D-12-00081.1
- Dosio, A., Jones, R., Jack, C., Lennard, C., Nikulin, G., & Hewitson, B. (2019). What can we know about future precipitation in Africa? Robustness, significance and added value of projections from a large ensemble of regional climate models. Climate Dynamics, 53(9–10), 5833–5858. https://doi.org/10.1007/s00382-019-04900-3
- Douglas, I., Alam, K., Maghenda, M., Mcdonnell, Y., Mclean, L., & Campbell, J. (2008). Unjust waters: climate change, flooding and the urban poor in Africa. Environment & Urbanization Copyright. International Institute For Environment And Development, 20(1), 187–205. https://doi.org/10.1177/0956247808089156 (IIED)
- Echogdali, F., Boutaleb, S., Elmouden, A., & Ouchchen, M. (2018). Assessing flood hazard at river basin scale: Comparison between HECRAS- WMS and flood hazard index (FHI) methods applied to el maleh basin, Morocco. Journal of Water Resource and Protection, 10(9), 957–977. https://doi.org/10.4236/jwarp.2018.109056
- Engel, T., Fink, A. H., Knippertz, P., Pante, G., & Bliefernicht, J. (2017). Extreme precipitation in the west African cities of dakar and Ouagadougou: atmospheric dynamics and implications for flood risk assessments. Journal of Hydrometeorology , American Meteorological Society: 18(11), 2937–2957. https://doi.org/10.1175/JHM-D-16-0218.s1
- EU Floods Directive (2007). Directive 2007/60/ec of the European parliament and of the council of 23 October 2007 on the assessment and management of flood risks. Official Journal of the European Union.
- GFDRR, WBG, EU, UNDP & INGC. (2014). Mozambique, the recurrent flood recovery 2000-2013. case study for disaster recovery framework. GFDRR/WBG/EU/UNDP/INGC. HYPERLINK ”https://www.google.com/url?sa=t&rct=j&q=&esrc=s&source=web&cd=2&ved=2ahUKEwiNl_yK373oAhVlposKHV4DBPgQFjABegQIBBAB&url=http%3A%2F%2Fdocuments.worldbank.org%2Fcurated%2Fen%2F917531493730542294%2FMozambique-Recovery-from-recurrent-floods-2000-2013-recovery-framework-case-study&usg=AOvVaw15tsoMUwlKexnxoEFJT_wW”
- Gomez, V., Kure, S., Udo, K., & Mano, A. (2018). Analysis of exposure to vector-borne diseases due to flood duration, for a more complete flood hazard assessment: llanos de moxos, Bolivia, ribagua. Ribagua - Revista Iberoamericana del Agua, 5(1), 48–62. https://doi.org/10.1080/23863781.2017.1332816
- Haque, M. M., Seidou, O., Mohammadian, A., Djibo, A. G., Liersch, S., Fournet, S., Karam, S., Perera, E. D. P., & Kleynhans, M. (2019). Improving the accuracy of hydrodynamic simulations in data scarce environments using bayesian model averaging: a case study of the inner niger delta, mali, West Africa. Water, 11(9), 1766. https://doi.org/10.3390/w11091766
- Hinkel, J., Lincke, D., Vafeidis, A., Perrette, M., Nicholls, R., Tol, R., Marzeion, B., Fettweis, X., Ionescu, C., & Levermann, A. (2014, March 4). Coastal flood damage and adaptation costs under 21st century sea-level rise. Pnas, 111(9), 3292–3297. https://doi.org/10.1073/pnas.1222469111
- INE (2008). Statistics of City of Matola District. Retrieved from www.ine.gov.mz›maputo-provincia›2008›at_download ›file
- INE (2010). Annual Projections of the Total, Urban and Rural Population, of the districts of Maputo Province, 2007 - 2040. http://www.ine.gov.mz/estatisticas/estatisticas-demograficas
- INE. (2019). Definitive Results. 2017 Census. IV General Population and Housing Census. w w w.ine.g ov.mz›iv-rgph-2017 ›mocambique ›at_download›file.
- Kalyanapu, A., Burian, S., & McPherson, T. N. (2009). Effect of land use-based surface roughness on hydrologic model output. Journal of Spatial Hydrology, 9(2), 51–71. https://scholarsarchive.byu.edu/josh/vol9/iss2/2
- Karlsson, J. M., & Arnberg, W. (2011). Quality analysis of SRTM and HYDRO1K: A case study of flood inundation in Mozambique. International Journal of Remote Sensing, 32(1), 267–285. https://doi.org/10.1080/01431160903464112
- Kelman, I. (2018). Lost words amongst disaster risk science vocabulary? International Journal of Disaster Risk Sciences, 9(3), 281–291. https://doi.org/10.1007/s13753-018-0188-3
- Li, L., Diallo, I., Chong-Yu, X., & Stordal, F. (2015). Hydrological projections under climate change in the near future by RegCM4 in Southern Africa using a large-scale hydrological model. Journal of Hydrology, 528(February), 1–16. https://doi.org/10.1016/j.jhydrol.2015.05.028
- Liang, S., Xiaowen, L., & Wang, J. (2012). advanced remote sensing: terrestrial information extraction and applications. In Liang, S., Xiaowen, L., Wang, J. (Editors) Advanced Remote Sensing 1 Ed., 533–556. Academic Press. https://doi.org/10.1080/01431161.2013.787707
- Little, P. D., Mahmoud, H., & Coppock, D. L. (2001). When deserts flood: Risk management and climatic processes among East African pastoralists. Climate Research, 19(cr019149), 149–159. https://doi.org/10.3354/cr019149
- Löwe, R., Urich, C., Domingo, N. S., Mark, O., Deletic, A., & Arnbjerg-Nielsen, K. (2017). Assessment of urban pluvial flood risk and efficiency of adaptation options through simulations – A new generation of urban planning tools. Journal of Hydrology, 550((2017)), 355–367. http://dx.doi.org/10.1016/j.jhydrol.2017.05.009
- Luu, C., Tran, H. X., Pham, B. T., Al-Ansari, N., Tran, T. Q., Duong, N. Q., Dao, N. H., Nguyen, L. P., Nguyen, H. D., Huong Thu, T., Hiep Van, L., & Meding, J. V. (2020). Framework of spatial flood risk assessment for a case study in Quang Binh province, Vietnam. Sustainability, 12(7), 1–17. https://doi.org/10.3390/su12073058
- Macleod, D. A., Dankers, R., Graham, R., Guigma, K., Jenkins, L., Todd, M. C., Kiptum, A., Kilavi, M., Njogu, A., & Mwangi, E. (2021). Drivers and subseasonal predictability of heavy rainfall in equatorial East Africa and relationship with flood risk. American Meteorological Society, 22(4), 887–903. https://doi.org/10.1175/JHM-D-20-0211.1
- Maloa, J. M. (2019). The contemporary mozambican urbanization: Its characteristics dimension and challenges. Urbe. Revista Brasileira de Gestão Urbana, 11(e20180101), 67–68. https://doi.org/10.1590/2175-3369.011.e20180101
- Messner, F., & Meyer, V. (2005). Flood damage, vulnerability and risk perception—challenges for flood damage research. UFZ-Diskussionspapiere 67(13), 149–167. https://doi.org/10.1007/978-1-4020-4598-1_13
- MFA. (2018). Climate change profile: Mozambique. ministry of foreign affairs of the Netherlands (MFA). https://www.government.nlpublications2019/02/05
- MISAU, CMAM, PSM, and Royal Haskoning DHV. 2017. Prototype design for a pharmaceutical intermediate warehouse. Hydraulic detailed design project description.
- Mkhandi, S. H., Kachroo, R. K., & Gunasekara, T. A. G. (2000). Flood frequency analysis of Southern Africa: II. identification of regional distributions. Hydrological Sciences Journal, 45(3), 449–464. https://doi.org/10.1080/02626660009492341
- Mtamba, J., Velde, R. V. D., Ndomba, P. Z., Zoltán, V, F., & Zoltán, V. (2015). Use of radarsat-2 and landsat tm images for spatial parameterization of manning’s roughness coefficient in hydraulic modeling. Remote Sensing, 7(1), 836–864. https://doi.org/10.3390/rs70100836
- Muis, S., Güneralp, B., Jongman, B., Aerts, J. C. J. H., & Ward, P. J. (2015). Flood risk and adaptation strategies under climate change and urban expansion: A probabilistic analysis using global data. Science of the Total Environment, 538(2015), 445–457. https://doi.org/10.1016/j.scitotenv.2015.08.068
- Muthoni, F. K., Odongo, V. O., Ochieng, J., Mugalavai, E. M., Mourice, S. K., Hoesche-Zeledon, I., Mwila, M., & Bekunda, M. 2019. Long-term spatial-temporal trends and variability of rainfall over Eastern and Southern Africa. Theoretical and Applied Climatology:137, 1869–1882 https://doi.org/10.1007/s00704-018-2712-1.
- Neves, José Lourenço (2018). ‘Irregular occupation of wetlands and coastal protection, Their Socio-Environmental Impact in the City of Matola’. VIEIRA, António, & Others (Org.). Challenges to affirm Lusophony in Physical Geography and Environment: Luso-Afro-American Meeting of Physical Geography and Environment. https://repositorium.sdum.uminho.pt/bitstream/1822/55384/1/II_ELAAGFA.pdf
- Nkwunonwo, U. C., Whitworth, M. &. B., B, & Baily, B. (2020). A review of the current status of flood modelling for urban flood risk management in the developing countries. Scientific African, 7(4), e00269. https://doi.org/10.1016/j.sciaf.2020.e00269
- Nogherotto, R., Fantini, A., Raffaele, F., Di Sante, F., Dottori, F., Coppola, E., & Giorgi, F. (2019). An integrated hydrological and hydraulic modelling approach for the flood risk assessment over Po river basin. Natural Hazards & Earth System Sciences Discussions, 356(4), 1–29. https://doi.org/10.5194/nhess-2019-356
- Ntanganedzeni, B., & Nobert, J. (2020). Flood risk assessment in Luvuvhu river, Limpopo province, South Africa. Physics and Chemistry of the Earth, 124(4), 102959. https://doi.org/10.1016/j.pce.2020.102959
- OMS & MH (2008). Mozambique disasters: health cluster report January –June 2008. https://www.afro.who.intmoz-disasters-report-2008
- Pakoksung, K., & Takagi, M. (2020). Effect of DEM sources on distributed hydrological model to results of runoff and inundation area. Modeling Earth Systems and Environment, 7(3), 1891–1905. https://doi.org/10.1007/s40808-020-00914-7
- Papaioannou, G., Efstratiadis, A., Vasiliades, L., Loukas, A., Papalexiou, S. M., Koukouvinos, A., Tsoukalas, I., & Kossieris, P. (2018). An operational method for flood directive implementation in ungauged urban areas. Hydrology, 5(2), 24. https://doi.org/10.3390/hydrology5020024
- Paul, P. K., Kumari, B., Gaur, S., Mishra, A., Panigrahy, N., & Singh, R. (2020). Application of a newly developed large‐scale conceptual hydrological model in simulating streamflow for credibility testing in data scarce condition. Natural Resource Modeling, 33(4), 1–27. https://doi.org/10.1111/nrm.12283
- Pilesjö, P., & Hasan, A. (2014). A triangular form-based multiple flow algorithm to estimate overland flow distribution and accumulation on a digital elevation model. Transactions in GIS, 18(1), 108–124. https://doi.org/10.1111/tgis.12015
- Rahut, D. B., Aryal, J. P., & Marenya, P. (2021). Understanding climate-risk coping strategies among farm households: evidence from five countries in eastern and Southern Africa. Science of the Total Environment, 769(145236), 1–19. https://doi.org/10.1016/j.scitotenv.2021.145236
- ReliefWeb. 2000. Mozambique: Tens of thousands homeless in floods. https://reliefweb.int/report/mozambique/mozambique-tens-thousands-homeless-floods
- Ribeiro, Esther. (2019). Urbanization process in Mozambique – Africa. 1984-8781 - Anais XVIII ENANPUR 2019. Verifier code:U6XYfemISn7P: http://anpur.org.br/xviiienanpur/anais
- Ritchie, Hannah, & Roser, Max. (2020). Natural Disaster. https://ourworldindata.org/natural-disasters
- Savva, A. P., & Frenken, K., (2002). Irrigation manual: planning, development monitoring and evaluation of irrigated agriculture with farmer participation. food and agriculture organization of the United Nations (FAO) and the sub-regional office for east and Southern Africa (SAFR), Report.
- Sayers, P., Yuanyuan, L., Galloway, G., Penning-Rowsell, E., Fuxin, S., Kang, W., Yiwei, C., & Quesne, T. L. (2013). Flood risk management: a strategic approach. © Asian Development Bank, GIWP, UNESCO and WWF-UK. License: CC BY-NC IGO 3.0 http://hdl.handle.net/11540/81
- UN-Habitat. (2018). ( Series. Mozambique housing sector profile. united nations human settlements programme - UN- habitat Mozambique (pp. 978-92-1-132810-3): 978-92-1-131927-9.
- Wagner, S., Souvignet, M., Walz, Y., Balogun, K., Komi, K., Kreft, S., & Rhyner, J. When does risk become residual? A systematic review of research on food risk management in West Africa. (2021). Regional Environmental Change, 21(3), 84. 2021. https://doi.org/10.1007/s10113-021-01826-7
- Ward, P. J., Jongman, B., Weiland, F. S., Bouwman, A., Van Beek, R., Bierkens, M. F. P., Ligtvoet, W., & Winsemius, H. C. (2013). Assessing flood risk at the global scale: Model setup, results, and sensitivity. Environmental Research Letters, 8(4), 044019. https://doi.org/10.1088/1748-9326/8/4/044019
- WMO. (2019). Reducing vulnerability to extreme hydro-meteorological hazards in Mozambique after cyclone IDAI. https://library.wmo.int›doc_num
- Zhou, Q., Pilesjo, P., & Chen, Y. (2011). Estimating surface flow paths on a digital elevation model using a triangular facet network. Water Resources Research, 47(7), 1–12. https://doi.org/10.1029/2010WR009961