
ABSTRACT
Guinea-Bissau has experienced the tangible effects of climate change in recent years. An examination of the annual and monthly precipitation patterns from 1960-2020 indicates an overall decreasing trend in climatological series. In contrast, the monthly average maximum and minimum temperatures exhibit significant increasing trends during the same period. Analysing daily rainfall and maximum and minimum temperature leads us to conclude that rainfall and temperature patterns have evolved in different ways. The non-parametric Mann–Kendall test was used to assess trends in climate indices, and Sen’s slope estimator was used to detect the magnitude of trends. Despite the significant decrease in wet days, there has been an upward trend in rainfall over the 1981-2020 climatological series. Days with maximum temperatures of at least 30 and 35ºC have increased in all seasons with a very significant upward trend for 30ºC. On the other hand, absolute annual maximum temperatures have tended to decrease in Bolama and Bafatá by -0.25 and -0.17ºC per decade respectively. There has also been a decrease of 0.30ºC and 0.39ºC per decade in the minimum temperatures in Bolama and Bafata, i.e. the nights have been getting cooler, which somewhat contradicts the global trends generally reported for this same parameter.
1. Introduction
The global climate changes observed in recent decades have caused social and environmental impacts across the planet. Floods, droughts, greater irregularity in rainfall, increased temperature and heat waves, sea level rise, are examples of phenomena linked to climate change that highlight the vulnerabilities of territories and aggravate risks in different natural and environmental systems (IPCC, Citation2021; Silva & Mendoza, Citation2020). The increase in the concentration of greenhouse gases of anthropogenic origin is the main cause of the warming of the atmosphere, oceans, and the earth’s surface, intensifying these extreme climatic events (IPCC, Citation2023).
According to the IPCC (Citation2021), natural disasters are increasingly frequent and severe, and governments, especially those in less developed countries, have limited capabilities to deal with the associated risks, to ensure the protection of their citizens. The global average surface temperature in 2011–2020 was 1.1°C higher than in the pre-industrial period [(1850–1900); (IPCC, Citation2023)], and the impacts of climate change will have disproportionate consequences globally and will be particularly severe in developing countries, where poor communities are highly dependent on the direct use of local natural resources (Roudier et al., Citation2011). Agricultural productivity is already being affected in different regions of the world through many mechanisms, driven largely by higher average and extreme temperatures, altered precipitation and drought regimes, while the increase in atmospheric CO2 concentrations continues (Jägermeyr et al., Citation2021). West Africa is one of the region’s most vulnerable to climate variability and change, and evidence is accumulating of biodiversity loss, water scarcity, reduced agricultural production, and reduced economic growth, in contrast to its contribution to greenhouse gas emissions, which is the lowest of all regions (Shukla et al., Citation2019). The increase in the frequency of hot days and nights, the increase in the intensity and duration of heat waves, as well as the severity of droughts, land degradation, loss of biodiversity, and the appearance of new pests in crops, are examples of effects linked to global warming (IPCC, Citation2018; Shukla et al., Citation2019).
According to the World Meteorological Organization (WMO, Citation2022), the increase in average temperature is faster on the African continent, with a warming value of around 0.3°C per decade between 1991 and 2021, higher than the global average. The IPCC report (IPCC et al., Citation2022) states that global warming of 2–4°C in Africa will contribute to a reduction in agricultural production, especially wheat, maize, and rice crops, at a time when current temperatures and changes in rainfall patterns are already affecting livelihoods, food security, economic and governance stability (USAID, Citation2018). Water stress in these countries is also accentuated by their weak capacity in the water management infrastructure sector (Barry et al., Citation2018), aggravated by the need to increase their agricultural production to respond to current population growth rates (FAO, Citation2016). On the African continent, the economy of most countries is strongly dependent on rain-fed agriculture (Kangah, Citation2004), particularly in West Africa and including Guinea-Bissau, representing one of the major concerns regarding the planning of agricultural activities and food security (Bedoum et al., Citation2017). The relevance of these problems motivated the carrying out of the present investigation, dedicated to the study of climate trends in a small country in West Africa (Guinea-Bissau).
Mangrove rice farming is of great importance for food security in the country, since rice is the basis of the Guinean population’s diet, with an annual per capita consumption of approximately 125 kg (Medina, Citation2008) and its cultivation depends solely on rainfall. Reduced rainfall can contribute to an increase in salt concentration in cultivated areas, which is particularly detrimental to rice crops, which cannot withstand excess salt. Extreme rainfall floods the plots and hinders agricultural activities and the development of rice due to the lack of water management capacity.
Despite many studies that have analyzed the past climatic trends in West Africa, no one has focused on this specific territory to investigate the potential effects of recent climate variability on rice production.
Faye and Akinsanola (Citation2021) indicate that West Africa ranks second in warming within Africa from 1981 to 2010, following North Africa, and is highly susceptible to climate change. Meanwhile, (Blunden & Boyer, Citation2021) observe that coastal West African countries experienced higher average annual temperatures in the 2020s compared to the climatological averages of 1981–2010, with an increase ranging from 0.5 to 1°C in the West, Central Sahel, and Guinea Coast band between 1981 and 2010. USAID (Citation2018) reports a temperature rise of 0.6 to 0.8°C from 1970 to 2010 and 1.5 to 2°C from 1950 to 2010 in the Western Sahel. Barry et al. (Citation2018) found an increase in annual average minimum temperatures of 0.28°C/decade and 0.16°C/decade for maximum temperatures from 1960 to 2010 in West Africa.
West Africa has been affected by strong interannual variability in precipitation, manifested by severe droughts and floods over recent years (Nicholson et al., Citation2018). According to the IPCC report (Citation2022), negative trends in the evolution of precipitation were observed in West Africa between 1960 and 1980, accompanied by an increase in its variability. The economy of most countries in this region depends on rain-fed agriculture and climate variability strongly affects these countries due to the irregularity of the rainfall regime, which can be manifested by its late onset and/or early end (Adama et al., Citation2019; Mendes, Citation2017).
This increase in precipitation variability is linked to the phenomenon of global warming, leading to more frequent records of floods from 1990 onwards in many West African countries (Salack et al., Citation2018), affecting millions of people. Evidence is mounting that extreme rainfall events have become more frequent (Faye & Akinsanola, Citation2021; Nkrumah et al., Citation2019; Taylor et al., Citation2017). Since 1990, extreme phenomena, both droughts and floods (Ly et al., Citation2013; Mendes & Fragoso, Citation2023), have affected millions of people annually in West Africa. According to Taylor et al. (Citation2017), intense rainfall and the maximum number of wet days have increased very significantly since the 1980s, with greater frequency in the West African Sahel.
Firstly, it should be noted that most of the studies point to the fact that, from the 1980s onwards, there was an increase in precipitation in West Africa, especially in the Sahel region, after a period with a greater predominance of major droughts observed in the region. This overall behavior is something that was found in almost all studies, in contrast to other aspects in which some dissonances in estimated variations are detected. The analysis of the observed trends described in the literature requires caution since some apparently contradictory evidence may be due to different periods or target regions considered by distinct works and attention must be given to the specific set of rainfall parameters used in each study.
The international team CDKN & ACDI (Citation2022) found an increase in total annual precipitation in West Africa between 1990 and 2021. In agreement with this finding, Dike et al. (Citation2020) identified an increase in total annual precipitation (and an increase in its intensity – maximum precipitation in 5 days) in Nigeria, while, in turn, Nkrumah et al. (Citation2019) found a significant increase in annual precipitation in the southern part of West Africa. In another study (Sylla et al., Citation2016), state that precipitation increased significantly between 1983 and 2010 in Senegal, Burkina Faso, Southern Mauritania, Mali, Niger, and Chad, in contrast to the decrease in precipitation referenced in investigations conducted by Ly et al. (Citation2013) and Kouman et al., (Citation2022). In accordance with these last cited studies (Gbode et al., Citation2015), also found a decrease in consecutive wet days in Côte d’Ivoire between 1991 and 2007, and in Nigeria between 1981 and 2020, respectively, in line with the finding made by Kouman et al., (Citation2022) who noted an increase in consecutive dry days or with precipitation less than 1 mm (in Côte d’Ivoire).
The overall purpose of this study is to improve the knowledge of the most impactful climatic extremes of the mangrove rice crop to propose the appropriate adaptation measures for its mitigation, based on two essential objectives:
1st) evaluate recent climate trends in precipitation and air temperature indices in Guinea-Bissau.
2nd) identify the main implications of recent climate trends in Guinea-Bissau for mangrove rice cultivation, the most important crop.
The paper is structured as follows. Section 2 is devoted to the study area, exploited data and methods. The results are presented and discussed in Section 3. Section 4 corresponds to the conclusion.
2. Data and methods
2.1. Study area
The Republic of Guinea-Bissau () is located in West Africa, limited to the North and East by the Republic of Senegal, to the South by the Republic of Guinea-Conakry and to the West by the Atlantic Ocean, covering a total area of 36,125 km2. Guinea-Bissau is located in the intertropical zone and, according to the Köppen climate classification, its climate is of tropical type Aw, with a rainy season in summer and a dry season in winter. The dry season begins in mid-November and lasts until the beginning of May, with the rest of the year corresponding to the rainy season ().
Figure 1. The territory of Guinea-Bissau and its main meteorological stations, with longer climatological series.
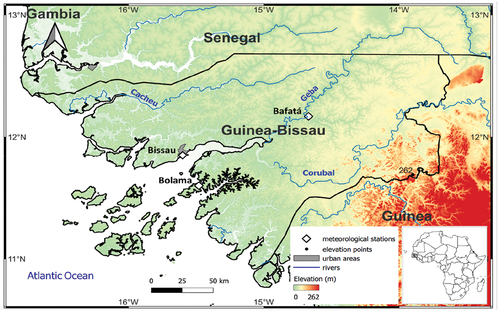
Figure 2. Mean monthly temperature (line) and mean monthly precipitation (columns) in Bissau/Observatory station, over the period 1981–2010. Data source: National Institute of Meteorology of Guinea-Bissau.
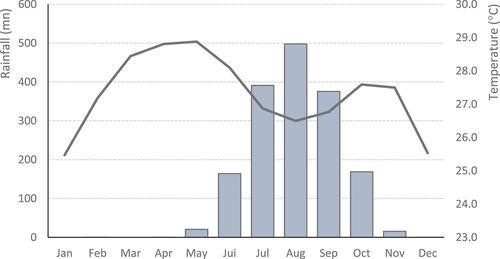
The precipitation regime in West Africa is related to the West African monsoon (Dia-Diop et al., Citation2020; Lélé & Lamb, Citation2010), characterized by the seasonal reversal of wind direction at the lower of the atmosphere, transporting moisture from the Atlantic Ocean to the interior (Quagraine et al., Citation2020). The dominant northeast winds during the dry season (Harmattan) ensure the transport of hot and dry air masses from the Saharan region and are replaced, in the rainy months, by monsoon winds from the southwest, bringing moisture from the Atlantic Ocean to the continent, thus fueling precipitation in West Africa (Fink, Citation2017). The coastal area of the territory is characterized by a sub-Guinean type of tropical climate, with average annual rainfall between 1500 and 2500 mm, while the more inland part is defined by a Sudanese-Guinean type tropical climate with rainfall between 1000 and 1500 mm (Guinea-Bissau, Citation2018). Average monthly temperatures vary from 24°C to 27°C during the year, with January and December being considered the coldest months while March and April are the hottest months of the year ().
Guinea-Bissau grapples with the status of a low-income nation, holding the 175th position among 189 countries in the 2020 Humanitarian Index. This predicament stems from a series of political crises and institutional fragilities persisting since its independence. Shockingly, 69% of its populace resides below the poverty threshold (WFP, Citation2021). Agriculture stands as a keystone of Guinea-Bissau’s economy, constituting one-third of its gross domestic product (GDP) and engaging 68% of the labor force. The sector is predominantly marked by cashew cultivation, representing a staggering 90% of the country’s total exports, alongside rice production tailored for domestic consumption, as highlighted in the (WFP’s, Citation2021) report. Moreover, beyond agriculture, the nation derives significant economic value from its fisheries and forestry sectors (FAO, Citation2023).
Rice (Oriza sativa; Oriza glaberrima) is one of the most cultivated and most consumed cereals in the country (Chauhan et al., Citation2017; Medina, Citation2008) but, currently, its production does not cover the needs of national consumption, this deficit being filled by imports of rice, especially from Asian countries (Guinée-Bissau, Citation2015). Due to the lack of organized and reliable agricultural data at the national level, is difficult to indicate accurate statistics. According to Guinea-Bissau (Citation2018), the production deficit was estimated to exceed 200,000 tons in 2009/2010, with domestic production meeting only 47% of consumption. Rice stands as the primary agricultural production in the country, cultivated mainly for local consumption by the population (Garbanzo, Cameira, et al., Citation2024; Medina, Citation2008) and its cultivation depends essentially on rainfall agriculture. With the increase of population (INE, Citation2017), its consumption has also increased. Nevertheless, its cultivation is confronted with several challenges linked to irregular rainfall and climatic extremes (Diatta et al., Citation2021; Mendes, Citation2017; Mendes & Fragoso, Citation2023), as also soil, water and salinity management (Garbanzo, Céspedes, et al., Citation2024). This challenging problems threats food sovereignty of the population who work directly in the agricultural sector. Moreover, impacts of climate change on mangrove ecosystems significantly impact local fishing communities, disrupting the rich diversity of species and salt extraction activities crucial for their sustenance.
In Guinea-Bissau, there are three rice production systems: the upland rice system (N’pampam); the lowland swamp rice system (Bas fond) and the mangrove swamp rice system. Among these, the most productive one is the mangrove swamp rice system. This technique involves clearing a portion of the mangrove forest to establish agricultural fields, followed by the construction of protective dikes to shield the new area from saltwater intrusion, rendering the land suitable for rice cultivation (Penot, Citation1994). The rice fields on mangrove lands located in banks of the Cacheu River stand out in the north, in the center of the Mansôa River valley (Oio region) and the sectors to the south of the Geba River and along different rivers in the Tombali region (Penot, Citation1994). Mangrove forests, in addition to providing areas suitable for rice cultivation, also play a very important role for local communities through fishing, as they are spawning areas for many marine species (FAO, Citation2009; IRD, Citation1999) and present a rich diversity of fish, mollusks and shellfish, also allowing the extraction of salt for culinary purposes in addition to being able to function as buffer zones (protection) during high tides.
2.2. Daily and monthly meteorological data
Climatological data were collected from the Guinea-Bissau Meteorology Institute database, selecting the available continuous series with the longest duration and, therefore, more suitable for into climate variability research. Observational data retrieved correspond to daily total precipitation, daily maximum temperature, and daily minimum temperature series covering a period of 40 years (1981–2020), registered within the three main meteorological stations of the country (Bissau/Observatory, Bafatá, and Bolama, whose locations are represented in ). Monthly data series from the same meteorological stations and parameters were also used, in addition, for the period 1960–2020 (). Due to the lack of daily data from the period 1960–1980, the option was to define the longer period 1960–2020 for monthly and annual series analysis and adopt the more recent series 1981–2020 to calculate the daily climate indices. The data used in this study are accessible through official contact with National Institute of Meteorology of Guinea-Bissau.
Table 1. Monthly and daily meteorological observations that were used in this study. Source: National Institute of Meteorology of Guinea-Bissau.
2.3. Quality control
Several methodological procedures were applied to verify the quality of the climatological series, including the use of CLIMPACT2 software operational functions, recommended by a panel of experts from the World Meteorological Organization (https://climpact-sci.org/about/project/).
Gaps (missing values) were checked by automatically counting the number of days without registration during a year. In this verification, Bissau/Observatory station did not present any missing data in each of the observed parameters. Bafatá station does not present any maximum and minimum temperature data in 2018 and 2019 and presented 24.6% of gaps in 2020, corresponding to 3 months of observation. Finally, concerning the Bolama station, anomalies were observed in the minimum temperature values for 2015–2020, corresponding to 15% of the data, which were considered faulty and excluded from the analyses.
Four homogeneity tests were used to detect possible inhomogeneities in the precipitation and temperature data series. The tests were the Pettitt test, the SNHT test, the Buishand test and the Von Neumann test (Ahmad & Deni, Citation2013; Piticar & Ristoiu, Citation2012) under null (H0) or alternative (Ha) hypothesis according to the presence of a trend throughout the series. When analyzing the results of these tests, the p-value corresponds to the significance level of the trend. As commonly adopted, if the p-value is less than 0.05 (δ), the null hypothesis (H0) is rejected in favor of the alternative hypothesis (Ha) and the test result is declared statistically significant. On the contrary, if the p-value is greater than this value, is accepted the alternative hypothesis.
The tests were carried out using the XLSTAT tool (Begum & Najim, Citation2020). Homogeneity tests were conducted on the temperature series, specifically on the monthly mean maxima and monthly mean minima values. For precipitation, the tests were applied to two series: the count of days with precipitation equal to or exceeding 1 mm during the rainy months of the year, and the series of monthly precipitation.
2.4. Calculating indices and trend analysis
Regarding the firstly above-mentioned task, the Climpact tool (https://climpact-sci.org/) was used to calculate extreme climate indices (Gbode et al., Citation2019; Santos et al., Citation2019). The selected climate indices were based on the indices recommended by the panel of experts on climate change detection, monitoring, and indices (ETCCDMI) (Bedoum et al., Citation2017; Reis et al., Citation2020; Yin & Sun, Citation2018), as well as considering the relevance that these indices assume in the context of agroclimatic conditions for rice crop. Temperature extreme indices used in this study are detailed in , while specifies the list of daily precipitation extreme indices.
Table 2. Temperature indices used in this study.
Table 3. Precipitation indices used in this study.
To evaluate the trends of the selected indices, the non-parametric Mann–Kendall test was applied. This test was used in numerous studies, such as Reis et al. (Citation2020), Santos et al. (Citation2019). To evaluate the magnitude of the trends, Sen’s slope estimator was used (Rathnayaka et al., Citation2021; Sen, Citation1968), through the MAKESENS tool, accessible at https://en-beta.ilmatieteenlaitos.fi/makesens. The MAKESENS tool incorporates the parameters that allow calculating the Mann–Kendall test under the null (H0) or alternative (Ha) hypothesis at the 5% significance level and the magnitude of the trend using the Sen slope estimator. The variation in trend is considered significant when the obtained p ≤ 0.05, otherwise, it is not significant.
3. Results and discussion
3.1. Precipitation trends
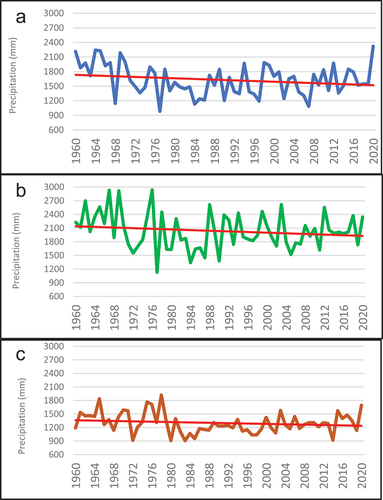
The study of the evolution of precipitation in Guinea-Bissau over the longer period 1960–2020 reveals that, despite the slight reduction observed in in each of the three meteorological stations, no significant trend was detected. In a more detailed analysis, in addition to this general trend of decreasing precipitation throughout the climatological series, it is possible to identify three particular periods: the first period corresponds to 1960–1967, characterized as being the wettest period of the entire series; the second period is defined by the years 1968–1990, characterized by a greater predominance of dry years, such as the years 1968 (), 1972 (), 1977 and 1984 () and 1981 and 1982 (, c); finally, the third and final period corresponds to 1991–2020, and presented a stronger precipitation variability and also a greater frequency of wet years, revealing a relative increase in precipitation in this Western Africa region.
Figure 3. Interannual precipitation variability (1960–2020). (a) Bissau/Observatory; (b) Bolama; (c) Bafatá.
The results of the Mann–Kendall test and the Sen slope estimator () concerning to the series of total annual and monthly precipitation in the period 1960–2020 for the months that correspond to the rainy season (May to October) reveal, in the three stations, a tendency for precipitation decrease in almost all months, except September and October – in this last case, except Bolama. The trend of decreasing precipitation over the period 1960–2020 only reached statistical significance in August in Bissau/Observatory, representing a decrease in monthly precipitation of 18.6 mm per decade. In a general analysis, it should be noted that the greatest reductions in precipitation were recorded in July and August, considered the rainiest months of the entire year ().
Table 4. Estimated trends (by decade) of total monthly precipitation, for the three studied stations, over the period 1960 to 2020.
The availability of daily data for the period 1981–2020 made it possible to carry out a detailed analysis of the evolutionary behavior of extreme precipitation indices over the last 40 years. As for the total annual precipitation (PRCPTOT), represented in , the Bissau/Observatory station (.A-1) and Bolama (.B-1), present an increase of 51.8 mm and 42.0 mm/decade, respectively, while Bafatá (. C-1) shows a significant increase of 82.6 mm/decade.
Figure 4. Interannual variability of precipitation indices in Guinea-Bissau over the period 1981 to 2020. (A: Bissau/Observatory; B: Bolama; C: Bafatá; PRCPTOT: Annual sum of daily precipitation ≥ 1.0 mm; CDD: Maximum annual number of consecutive dry days (when precipitation < 1.0 mm); RX5DAY: Maximum annual 5−day precipitation total; SDII: Annual total precipitation divided by the number of wet days (when total precipitation ≥ 1.0 mm).
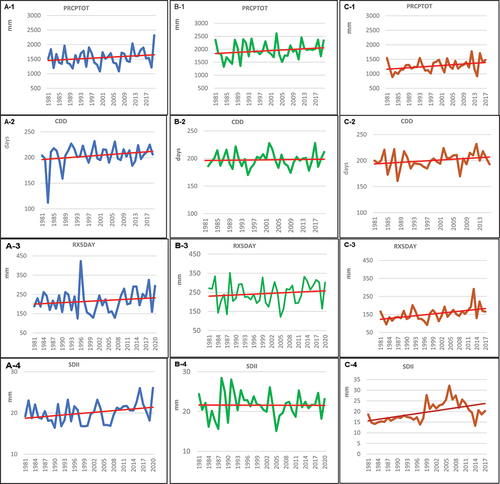
The annual maximum number of consecutive days without or with precipitation <1.0 mm (CDD) tends to increase in almost all areas. A significant increase was observed in Bafatá (.C-2), but the same was not observed in Bissau (.A-2) and Bolama (.B-2). The maximum annual precipitation on five consecutive days (RX5day) showed a significant increase in all three locations, although only at the Bafatá station (.C-3) did this increase have statistical significance. Similar evidence of a positive trend (increase) was also found in relation to the indices R10 mm, R20 mm and R30mm corresponding to the annual number of days in which precipitation is ≥10 mm, ≥20 mm and ≥30 mm respectively, as well as the indices r95P, 95ptot, prcptot, r × 1 day and r × 3 day. In the period 1981–2020, there is, therefore, an increase in the frequency of intense daily precipitation in the three stations, but with a stronger signal, and with unequivocal statistical significance in Bafatá, the most inland location.
As for precipitation intensity (SDII), a significant increasing trend was detected in Bafatá (.C-4). The index corresponding to the annual maximum of consecutive wet days or with precipitation ≥1.0 mm (CWD) tended to increase significantly in Bolama and decrease significantly in Bafatá, whilst in Bissau no changes were detected. summarizes the climatic precipitation indices and their variations as well as their significance, while demonstrates the variability of some precipitation indices and their evolution trends.
Table 5. Estimated trends (by decade) of precipitation indices, for the three studied stations, over the period 1981 to 2020.
3.1. Temperature trends
summarizes the trends in the monthly temperature indices over the long-term period of analysis (1960–2020) and annual average for the same period. This table reveals that 82% of the estimated trends point to a warming evolution over these 61 years, and it should be noted that in 54% of them, the trends are statistically significant. Positive trends (warming) are observed in every month of the year. It is in Bissau/Observatory that the warming trends are strongest, reaching variations per decade that are always stronger in the case of average maximum temperatures (TX) than in average minimum temperatures (TN). For TX, the estimated highest changes by decade surpassed 0.3°C in March, July, August, September, and December, while the changes for TN varied between 0.15°C and 0.25°C.
Table 6. Summary of the trends of temperature indices for the period 1960–2020. TX: monthly average of maximum temperature; TN: monthly average of minimum temperature.
The annual series of TN and TX show significant trends of increase in Bissau (coastal zone, TX= +0.26°C and TN= +0.18°C per decade) and Bafatá (continental zone, TX= +0.16°C and TN= +0.15°C per decade), while in Bolama (Bijagós islands) there were no significant trends.
The availability of daily data for the period 1981–2020 allowed the computation of trends of daily temperature indices for the three analyzed meteorological stations. The results are shown in and selected trends can be observed in . The overall warming trends described over the longer period (1960–2020) encompass some relevant features within the more recent decades that must my highlighted. The frequency of hot days (TXge30) and very hot days (TXge35) increased in each of the locations, with a stronger magnitude in Bissau/Observatory (+14 days and 8 days per decade respectively). Accordingly, the duration of the longest warm spell has also increased in all stations, again with a more expressive change in the station located in the capital (Bissau/Observatory). Another change that must be noted is the increase in the mean diurnal temperature range (Mean annual difference between daily TX and daily TN), which has also increased both in Bissau and Bafatá (with statistical significance), while in Bolama the change was not significant.
Figure 5. Interannual variability of temperature indices in Guinea-Bissau over the period 1981 to 2020. (A: Bissau/Observatory; B: Bolama; C: Bafatá; TXge30: Annual number of days when TX ≥ 30°C; TXge35: Annual number of days when TX ≥ 35 degrees_ºC; dtr: Mean annual difference between daily TX and daily TN.
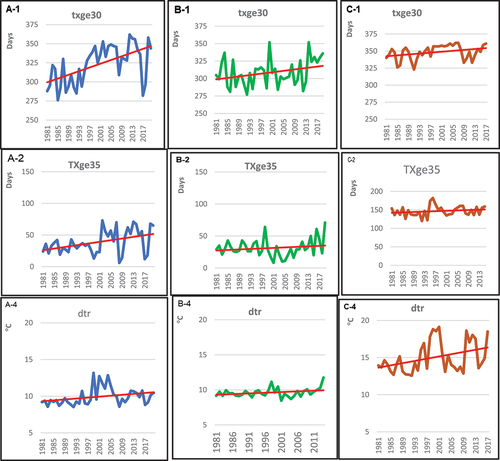
Table 7. Summary of the trends of daily temperature indices for the period 1981–2020.
The absolute minimum temperatures decreased over the 1981–2020 in the coastal areas of the country (Bissau and Bolama) by 0.83°C and 1.30°C per decade, respectively, while in the continental area (Bafatá) there was no change.
3.3. Discussion
In its report (IPCC et al., Citation2022), the IPCC points out an increase in average annual temperatures of 1–3°C since the mid-1970s, and in Africa, this increase was most significant in the Sahara and the Sahel. The research carried out here demonstrated that the global climate changes that planet Earth is currently facing are also quite evident in Guinea-Bissau. Extreme weather events are increasingly frequent and intense across the entire territory. It’s important to note that the scope of the results in this study was somewhat limited by the number of available meteorological stations with long-term data and their scarce spatial distribution across the national territory. Inevitably, the small number and uneven distribution of available national meteorological stations brings some uncertainty in the analysis of climate trends and their spatial patterns (Xu et al., Citation2017; Zhou et al., Citation2023).
In the present investigation, the monthly average maximum temperatures showed significant increasing trends in the period 1960–2020, especially in the months that coincide with the different phases of the development of the mangal rice plant (June to November), while the monthly average minimum temperatures also followed the same increasing trend (except for June and July, in Bolama). As maximum temperatures continue to rise during critical stages of rice development, this crop will inevitably suffer, leading to adverse effects on production. This may jeopardize the food sovereignty of the peasant communities reliant on rice farming for their sustenance. With the rise in monthly temperatures, the average annual maximum and minimum temperatures have also increased over the same period. The detected trend of increasing maximum and minimum temperature in Guinea-Bissau over the period 1960–2020 is in line with regional trends identified in other studies focused on West Africa, such as USAID (Citation2018), Barry et al. (Citation2018) and the IPCC report (Citation2022). Other studies conducted in different regions of the world also indicate an increase in annual average maximum and minimum temperatures, such as Fante and Neto (Citation2017) and Shen et al. (Citation2018).
The analysis of the evolutionary behavior of days in which maximum temperatures equal or exceed 30 and 35°C demonstrated an increasing trend throughout the climatological series (1981–2020), and the magnitude of the trends were more visible and statistically significant in Bissau (13 and 8 days, respectively) and Bafatá (4 and 5 days, respectively) than in relation to Bolama. These results are in line with those obtained by (Moron et al., Citation2016), who estimated an increase in the frequency of days with a maximum temperature above 35°C from 1 to 9 days, per decade, in West Africa, in the period 1961–2014. The detected increasing trends of hot and very hot days in the current study may represent detrimental impacts on rice cultivation in Guinea-Bissau since temperatures above 35°C can be harmful causing the abortion of rice flowers and a higher percentage of the sterility of spikelets (Chauhan et al., Citation2017; Yoshida, Citation1981; Zingore et al., Citation2014). On the other hand, the annual percentage of days in which the maximum temperature is above the 90th percentile (TX90P) also showed an increase across the entire territory, showing the most significant increases in Bissau and Bafatá. Rising temperatures accelerate plant evapotranspiration (Kim et al., Citation2013), which, when combined with decreased precipitation, worsens water stress. This situation can potentially have detrimental impacts on crops, resulting in production losses. Additionally, it contributes to the depletion of river flows and groundwater reserves, which serve as vital sources of drinking water for the population.
Less expectably, it was found that the absolute minimum temperatures (tnn) showed a significant decreasing trend in Bissau and Bolama. Nevertheless, this result is in line with the results of Barry et al. (Citation2018), who identified trends of decrease in absolute minimum temperature in 3% to 4% of the time series studied in West Africa (period 1960–2010), especially in northern Togo and northwestern Nigeria. Possible causes of this behavior are not clarified, and may be related to the effects of changes in land cover or decadal variations in regional atmospheric circulation (Mupangwa et al., Citation2023).
Regarding the evolution of total annual precipitation (1981–2020), an increase of 42,0–82.6 mm/decade was detected in the study, being significant in Bafatá, contrary to what was found in the longer climatological series − 1960–2020, where a slight decreasing behavior was observed. In fact, the period of the 70s was predominantly dry in West Africa (Djossou et al., Citation2017; Nouaceur & Murarescu, Citation2020) while the most recent series, from 1981 to 2020, exhibited a slight increase, denoting a return of precipitation in the region (Barry et al., Citation2018; Descroix et al., Citation2015; Nouaceur & Murarescu, Citation2020).
The results at the monthly scale in the present study are coherent with those related to annual precipitation. In the period 1960–2020, there was a slight decline in monthly precipitation in every studied stations. Nevertheless, this decrease was only statistically significant in August in Bissau.
This recent trend of observed increased precipitation has also been described for many West African countries, reinforcing evidence that the region has experienced a return to wetter conditions since the end of the last millennium (Barry et al., Citation2018; Blunden & Boyer, Citation2021; CDKN & ACDI, Citation2022, 2015; Dike et al., Citation2020; Nkrumah et al., Citation2019; Sylla et al., Citation2016). The causes of the return of precipitation in the Sahel and West Africa may be related to the surface temperature of the North Atlantic Ocean (Nouaceur & Murarescu, Citation2020) or explained by anomalies in atmospheric circulation on a planetary or regional scale (Biasutti, Citation2019; Nouaceur & Murarescu, Citation2020), linked to the El Niño-Southern Oscillation (ENSO) phenomenon (Emmanuel, Citation2022; Henchiri et al., Citation2021). On the other hand, the IPCC (Citation2022) in its report (climate change, 2022) describes the negative trends and increased interannual variability of precipitation observed between 1960 and 1980 in western Africa, a period that includes the drought years 1970–1973 observed in the 1960s (Rodier & Roche, Citation1973). This reduction in precipitation described in the IPCC report (Citation2022) between the years 1960–1980 is an aspect with which the results obtained in the present investigation also converge about the evolution of precipitation over a longer period (1960–2020).
The last set of findings of the current research concerns daily precipitation indices. An increase in consecutive days without rain was also noted, especially in Bissau and Bafatá in the 1981–2020 climatological series, to the detriment of wet days, and at the same time, an increase in total precipitation and its intensity in almost the entire country., in agreement with what was observed by Barry et al. (Citation2018). Concerning the maximum annual precipitation of 5 consecutive days (RX5day), an increase was found between 8 and 16 mm/decade, which was significant only in Bafatá, and the annual number of days with precipitation greater than 10 mm and 20 mm (R10mm and R20mm) recorded an increase between 0.4 and 2.3 days/decade, respectively, which leads to the realization that, despite the decrease in the number of wet days during the rainy season, the annual total is offset by very rainy days, translated by the significant increase of precipitation intensity (SDII).
These results are in line with those observed by Dike et al. (Citation2020), in Nigeria, between the period 1975–2013, who identified an increase in total annual precipitation (PRCPTOT), from the maximum annual total of 5 consecutive days (RX5day), and precipitation intensity (SDII). Likewise, Barry et al. (Citation2018) also estimated the increase in the RX5day indices at 7.1 mm/decade, R10mm at 1.3 days/decade and R20mm at 0.2 days/decade, between 1981 and 2010, in West Africa.
Intense rainfall, often leading to flooding, poses significant challenges to crop development. The stress induced by excess water results in agricultural production losses, reducing tillering and the photosynthetic area as crops become saturated (Daku et al., Citation2022; FAO, Citation2003, 2018). Conversely, drought or prolonged rainfall interruptions impact all crop stages, causing leaf curling, scorching, stunted growth, delayed flowering, spikelet and panicle sterility, and incomplete seed filling, ultimately reducing yields (FAO, Citation2018; PhilRice, Citation2014). The shortening of rainy season disrupts agricultural activities, especially affecting rice cultivation (Ayanlade et al., Citation2018; Diedhiou et al., Citation2018; USAID, Citation2018). This disruption particularly hampers the growth phases of long-cycle rice varieties, which necessitate more water and time for their development (van Oort & Zwart, Citation2018). Consequently, there is a notable drop in rice production (Padhy et al., Citation2022), increasing the risk of food insecurity.
The recent climate changes identified in Guinea-Bissau in this research are likely to cause important impacts in different areas, in particular on agriculture and ecosystems in mangrove regions, but also on human health.
The reduction in total rainfall and its irregularity in the country can impact the mangrove rice crop, which needs enough water for the leaching of salt in the plots for a good development of the crops. Mangrove ecosystems, due to their location between the sea and the mainland, will be impacted by rising temperature trends because this phenomenon is related to sea level rise that will flood the mangroves and if they exceed the physiological tolerance of the trees, and impact will be even greater (Lovelock et al., Citation2015).
According to the IPCC, by 2023, in all regions, the increase in extreme heat will result in human mortality and morbidity. Changes in temperature and precipitation affect the availability of food and water, increasing the risk of malnutrition and starvation. Extreme rainfall causes incidences of waterborne and vector-borne diseases (Coates et al., Citation2020), diarrheal diseases, and cholera (WMO, Citation2022). Rising temperatures in West Africa will increase malaria in some parts and decrease in other parts and increase cardiovascular and respiratory diseases and strokes (CDKN & ACDI, Citation2022).
Maximum temperatures have increased over the last 40 years (1981–2020), and the occurrence of periods of extreme heat could mean that harmful temperatures were recorded at certain stages of the development of rice cultivation.
Regarding the effects of recent climate change on agriculture and the cultivation of mangrove rice in the coastal regions of Guinea-Bissau, several adaptation strategies and measures can be explored. According to Hussain et al., (Citation2022) and Padhy et al., (Citation2022), these adaptation measures that be carried out by the peasants include four main issues: adjustments of cultivation dates; use of climate forecasts for planning agricultural activities; choice of cycle varieties suitable for each rain season; and development of protective dike structures resistant to rising sea level. On the other hand, it is very important that the entities responsible for national agricultural policy can support investment in rice cultivars with higher yields and tolerance to salt and water stress.
4. Conclusion
The study of the evolution of annual and monthly precipitation in Guinea-Bissau over the period 1960–2020 reveals a slight decreasing trend throughout the climatological series, contrary to the monthly average maximum and minimum temperatures that show significant increasing trends for the same period.
Despite rainfall showing an increasing trend in Guinea-Bissau between 1981–2020, the irregularity in terms of start and end dates of the rainy season constitutes a major threat for farmers when it comes to planning agricultural activities and selecting varieties adaptable to each rainy season. The intensity of rain in short periods and the maximum daily rainfall also registered a significant increase, which can aggravate the risk of floods that inundate rice fields and other crops, making agricultural activities even more difficult.
The annual averages of TX and TN (1960–2020) show significant trends of increase in Bissau and Bafatá and no significant trends in Bolama, while mean monthly TN and TX especially during the rainy season (June to October) for de same period, show significant trends of increase for all locations.
On the other hand, the annual number of days when TX ≥ 30 and 35°C over the last 40 years (1981–2020) have increased in all seasons with a very significant upward trend. Periods of extreme heat could mean that harmful temperatures are recorded at certain stages of the development of rice cultivation and short-cycle varieties may eventually be affected by the increase in extreme maximum temperatures, with possible effects on reducing its vegetative cycle and consequently, generating lower productivity.
Rice farmers in Guinea-Bissau are faced with complex challenges arising from climate change. Some of the possible adaptation strategies are within their reach, while others require government involvement for their implementation and eventually support by regional and international institutions.
This research should continue through a more in-depth study of changes in the length of the rainy season and its potential implications for rice production in this West African country.
Disclosure statement
No potential conflict of interest was reported by the author(s).
Additional information
Funding
References
- Adama, F., Camara, I., Noblet, M., Analytics, C., & Mboup, S. D. (2019). Evaluation de la vulnérabilité du secteur agricole à la variabilité et aux changements climatiques dans la région de Fatick (Sénégal). Climate Analytics, 96.
- Ahmad, N. H., & Deni, S. M. (2013). Homogeneity test on daily rainfall series for Malaysia. Matematika, 29(1c), 141–150.
- Ayanlade, A., Radeny, M., Morton, J. F., & Muchaba, T. (2018). Rainfall variability and drought characteristics in two agro-climatic zones: An assessment of climate change challenges in Africa. Science of the Total Environment, 630, 728–737. https://doi.org/10.1016/j.scitotenv.2018.02.196
- Barry, A. A., Caesar, J., Klein Tank, A. M. G., Aguilar, E., McSweeney, C., Cyrille, A. M., Nikiema, M. P., Narcisse, K. B., Sima, F., Stafford, G., Touray, L. M., Ayilari-Naa, J. A., Mendes, C. L., Tounkara, M., Gar-Glahn, E. V. S., Coulibaly, M. S., Dieh, M. F., Mouhaimouni, M., Oyegade, J. A. & Laogbessi, E. T. (2018). West Africa climate extremes and climate change indices. International Journal of Climatology, 38(S1), e921–e938. https://doi.org/10.1002/joc.5420
- Bedoum, A., Biona, C. B., Pierre, B. J., Adoum, I., Mbiake, R., & Baohoutou, L. (2017). Évolution des indices des extrêmes climatiques en République du Tchad de 1960 à 2008. Atmosphere-Ocean, 55(1), 42–56. https://doi.org/10.1080/07055900.2016.1268995
- Begum, S. L. R., & Najim, M. M. M. (2020). A ssessment of climate extremes based on SPI in WL1 a agroecological zone - a case study from Kuruwita, Sri Lanka. Sri Lanka Journal of Technology, 1(1), 1–6. https://doi.org/10.1175/JCLI3670.1
- Biasutti, M. (2019). Rainfall trends in the African sahel: Characteristics, processes, and causes. Wiley Interdisciplinary Reviews: Climate Change, 10(4), 1–22. https://doi.org/10.1002/wcc.591
- Blunden, J., & Boyer, T. (2021). State of the climate in 2020. Bulletin of the American Meteorological Society, 102(8), 481. https://doi.org/10.1175/2021BAMSStateoftheClimate.1
- CDKN, & ACDI. (2022). The IPCC’s sixth assessment report. Impacts, adaptation options and investment areas for a climate-resilient West Africa.
- Chauhan, B. S., Jabran, K., & Mahajan, G. (2017). Rice Production Worldwide (2017th ed.). Springer International Publishing. https://doi.org/10.1007/978-3-319-47516-5_4
- Coates, S. J., Enbiale, W., Davis, M. D. P., & Andersen, L. K. (2020). The effects of climate change on human health in Africa, a dermatologic perspective: A report from the international society of dermatology climate change committee. International Journal of Dermatology, 59(3), 265–278. https://doi.org/10.1111/ijd.14759
- Daku, E. K., Salack, S., Worou, O. N., & Ogunjobi, K. (2022). Maize response to temporary floods under ambient on-farm conditions of the west African sahel. Environmental Research Communications, 4(4), 11. https://doi.org/10.1088/2515-7620/ac6073
- Descroix, L., Diongue Niang, A., Panthou, G., Bodian, A., Sane, Y., Dacosta, H., Malam Abdou, M., Vandervaere, J.-P., & Quantin, G. (2015). Évolution récente de la pluviométrie en Afrique de l’ouest à travers deux régions : la Sénégambie et le bassin du Niger moyen. Climatologie, 12, 25–43. https://doi.org/10.4267/climatologie.1105
- Dia-Diop, A., Zebaze, S., Wade, M., Djiondo, R. N., Diop, B., Efon, E., & Lenouo, A. (2020). Interannual variability of rainfall over the West Africa Sahel. Journal of Geoscience and Environment Protection, 08(3), 85–101. https://doi.org/10.4236/gep.2020.83007
- Diatta, S., Thiandoum, A., Mbaye, M. L., Sarr, A. B., & Camara, M. (2021). Projected climate risks for rice crops in casamance, Southern Senegal. African Journal of Environmental Science and Technology, 15(February), 69–84. https://doi.org/10.5897/AJEST2020.2963
- Diedhiou, A., Bichet, A., Wartenburger, R., Seneviratne, S. I., Rowell, D. P., Sylla, M. B., Diallo, I., Todzo, S., Touré, N. E., Camara, M., Ngatchah, B. N., Kane, N. A., Tall, L., & Affholder, F. (2018). Changes in climate extremes over West and Central Africa at 1.5 °c and 2 °c global warming. Environmental Research Letters, 13(6). https://doi.org/10.1088/1748-9326/aac3e5
- Dike, V. N., Lin, Z., & Ibe, C. C. (2020). Intensification of summer rainfall extremes over nigeria during recent decades. Atmosphere, 11(10), 20. https://doi.org/10.3390/atmos11101084
- Djossou, J., Akpo, A. B., Affewe, J. D., Donnou, H. E. V., Liousse, C., Léon, J.-F., Nonfodji, F., & Awanou, C. (2017). Dynamics of the inter tropical front and rainy season onset in benin dynamics of the inter tropical front and rainy season onset in benin. Current Journal of Applied Science and Technology, 24(2), 1–15. https://doi.org/10.9734/CJAST/2017/36832
- Emmanuel, I. (2022). Linkages between El Niño-Southern Oscillation (ENSO) and precipitation in West Africa regions. Arabian Journal of Geosciences, 15(7), 1–11. https://doi.org/10.1007/s12517-022-09942-2
- Fante, K. P., & Neto, J. L. S. (2017). Mudanças nos Padrões da Temperatura do Estado de São Paulo/Brasil nos Últimos 50 Anos Temperatures Standards Changes in São Paulo State/Brazil in the Last 50 Years. Revista Do Departamento de Geografia, 33, 12–23. https://doi.org/10.11606/rdg.v33i0.125767
- FAO. (2003). In R. C. Chaudhary, J. S. Nanda, & D. V. Tran (eds.), Guide d’identification des contraintes de terrian à la production de riz. FAO. http://www.fao.org/3/y2778f/y2778f00.htm#Contents
- FAO. (2009). L ’ importance des forêts de mangrove pour la pêche, la faune sauvage et les ressources en eau en Afrique. Nature et Faune, 143. www.fao.org/africa/publications/nature-and-faune-magazine/%5CnNature
- FAO. (2016). La situation mondiale de l’alimentation et de l’agriculture. Changement climatique, agriculture et sécurité alimentaire. https://www.fao.org/3/i6030f/i6030f.pdf
- FAO. (2023). World food and agriculture – statistical yearbook 2023. World Food and Agriculture – Statistical Yearbook 2023. https://doi.org/10.4060/cc8166en
- Faye, A., & Akinsanola, A. A. (2021). Evaluation of extreme precipitation indices over West Africa in CMIP6 models. Climate Dynamics, 0123456789(3–4), 925–939. https://doi.org/10.1007/s00382-021-05942-2
- Fink, A. H. (2017). Meteorology of tropical West Africa (2DQ ( ed.). U. 9600 Garsington Road.
- Garbanzo, G., Cameira, M. D. R., & Paredes, P. (2024). The mangrove swamp rice production system of Guinea Bissau: Identification the mangrove swamp rice production system of guinea bissau: identification of the main constraints associated with soil salinity and rainfall variability. Agronomy, 14(3), 468. https://doi.org/10.3390/agronomy14030468
- Garbanzo, G., Céspedes, J., Sandoval, J., Temudo, M., Paredes, P., & Rosário, M. (2024). Moving towards the biophysical characterization of the mangrove swamp rice production system in Guinea Bissau: Exploring tools to improve soil and water use efficiency. Agronomy, 14(2), 23. https://doi.org/10.3390/agronomy14020335
- Gbode, I. E., Adeyeri, O. E., Menang, K. P., Intsiful, J. D. K., Ajayi, V. O., Omotosho, J. A., & Akinsanola, A. A. (2019). Observed changes in climate extremes in Nigeria. Meteorological Applications, 26(4), 642–654. https://doi.org/10.1002/met.1791
- Gbode, I. E., Akinsanola, A. A., & Ajayi, V. O. (2015). Recent changes of some observed climate extreme events in kano. International Journal of Atmospheric Sciences, 2015, 1–6. https://doi.org/10.1155/2015/298046
- Guinea-Bissau. (2018). Third national communication: Report to the United Nations framework convention on climate change. Republic of Guinea-Bissau, Bissau. Report to the United Nations Framework Convention on Climate Change (Issue January). web: http://environment.gov.gb
- Guinée-Bissau. (2015). Plan strategique et operationnel 2015-2020 « Terra Ranka ». https://prais.unccd.int/sites/default/files/2018-09/PlanStrategiqueGB 2025-Rapport Final-14-3-2015.pdf
- Henchiri, M., Igbawua, T., Javed, T., Bai, Y., Zhang, S., Essifi, B., Ujoh, F., & Zhang, J. (2021). Meteorological drought analysis and return periods over north and west africa and linkage with el niño–southern oscillation (Enso). Remote Sensing, 13(23), 32. https://doi.org/10.3390/rs13234730
- Hussain, S., Huang, J., Huang, J., Ahmad, S., Nanda, S., Anwar, S., Shakoor, A., Zhu, C., Zhu, L., Cao, X., & Jin, Q. (2022). Rice production under climate change: Adaptations and mitigating strategies. Environment, Climate, Plant and Vegetation Growth. https://doi.org/10.1007/978-3-030-49732-3_26
- INE. (2017). Boletim Estatístico da Guiné-Bissau. Guiné-Bissau em números. 79.www.stat-guinebissau.com
- IPCC. (2018). Global warming of 1.5°C. An IPCC Special Report on the impacts of global warming of 1.5°C above pre-industrial levels and related global greenhouse gas emission pathways. The Context of Strengthening the Global Response to the Threat of Climate Change. https://doi.org/10.1017/9781009157940
- IPCC. (2021). Climate change 2021. in the physical science basis. contribution of working group 1 to sixth assessment report of the intergovernmental panel on climate change.
- IPCC. (2023). Climate Change 2023: Synthesis report. contribution of working groups i, ii and iii to the sixth assessment report of the intergovernmental panel on climate change. Ipcc.
- IRD. (1999). Rivières du Sud. Sociétés et Mangroves Ouest-Africaines. Institut de Recherche pour le Développement.
- Jägermeyr, J., Müller, C., Ruane, A. C., Elliott, J., Balkovic, J., Castillo, O., Faye, B., Foster, I., Folberth, C., Franke, J. A., Fuchs, K., Guarin, J. R., Heinke, J., Hoogenboom, G., Iizumi, T., Jain, A. K., Kelly, D., Khabarov, N., Lange, S. & Rosenzweig, C. (2021). Climate impacts on global agriculture emerge earlier in new generation of climate and crop models. Nature Food, 2(11), 873–885. https://doi.org/10.1038/s43016-021-00400-y
- Kangah, P. A. D. (2004). Rainfall and agriculture in central West Africa since 1930 [University of Oklahoma]. https://core.ac.uk/download/pdf/215260474.pdf
- Kim, H. Y., Ko, J., Kang, S., & Tenhunen, J. (2013). Impacts of climate change on paddy rice yield in a temperate climate. Global Change Biology, 19(2), 548–562. https://doi.org/10.1111/gcb.12047
- Kouman, K. D., Kabo-Bah, A. T., Kouadio, B. H., & Akpoti, K. (2022). Spatio-temporal trends of precipitation and temperature extremes across the North-East region of Côte d’Ivoire over the period 1981–2020. Climate, 10(5), 25. https://doi.org/10.3390/cli10050074
- Lélé, M. I., & Lamb, P. J. (2010). Variability of the Intertropical Front (ITF) and rainfall over the West African Sudan–Sahel Zone. Journal of Climate, 23(14), 3984–4004. https://doi.org/10.1175/2010JCLI3277.1
- Lovelock, C. E., Adame, M. F., Bennion, V., Hayes, M., Reef, R., Santini, N., & Cahoon, D. R. (2015). Sea level and turbidity controls on mangrove soil surface elevation change. Estuarine, Coastal and Shelf Science, 153, 1–9. https://doi.org/10.1016/j.ecss.2014.11.026
- Ly, M., Traore, S. B., Alhassane, A., & Sarr, B. (2013). Evolution of some observed climate extremes in the West African Sahel. Weather and Climate Extremes Journal, 1, 19–25. https://doi.org/10.1016/j.wace.2013.07.005
- Medina, N. (2008). O ecossistema orizícola na Guiné-Bissau: principais constrangimentos à produção na zona i (regiões de Biombo, Cacheu e Oio) e perspectivas [Universidade de Lisboa - Instituto Superior de Agronomia]. https://www.repository.utl.pt/handle/10400.5/198/browse?type=advisor&order=ASC&rpp=20&value=Temudo%2C+Marina+Augusta+Pereira+Padrão
- Mendes, O. (2017). Indicadores das mudanças climáticas no leste da Guiné-Bissau e adaptação camponesa. Sintidus, 1, 108–139. https://drive.google.com/file/d/1TfyGvndCQMeMdIL7mDAhZge_4qdw17oz/view
- Mendes, O., & Fragoso, M. (2023). Assessment of the record-breaking 2020 rainfall in Guinea-Bissau and impacts of associated floods. Geosciences, 13(2), 25. https://doi.org/10.3390/geosciences13020025
- Moron, V., Oueslati, B., Pohl, B., Rome, S., & Janicot, S. (2016). Trends of mean temperatures and warm extremes in northern tropical Africa (1961–2014) from observed and PPCA-reconstructed time series. Journal of Geophysical Research: Atmospheres Research, 121(10), 5298–5319. https://doi.org/10.1002/2015JD024303.Received
- Mupangwa, W., Chipindu, L., Ncube, B., Mkuhlani, S., Nhantumbo, N., Masvaya, E., Ngwira, A., Moeletsi, M., Nyagumbo, I., & Liben, F. (2023). Temporal changes in minimum and maximum temperatures at selected locations of Southern Africa. Climate, 11(4). 11(4), 84. https://doi.org/10.3390/cli11040084
- Nicholson, S. E., Funk, C., & Fink, A. H. (2018). Rainfall over the African continent from the 19th through the 21st century. Global and Planetary Change, 165(December 2017), 114–127. https://doi.org/10.1016/j.gloplacha.2017.12.014
- Nkrumah, F., Vischel, T., Panthou, G., Klutse, N. A. B., Adukpo, D. C., & Diedhiou, A. (2019). Recent trends in the daily rainfall regime in Southern West Africa. Atmosphere, 10(12), 1–15. https://doi.org/10.3390/atmos10120741
- Nouaceur, Z., & Murarescu, O. (2020). Rainfall variability and trend analysis of multiannual. Water, 17(1), 1–18.
- Padhy, S. R., Dash, P. K., & Bhattacharyya, P. (2022). Challenges, opportunities, and climate change adaptation strategies of mangrove-agriculture ecosystem in the Sundarbans, India: A review. Wetlands Ecology and Management, 30(1), 191–206. https://doi.org/10.1007/s11273-021-09844-2
- Penot, E. (1994). La riziculture de mangrove de la société balant dans la région de Tombali en Guinée-Bissau. Cirad, January 1994, 209–222. https://doi.org/10.4000/books.irdeditions.3903
- PhilRice. (2014). Climate change and rice production. In R. A. Beronio, A. B. Lanuza, & C. L. B. Gado (Eds.), philippine Rice Research Institute (Vol. 19).
- Piticar, A., & Ristoiu, D. (2012). Analysis of air temperature evolution in northeastern romania and evidence of warming trend. Carpathian Journal of Earth and Environmental Sciences, 7(4), 97–106.
- IPCC[Pörtner, H.-O., Roberts, D. C., Tignor, M., Poloczanska, E. S., Mintenbeck, K., Alegr, A. (2022). Climate change 2022: Impacts, adaptation and vulnerability. contribution of working group ii to the sixth assessment report of the intergovernmental panel on climate change. (Issue Cambridge University Press) https://doi.org/10.1017/9781009325844
- Quagraine, K. A., Nkrumah, F., Klein, C., Klutse, N. A. B., & Quagraine, K. T. (2020). West African summer monsoon precipitation variability as represented by reanalysis datasets. Climate, 8(10), 1–18. https://doi.org/10.3390/cli8100111
- Rathnayaka, S. D., Wijesuriya, W., & Wijesuriya, N. (2021). Appropriate use of statistical methods in rainfall analysis: Detecting monotonic and sequential trends in rainfall. Bulletin of the Rubber Research Institute of Sri Lanka, 55(December), 60–67. https://doi.org/10.13140/RG.2.2.25772.80005
- Reis, L. C. D., Silva, C. M. S. E., Bezerra, B. G., Mutti, P. R., Spyrides, M. H. C., & Silva, P. E. D. (2020). Analysis of climate extreme indices in the MATOPIBA region, Brazil. Geofisica Pura e Applicata, 177(9), 4457–4478. https://doi.org/10.1007/s00024-020-02474-4
- Rodier, J. A., & Roche, M. (1973). La sécheresse actuelle en afrique tropicale quelques données hydrologiques. Hydrological Sciences Bulletin, 18(4), 411–418. https://doi.org/10.1080/02626667309494056
- Roudier, P., Sultan, B., Quirion, P., & Berg, A. (2011). The impact of future climate change on West African crop yields: What does the recent literature say? Global Environmental Change, 21(3), 1073–1083. https://doi.org/10.1016/j.gloenvcha.2011.04.007
- Salack, S., Saley, I. A., & Bliefernicht, J. (2018). Observed data of extreme rainfall events over the West African Sahel. Data in Brief, 20, 1274–1278. https://doi.org/10.1016/j.dib.2018.09.001
- Santos, M., Fonseca, A., Fragoso, M., & Santos, J. A. (2019). Recent and future changes of precipitation extremes in mainland Portugal. Theoretical and Applied Climatology, 137(1–2), 1305–1319. https://doi.org/10.1007/s00704-018-2667-2
- Sen, P. K. (1968). Estimates of the regression coefficient based on Kendall’s tau. Journal of the American Statistical Association, 63, 1379–1389. https://doi.org/10.2307/2285891 (324)
- Shen, X., Liu, B., & Lu, X. (2018). Weak cooling of cold extremes versus continued warming of hot extremes in China during the recent global surface warming hiatus. Journal of Geophysical Research: Atmospheres, 123(8), 4073–4087. https://doi.org/10.1002/2017JD027819
- Shukla, P. R., Skea, J. Slade, R. Diemen, R. van, Haughey, E. Malley, J. Pathak, M. Pereira, J. P. & (eds.). (2019). Technical Summary, 2019. In: Climate Change and Land: an IPCC special report on climate change, desertification, land degradation, sustainable land management, food security, and greenhouse gas fluxes in terrestrial ecosystems. In press.
- Silva, M., & Mendoza, N. (2020). Validation of meteorological series and estimation of climate change indicators in agricultural locations from Uruguay. Revista de Climatologia, 20, 47–60. https://www.researchgate.net/publication/343636404
- Sylla, M. B., Nikiema, P. M., Gibba, P., Kebe, I., & Klutse, N. A. B. (2016). Climate Change over West Africa: Recent Trends and Future Projections. In A. Y. Joseph & J. Hesselberg (Eds.), Adaptation to Climate Change and Variability in Rural West Africa (pp. 25–40). Cham: Springer. https://doi.org/10.1007/978-3-319-31499-0
- Taylor, C. M., Belušić, D., Guichard, F., Parker, D. J., Vischel, T., Bock, O., Harris, P. P., Janicot, S., Klein, C., & Panthou, G. (2017). Frequency of extreme Sahelian storms tripled since 1982 in satellite observations. Nature Publishing Group, 544(7651), 475–478. https://doi.org/10.1038/nature22069
- USAID. (2018). Climate risk profile : West Africahttps://www.climatelinks.org/sites/default/files/asset/document/West_Africa_CRP_Final.pdf (Issue December.
- van Oort, P. A. J. & Zwart, S. J. (2018). Impacts of climate change on rice production in Africa and causes of simulated yield changes. Global Change Biology, 24(3). https://doi.org/10.1111/gcb.13967
- WFP. (2021). Annual country report 2021.
- WMO. (2022). State of the Climate in Africa 2021. State of the Climate in Africa 2022. https://doi.org/10.18356/9789263113306
- Xu, Y., Knudby, A., Ho, H. C., Shen, Y., & Liu, Y. (2017). Warming over the Tibetan Plateau in the last 55 years based on area-weighted average temperature. Regional Environmental Change, 17(8), 2339–2347. https://doi.org/10.1007/s10113-017-1163-z
- Yin, H., & Sun, Y. (2018). Characteristics of extreme temperature and precipitation in China in 2017 based on ETCCDI indices. Advances in Climate Change Research, 9(4), 218–226. https://doi.org/10.1016/j.accre.2019.01.001
- Yoshida, S. (1981). Fundamentals of rice crop science. Fundamentals of rice crop science (The Inster).
- Zhou, D., Sun, S., Li, Y., Zhang, L., & Huang, L. (2023). A multi-perspective study of atmospheric urban heat island effect in China based on national meteorological observations: Facts and uncertainties. Science of the Total Environment, 854 (July 2022). https://doi.org/10.1016/j.scitotenv.2022.158638
- Zingore, S., Wairegi, L., & Ndiaye, K. (2014). Guide pour la gestion des systèmes de culture de riz (p. 66). Consortium Africain pour la Santé des Sols. https://africasoilhealth.cabi.org/wpcms/wp-content/uploads/2016/06/French-Rice-Guide-A5-colour-lowres.pdf