

ABSTRACT
Background & objectives: Islet of Langerhans, the endocrine pancreas plays a significant role in glucose metabolism. Obesity and insulin resistance are the major factors responsible for beta cell dysfunction. Asian Indian population has increased susceptibility to diabetes in spite of having lower BMI. The morphology of islets plays a significant role in beta cell function. The present study was designed for better understanding the morphology, composition and distribution of islets in different parts of the pancreas and its impact on beta cell proportion. Methods: We observed islet morphology and beta cell area proportion by Large-scale computer-assisted analysis in 20 adult human pancreases in non-diabetic Indian population. Immunohistochemical staining with anti-synaptophysin and anti-insulin antibody was used to detect islet and beta cells respectively. Whole slide images were analyzed using ImageJ software. Results: Endocrine proportion were heterogeneously increasing from head to tail with maximum islet and beta cell distribution in the tail region. Larger islets were predominately confined to the tail region. The islets in Indian population were relatively smaller in size, but they have more beta cells (20%) when compared to American population. Interpretation & conclusions: The beta cells of larger islets are functionally more active than the smaller islets via paracrine effect. Thus, reduction in the number of larger islets may be one of the probable reasons for increased susceptibility of Indians to diabetes even at lower BMI. Knowledge about the regional distribution of islets will help the surgeons to preserve the islet rich regions during surgery.
Introduction
Diabetes is a chronic multifactorial disease which not only puts a great burden on the individuals but also on society as well. Incidence of diabetes mellitus (DM) is rapidly increasing with 78.3 million diabetics in Southeast Asia as of 2015 and is estimated to rise up to 140.2 million by 2040.Citation1 Recent studies have documented that pathological changes in the pancreatic islets like hyaline degeneration,Citation2,Citation3 inflammation,Citation4,Citation5 beta cell lossCitation6,Citation7 and alpha cell expansionCitation8 were associated with the DM. Most of these studies which have analyzed the human pancreatic islet morphology are from Western and European countries.Citation9–Citation12 To the best of our knowledge, there is a paucity of studies on islet and beta cell mass in the South Asian population. Long-standing increase in BMI and insulin resistance are the major factors responsible for beta cell failure leading to diabetes. The South Asian population have increased susceptibility to T2DM in spite of lower BMI.Citation13–Citation15 A better understanding of islet and beta cells morphology and distribution in the pancreas of non-diabetic Indian population will give an insight into the pathophysiology of T2DM in these populations. The aim of the present study was to document the regional variation and microarchitecture of the islets including beta cell proportion in the pancreas of non-diabetic Indians which may explain the increased susceptibility of Indians to T2DM in spite of lower BMI.
Methodology
Pancreatic specimen collection
A total of thirty-three autopsy specimens of the adult human non-diabetic pancreas were collected from the Department of Forensic Medicine & Toxicology, after the approval of the Institutional Ethical Committee. In each case, a detailed history including age, sex, diabetic status, the cause of death, time since death and existence of other co-morbid conditions were documented. In most of the cases the cause of death was road traffic accident and none of the cases were associated with any chronic diseases.
The pancreas was separated from the duodenum and spleen. The surrounding adherent fatty tissues were removed by careful dissection. The dimension of the pancreas (length, breadth and thickness) was measured using the thread and digital Vernier caliper. The weight was measured by the digital weighing machine and the volume was measured by Archimedes’ principle.Citation16 The height (length) and weight of each individual were measured as per standard anthropometric procedures to calculate the BMI. The incision was made over the constricted neck region of the pancreas (in relation to portal vein) to divide head from the rest of the pancreas. Then the rest of the pancreas was divided into two equal parts (body and tail) as described in the previous studies.Citation17
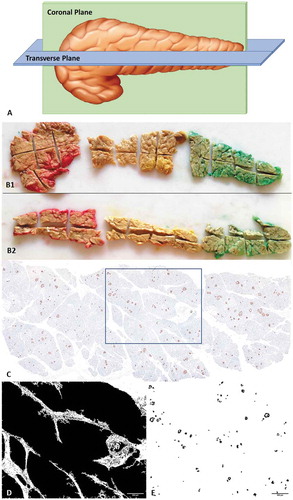
After overnight fixation in 10% neutral buffered formalin solution, the whole coronal section and horizontal section of the pancreatic head, body and tail were again subdivided into small sub-blocks (Approximately 40 sub-blocks were obtained from each pancreas) (). All the well-labeled sub-blocks were fixed in 10% neutral buffered formalin followed by automated tissue processing by Leica automated tissue processor. After preparing the paraffin blocks, 4μm thick sections were taken from each block and stained with hematoxylin and eosin (H&E) stain to look for autolytic changes.
Figure 1. (A) Animated picture showing the method of grossing in coronal and transverse plane. (B) Photograph of entire coronal (B1) and transverse (B2) tissue section of head, body and tail taken from single pancreas. Colors were used for identification. (C) A single representative whole slide image of IHC, stained by anti-synaptophysin antibody; (D) Measuring tissue area of the image; (E) DAB positive areas (Islets) separated by ImageJ for analysis of islet area and diameter.
Immunohistochemistry
After excluding the specimens showing autolytic or pathological changes, only 20 (out of 33) pancreatic specimens with well-preserved microarchitecture were used for Immunohistochemistry (IHC). IHC was done on two consecutive 4µm thick paraffin sections. Antigen Retrieval was done with citrate buffer by using heat antigen retrieval method under pressure. Serial sections of each block were stained using rabbit monoclonal anti-synaptophysin antibody (1:300) (PathnSitu, Livermore, California) for identifying islets and rabbit monoclonal anti-insulin (1:200) (PathnSitu, Livermore, California) (45 minutes incubation) for identifying beta cells. Primary antibody was detected by a secondary antibody labeled with Horseradish peroxidase (HRP) and DAB (3,3diaminobenzidine) chromogen (DAKO, Carpinteria, CA). Whole slide images (WSI) of all IHC slides were captured using the Carl Zeiss digital slide scanning system and MetaSystems software in 10× magnification which was found to be adequate for computer-assisted image analysis.Citation18 Each whole slide image was exported into TIFF format and then transported to the workstation.
Quantification
All WSIs were analyzed by using Fiji/ImageJ free software from NIH (Downloaded from http//imagej.nih.gov/). Based on the methods as described by Kim A et al. we have standardized the custom-written macro to run the WSI of IHC slides to calculate the whole tissue area, islet area with area percentage and the beta-cell area with area percentage.Citation19 DAB positive area outside the islet area (corner positive) was excluded. Individual islet clusters were numbered to obtain information regarding a particular islet (size, circularity, area, etc.,) from the tabulated result. Outline of image analysis has been given as , , & ).
Figure 2. Flow chart of immunohistochemistry image capture, processing and analysis.
To calculate the endocrine areas from the WSI, the following formulas were used:
1. Tissue area of the image = [Total area of the image × Total tissue area percentage]/100
2. DAB area of the image = [Total area of the image × slide DAB area percentage]/100
3. DAB area proportion = [DAB area of the image/Tissue area of the image] × 100
Analysis and statistics
The data were summarized and expressed as mean ± SEM. Paired ‘t’ test was used to compare the data of means of islet and beta cell area proportion in head, body and tail region of the pancreas. P value < .05 was taken as significant. Statistical analyzes were performed by using SPSS software version 25 and graphs were plotted using Microsoft Excel 2016 software.
Results
The detail of age, gender, BMI, and time since the death of all the 20 cases were given in . The mean age and BMI of the subjects were 39.05 ± 3.47 years and 21.14 ± 0.79 kg/m2 respectively.
Table 1. Information about the subjects.
Regional variation of islet and beta cell area in the whole pancreas
The mean islet area proportion in the head, body and tail was 1.06 ± 0.1%, 1.09 ± 0.14% and 1.47 ± 0.15% respectively. The islet area proportion in the tail was significantly higher than that of the head (P = .001) and body (P < .0001) () (). Similar to the islet area, the beta cell area proportion in the tail (0.93 ± 0.09%) was significantly higher than the head (0.65 ± 0.08%) and body (0.66 ± 0.07%). An increasing trend of the beta cell percentage was observed from head (61.64%) to tail (64.35%). However, it was not statistically significant ().
Table 2. Regional variation of islet and beta cell area proportion, islet diameter and beta cell percentage to total islet area.
Figure 3. (A) Regional variation of the islet and beta cell area proportion in 34 years old female pancreas of BMI 20.89 kg/cm2. The proportion of total islet and beta cell area were heterogeneously distributed from head to tail. (B) Inter-individual comparison of the topographical variation of endocrine proportion and its trends (n = 20).
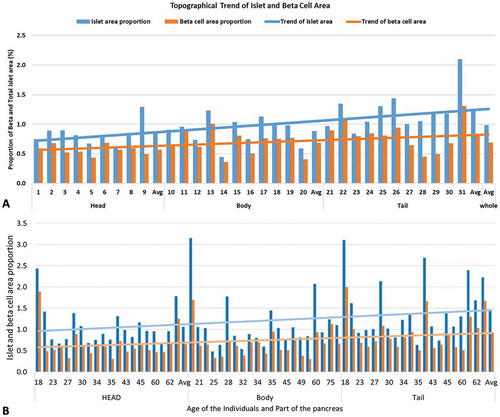
The mean total islet and beta cell area proportion of the whole pancreas was 1.21 ± 0.12% and 0.75 ± 0.08% respectively. The mean percentage of the beta cell to the total islet area measured in 20 cases was 61.98%.
Regional variation of islet morphology
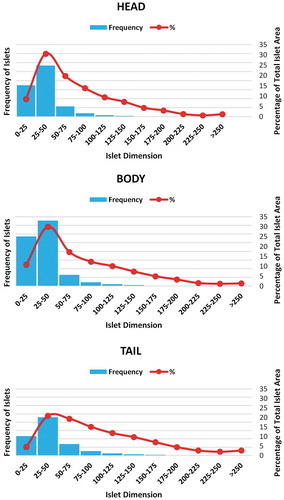
It was observed that the number and size of the islets were increasing from the head to the tail. The effective islet diameter was calculated from the average between the minimum and maximum diameter of each islet. Majority of the islets were within the range of 25–50 µm. The mean effective islet diameter in the head, body and tail were 35.80 ± 0.1µm, 35.21 ± 0.1 µm and 43.87 ± 0.14 µm respectively. The paired t-test showed that the islet diameter in the tail was significantly higher than that of head and body (P < .0001) (). The percentage of the larger islet (>50 µm) was relatively more in the tail region (). In the tail region, the contribution of larger islets to the total islet area was also increased when compared with that of the head and body () ().
Figure 4. Regional variation of islet distribution based on its diameter. Islets of diameter more than 50 μm were taken as larger islets.
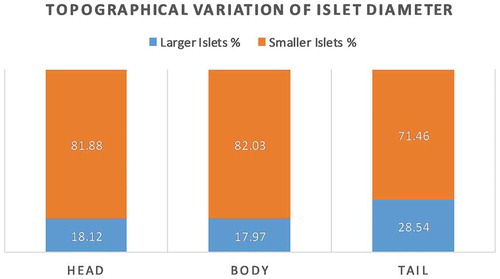
Figure 5. Regional variation of islet diameter and their contribution to the total islet area percentage. Frequency of islets in the various diameter range (blue color bars) and their contribution to the total islet area (red color line) in head, body and tail region of the pancreas. Note the area contribution by larger islets was relatively higher in the tail – shifting of the red line toward larger islets.
Relationship of islet and beta cell area proportion with BMI
The donors were categorized into three groups (Group I < 18.5 kg/m2, Group II18.5 to 23.0 kg/m2 and Group II>23.0 kg/m2) as per the WHO BMI recommendation for the Asian Indian population. The mean total islet and beta cell area proportion of different groups (Group I, II and III) were 1.22 ± 0.21%, 1.32 ± .021%, 0.96 ± 0.14% and 0.94 ± 0.23%, 1.02 ± 0.15%, 0.74 ± 0.09% respectively. The individuals within group II showed a slight increase in both islet and beta cell area proportion when compared with the other two groups however it was not statistically significant.
Discussion
The findings of the present study demonstrate the regional distribution and inter-individual variations of islet and beta cell area in the whole pancreas (). Previous studies have quantified the islet area by analyzing limited sections from different parts of the pancreas which may not represent the entire pancreas.Citation20–Citation22 Few studies also quantified the islet area based on examination of random microscopic fields or islet rich regions of the pancreas.Citation23 Several recent studies have revealed that such sampling bias and use of methods like manual point counter analysis may lead to overestimation of endocrine proportion up to 14 folds.Citation11,Citation23 Regional distribution of the islet and beta cell areas can’t be commented based on the analysis of selected regions from different parts of the pancreas. The studies involving microscopic analysis of a larger amount of pancreatic tissue from the whole human pancreas were limited and these were mainly on the American population.Citation11,Citation23,Citation24 In the present study, by including a whole representative of coronal and horizontal sections of each pancreas, we have analyzed larger areas (~15 cm2) of pancreatic tissue in each sample.
Few studies have used large-scale computer-assisted stereological analysis of complete pancreas by merging multiple channel immunofluorescence signals (anti-insulin, anti-glucagon, and anti-somatostatin) to determine the islet area.Citation11,Citation12,Citation23 However, the minor endocrine cells like pancreatic polypeptide or epsilon cells were ignored in this type of analysis. This leads to approximately 5 to 10% underestimation of the total endocrine proportion, further leading to overestimation of individual cell groups. The anti-synaptophysin antibody used in the present study specifically stains all the subgroups of the islet cells and was also strongly immunoreactive to alpha and pancreatic polypeptide cells reducing the chance of underestimation of islet area.Citation25 Furthermore, the errors due to manual counting were also minimized by using the custom-written macro in ImageJ software with a few default plugins as described in previous studies.Citation19 Software analysis provides a higher degree of reproducibility with minimal intra- and inter-observer errors.
In line with the findings of existing literature which analyzed the whole human pancreas, the present study also confirmed the regional variability in the endocrine tissue/islet areas with maximum endocrine proportion in the tail region of the pancreas.Citation11,Citation23,Citation24,Citation26 The non-diabetic American population with an average BMI of 23.9 ± 1.5 kg/m2 in male and 28.1 ± 2.1 kg/m2 in female had shown the mean islet area proportion in the head, body and tail was 1.22 ± 0.12%, 1.07 ± 0.12%, and 2.37 ± 0.25% respectively.Citation24 When compared with the American population, the Indian population (present study n = 20 non-diabetic) with comparable range of BMI and age had shown a decrease in the total endocrine area in the head and tail of the pancreas by 13.1%, and 37% respectively with no significant change in body region (). The endocrine proportion of the tail was 100% more (twice) than that of the head in the non-diabetic American population.Citation24 In the present study, we have observed that the endocrine proportion of tail was 40% more than the head (). This reduction of the islet in the tail region may be one of the reasons for the increased susceptibility of Indians to T2DM. To the best of our knowledge, most of the previous studies did not provide the regional variation of the endocrine cell area proportion in the non-diabetic pancreas.
We also pooled the data of three previous studies based on the total islet areas done in the American non-diabetic population. These studies have shown that the mean total islet area proportion of the pancreas was 1.09%, which was 11% less than the total endocrine proportion reported in our study ().Citation11,Citation23,Citation24 This contraindicating data may be due to the wide range of age group (ranging from 20 to 80 years) and BMI (Range: 16.4 to 47 kg/m2) of the donors included in these studies. Ethnic variations as reported in the literature further confound the comparison with the American population.Citation27
Beta cell area proportion is increased from head to tail as reported in earlier studies.Citation24 The mean beta cell area proportion in the American non-diabetic population (n = 15) was 0.6 ± 0.5%. However in the present study the mean beta cell area proportion was 0.75 ± 0.08%, which was 20% more than the American population.Citation11,Citation23 The beta cell percentage i.e. beta cell area versus total islet area in American non-diabetic population was 55%, which was ~7% lower than the present study (61.98%) ().Citation24 Even though Indians have 20% more beta cell area proportion and 7% more beta cell percentage than Americans, still Indians are more susceptible to diabetes. Thus, beta cell dysfunction might be a reason for the increased susceptibility of the Indians to DM.Citation27
Regional variation of islets size, architecture and insulin-secreting capacity in response to glucose are also linked with their source of development.Citation28–Citation30 Islets derived from the dorsal pancreatic bud (present in the body and tail regions) are larger in size and its insulin secretion in response to the glucose stimuli is significantly higher in comparison to islet-derived from ventral pancreatic bud.Citation24,Citation28–Citation30 Islet size plays a crucial role in the composition and arrangements of the various endocrine cells within it, which in turn regulate their activities via paracrine effect.Citation26 The smaller islets (diameter less than 50 µm) are rich in beta cells in comparison to larger islets which have more alpha cells with the intermingling of beta and non-beta cells.Citation26,Citation31 Disorganized or intermingled arrangement of alpha and beta cells in the larger islets allowed the beta cells to respond even to lower concentration of blood glucose to which smaller islets are usually blind.Citation18,Citation26,Citation32 Thus, the larger islets with a smaller proportion of beta cells are functionally more active via a paracrine effect in comparison to smaller islets. The larger islets were frequently reported in conditions of increased insulin demand like insulin resistance, obesity, pregnancy and diabetes.Citation18,Citation31
The larger islets made a greater contribution (>50%) to the total endocrine area.Citation18,Citation22,Citation23 However, their number was relatively less in comparison to smaller islets. The frequency of smaller islets was variable from 9–50% of the total islets.Citation22,Citation23 In the present study, the islets with the size of 25–50 µm were predominant (). In the American population (n = 23), the percentage of the larger islets (>50 µm) in head, body and tail was 34.0 ± 22%, 32.4 ± 1.3%, and 41.9 ± 1.3% respectively.Citation24 In comparison to the American population, the present study showed a 45% reduction of larger islet proportion in the head and body region with a 31.9% reduction in the tail region (). The islets measured in the present study were comparatively smaller in size, which influences its cellular composition. The increased beta-cell proportion in smaller islet may not be beneficial, as the response of smaller islet to lower glucose concentration is relatively lower than that of larger islets (paracrine effect).Citation26 Studies suggesting the lower functional activity of beta cells in the Asian population when compared with other races also supports our findings.Citation27 Kilimnik et al. reported the preferential loss of larger islets in T2DM pancreas when compared to non-diabetic pancreas.Citation31 Thus, reduction in larger islet proportion might be one of the factors responsible for the increased susceptibility of the Indians to T2DM even though the beta cell percentage were higher than the American population.
A wide range of association of beta cell mass with BMI has been reported in the literature. In most of the studies (done in the American and European population), the beta cells proportion was increased with an increase in BMI.Citation4,Citation21,Citation33 But this relationship was not seen in the Japanese population.Citation34 Probably, rise in the BMI results in increased insulin demand which might be a stimulus for an increase in beta cell mass.Citation4,Citation35 Source of the new beta cells is largely unknown; several authors have hypothesized that it may be compensatory hyperplasia, transdifferentiation, etc. In the present study, with a mean BMI of 21.7 ± 4.05 kg/mCitation2 (Range – 16.3 to 30.3 Kg/m2), no statistically significant variation was seen in islet and beta cell area proportion with BMI. Yagihashi S et.al, have hypothesized that beta cell mass might increase only when there is a strong stimulus with BMI > 30 kg/mCitation2,Citation4 This justifies the lower beta cell mass in the Japanese population as their mean BMI is usually < 25 kg/m.2 In the present study, the mean BMI of 21.7 ± 4.05 kg/m2 was probably not sufficient enough to stimulate the beta cell to increase their number.
Increased BMI not only increases the beta cell mass but also insulin secretion.Citation4,Citation35 It is a compensatory phenomenon to meet the acute insulin demand, but in the long run, it results in beta cell failure, apoptosis and leads to T2DM. Thus, a decrease in BMI results in a decrease in the workload on the beta cell which in turn prevent the insulin resistance and beta-cell failure.Citation35
In conclusion, the present study measures the islet morphology and distribution in the whole human pancreas of non-diabetic Indian population with special reference to beta cells. The islets in the tail region were more numerous and comparatively larger in diameter. The intermingling of alpha and beta cells in the larger islets helps the beta cells to respond better even to lower concentration of the blood glucose.Citation18,Citation26,Citation32 Though the proportion of beta cells is more in smaller islets, their function is comparatively less than the larger islets due to lack of paracrine effect. As described by Kilimik et al., reduction in the number of larger islets may be one of the reasons that makes the Indians more susceptible to T2DM even at lower BMI.Citation31 Further studies on the cellular composition of smaller and larger islets in normal controls and diabetes population are needed for validation of the findings of this study. A better understanding of the regional variation in islets will help us to improve the islet harvesting for donation and preservation of islet rich part during surgeries related to the pancreas.
Conflicts of interest
The authors declare that there are no conflicts of interest to disclose.
Additional information
Funding
References
- Nanditha A, Ma RCW, Ramachandran A, Snehalatha C, Chan JCN, Chia KS, Shaw JE, Zimmet PZ. Diabetes in asia and the pacific: implications for the global epidemic. Diabetes Care. 2016;39:472–485. doi:10.2337/dc15-1536.
- Westermark P, Wernstedtt C, Wilander E, Hayden DW, O’brient TD, Johnsont KH. Amyloid fibrils in human insulinoma and islets of langerhans of the diabetic cat are derived from a neuropeptide-like protein also present in normal islet cells. Proc Nati Acad Sci USA. 1987;84:3881–3885. doi:10.1073/pnas.84.11.3881.
- Kamata K, Mizukami H, Inaba W, Tsuboi K, Tateishi Y, Yoshida T, Yagihashi S. Islet amyloid with macrophage migration correlates with augmented β-cell deficits in type 2 diabetic patients. Amyloid. 2014;21:191–201. doi:10.3109/13506129.2014.937857.
- Yagihashi S, Inaba W, Mizukami H. Dynamic pathology of islet endocrine cells in type 2 diabetes: β-cell growth, death, regeneration and their clinical implications. J Diabetes Investig. 2016;7:155–165. doi:10.1111/jdi.2016.7.issue-2.
- Ehses JA, Perren A, Eppler E, Ribaux P, Pospisilik JA, Maor-Cahn R, Gueripel X, Ellingsgaard H, Schneider MKJ, Biollaz G, et al. Increased number of islet-associated macrophages in type 2 diabetes. Diabetes. 2007;56:2356–2370. doi:10.2337/db06-1650.
- Saito K, Nobuhisa Y, Tohbu T. Differential volumetry of A, B and D cell in the pancreatic islets of diabetic and nondiabetic subjects. Tohoku J Exp Med. 1979;129:273–283. doi:10.1620/tjem.129.273.
- Gepts W. Pathologic anatomy of the islet cell system in juvenile diabetes mellitus. Diabetes. 1965;14:619–633. doi:10.2337/diab.14.10.619.
- Yoon KH, Ko SH, Cho JH, Lee JM, Ahn YB, Song KH, Yoo SJ, Kang M Il, Cha BY, Lee KW, et al. Selective β-cell loss and α-cell expansion in patients with type 2 diabetes mellitus in Korea. J Clin Endocrinol Metab. 2003;88:2300–2308. doi:10.1210/jc.2002-020735.
- Rahier J, Goebbels RM, Sempoux C, Henquin JC. Pancreatic b-cell mass in European subjects with type 2 diabetes. Diabetes Obes Metab. 2008;10:32–42. doi:10.1111/j.1463-1326.2008.00969.x.
- Henquin JC, Rahier J. Pancreatic alpha cell mass in European subjects with type 2 diabetes. Diabetologia. 2011;54:1720–1725. doi:10.1007/s00125-011-2118-4.
- Poudel A, Fowler JL, Zielinski MC, Kilimnik G, Hara M. Stereological analyses of the whole human pancreas. Sci Rep. 2016;6:1–13. doi:10.1038/srep34049.
- Wang X, Zielinski MC, Misawa R, Wen P, Wang TY, Wang CZ, Witkowski P, Hara M. Quantitative analysis of pancreatic polypeptide cell distribution in the human pancreas. PLoS One. 2013;8:1–7.
- Sagar S, Rajendran K. Genetic markers in type ii diabetes mellitus among indian population-a review. Int J Curr Adv Res. 2017;6:3229–3232. doi:10.24327/IJCAR.
- Unnikrishnan R, Anjana RM, Mohan V. Diabetes in South Asians: is the phenotype different? Diabetes. 2014;63:53–55. doi:10.2337/db13-1592.
- Unnikrishnan R, Anjana RM, Mohan V. Diabetes mellitus and its complications in India. Nat Rev Endocrinol. 2016;12:357–370. doi:10.1038/nrendo.2016.53.
- Sakuraba H, Mizukami H, Yagihashi N, Wada R, Hanyu C, Yagihashi S. Reduced beta-cell mass and expression of oxidative stress-related DNA damage in the islet of Japanese type II diabetic patients. Diabetologia. 2002;45:85–96. doi:10.1007/s125-002-8248-z.
- Campbell-Thompson ML, Montgomery EL, Foss RM, Kolheffer KM, Phipps G, Schneider L, Atkinson MA. Collection protocol for human pancreas. J Vis Exp. 2012;63:1–5.
- Kilimnik G, Jo J, Periwal V, Zielinski MC, Hara M. Quantification of islet size and architecture. Islets. 2012;4:167–172. doi:10.4161/isl.19256.
- Kim A, Kilimnik G, Guo C, Sung J, Jo J, Periwal V, Witkowski P, Dilorio P, Hara M. Computer-assisted large-scale visualization and quantification of pancreatic islet mass, size distribution and architecture. J Vis Exp. 2011;49:1–7.
- Jones LC, Clark A. β-cell neogenesis in type 2 diabetes. Diabetes. 2001;50:14–15. doi:10.2337/diabetes.50.2007.S186.
- Saisho Y, Butler AE, Manesso E, Elashoff D, Rizza RA, Butler PC. β-cell mass and turnover in humans: effects of obesity and aging. Diabetes Care. 2013;36:111–117. doi:10.2337/dc12-0421.
- Ionescu-Tirgoviste C, Gagniuc PA, Gubceac E, Mardare L, Popescu I, Dima S, Militaru M. A 3D map of the islet routes throughout the healthy human pancreas. Sci Rep. 2015;5:1–14. doi:10.1038/srep14634.
- Olehnik SK, Fowler JL, Avramovich G, Hara M. Quantitative analysis of intra-and inter-individual variability of human beta-cell mass. Sci Rep. 2017;7:1–7. doi:10.1038/s41598-017-16300-w.
- Wang X, Misawa R, Zielinski MC, Cowen P, Jo J, Periwal V, Ricordi C, Khan A, Szust J, Shen J, et al. Regional differences in islet distribution in the human pancreas - preferential beta-cell loss in the head region in patients with type 2 diabetes. PLoS One. 2013;8:1–9.
- Redecker P, Jörns A, Jahn R, Grube D. Synaptophysin immunoreactivity in the mammalian endocrine pancreas. Cell Tissue Res. 1991;264:461–467. doi:10.1007/BF00319036.
- Kim A, Miller K, Jo J, Kilimnik G, Wojcik P, Hara M. Islet architecture: a comparative study. Islets. 2009;1:129–136. doi:10.4161/isl.1.2.9480.
- Inaishi J, Saisho Y. Ethnic similarities and differences in the relationship between beta cell mass and diabetes. J Clin Med. 2017;6:113. doi:10.3390/jcm6120113.
- Trimble ER, Halban PA, Wollheim CB, Renold AE. Functional differences between rat islets of ventral and dorsal pancreatic origin. J Clin Invest. 1982;69:405–413. doi:10.1172/JCI110464.
- Trimble ER, Renold AE. Ventral and dorsal areas of rat pancreas: islet hormone content and secretion. Am J Physiol Metab. 2017;240:E422–427.
- Leclercq-Meyer V, Marchand J, Malaisse WJ. Insulin and glucagon release from the ventral and dorsal parts of the perfused pancreas of the rat. Horm Res Paediatr. 1985;21:19–32. doi:10.1159/000180021.
- Kilimnik G, Zhao B, Jo J, Periwal V, Witkowski P, Misawa R, Hara M. Altered islet composition and disproportionate loss of large islets in patients with type 2 diabetes. PLoS One. 2011;6:e27445. doi:10.1371/journal.pone.0027445.
- Unger RH, Orci L. Paracrinology of islets and the paracrinopathy of diabetes. Proc Natl Acad Sci. 2010;107:16009–16012. doi:10.1073/pnas.1006639107.
- Leahy JL, Hirsch IB, Peterson KA, Schneider D. Targeting β-cell function early in the course of therapy for type 2 diabetes mellitus. J Clin Endocrinol Metab. 2010;95:4206–4216. doi:10.1210/jc.2010-0668.
- Inaishi J, Saisho Y, Sato S, Kou K, Murakami R, Watanabe Y, Kitago M, Kitagawa Y, Yamada T, Itoh H. Effects of obesity and diabetes on α-and β-cell mass in surgically resected human pancreas. J Clin Endocrinol Metab. 2016;101:2863–2873. doi:10.1210/jc.2016-1374.
- Saisho Y. Obesity, type 2 diabetes and beta cell failure: an Asian perspective. J Mol Genet Med. 2014;s1. doi:10.4172/1747-0862.S1-008.

