
 ?Mathematical formulae have been encoded as MathML and are displayed in this HTML version using MathJax in order to improve their display. Uncheck the box to turn MathJax off. This feature requires Javascript. Click on a formula to zoom.
ABSTRACT
This paper investigates the time-dependent behaviour of structured clays in triaxial stress space both theoretically and experimentally. A range of existing theoretical frameworks and phenomenological equations are reviewed and discussed in their ability to interpret the creep behaviour at different states in stress space. New experimental results are presented for two structured clays subjected to complex loading conditions. Each test consists of a defined stress path with intermediate stages of creep. Considerable creep deformations were observed at all anisotropic effective stress conditions. Measured viscous deformations were observed to be related to the stress state, approaching stress path and degree of structure present in the soil. The incremental strain ratio,
, measured during constant stress was found to rotate counter-clockwise as a result of drained shearing towards failure for all tests. The experiments also show that for very small stress increments, phenomenological and empirical relations incorrectly predict the development of creep strains with time.
1 Introduction
The topic of the soil stress-strain-time response has been investigated for several decades (Bjerrum and Lo Citation1963; Bjerrum Citation1967; Vaid and Campanella Citation1977; Tavenas et al. Citation1978; Zhu and Yin Citation2001). These investigations, usually laboratory studies, were prompted by field observations of long-term ground movements associated with earthworks, especially embankment construction (e.g. Tavenas and Leroueil Citation1980; Lefebvre et al. Citation1994). The viscous behaviour of natural soils during the loading stage, which is named as ‘creep’, is known to be related to soil fabric or structure present in the intact material (e.g. Mesri and Castro Citation1987; Soga and Mitchell Citation1996). The stability of the soil fabric is sensitive to changes in applied forces and in the environment. Both soil fabric and its stability control the mechanical behaviour of natural soils. Past laboratory studies have shown that natural structured clays exhibit significant time-dependent deformation behaviour as a result of softening or destruction of the soil structure (e.g. Tavenas et al. Citation1978, Citation1979; Graham, Noonan, and Lew Citation1983b; Tatsuoka et al. Citation2002; Sorensen, Baudet, and Simpson Citation2007). Experimental data on the creep behaviour of structured clays have, with some exceptions (Tavenas et al. Citation1978; Tian et al. Citation1994; Zhu and Yin Citation2001), been limited to one-dimensional tests. Limited data are therefore available on the creep behaviour of structured clays in a more general stress space. Application of phenomenological equations and constitutive models derived from one-dimensional conditions to experimental data obtained from triaxial tests have been inadequate at describing the evolution of both volumetric and deviatoric strains with time (e.g Tian et al. Citation1994; Silva and Brandes Citation1996). The term ‘soil structure’ as used in this study broadly relates to the arrangement and bonding of soil constituents that cause its mechanical behaviour to be different from that of the corresponding reconstituted soil. The degree of structuration present in an intact sample is defined as the difference in void ratio between the structured soil and its corresponding reconstituted soil at an equivalent mean or vertical effective stress (e.g. Liu and Carter Citation2000).
The purpose of this paper is two-fold: first, a summary of existing phenomenological and constitutive frameworks relevant to the understanding of time-dependent creep behaviour of structured clays in triaxial stress space is presented; second, results from a number of creep tests at different effective stress conditions are given along with some interpretation of the observed behaviour. The experimental programme presented investigates the coupled effects of consolidation during drained shearing and creep at constant effective stress. The tests aim to investigate the effects of structure on the viscous deformation at different stress states. Advances in computer control now allow for the stress path to be defined in general triaxial stress space and to include constant stress periods. Measured viscous deformations are therefore analysed in terms of (i) stress state and (ii) time. Due to the wide range of historic tests performed to investigate the time-dependent behaviour of soils, this experimental investigation aims to relate data reported in the literature obtained from incrementally loaded oedometer and triaxial tests with new results obtained under slow drained compression with intermediate stages of constant stress. Particular attention is paid to comparing the behaviour of the two clays at different stress states in order to highlight the influence of structure on measured creep strain. A method for interpreting the time-dependent behaviour of soils at constant stress is then proposed to resolve differences in creep strain development when applying small (slow shearing) versus large (incrementally loaded) stress changes.
2 Approaches to the prediction of time-dependent behaviour
A number of phenomenological equations (e.g. Singh and Mitchell Citation1968; Tian et al. Citation1994; Zhu and Yin Citation2001) and constitutive models (e.g. Adachi, Oka, and Mimura Citation1987; Yin and Graham Citation1994; Hashiguchi and Okayasu Citation2000; Leoni, Karstunen, and Vermeer Citation2008; Qu, Hinchberger, and Lo Citation2010) have been proposed to estimate creep and time-dependent deformations and comprehensive summaries of their ability to predict the behaviour of cohesive and granular soils are available (Adachi, Oka, and Mimura Citation1996; Augustesen, Liingaard, and Lade Citation2004; Liingaard, Augustesen, and Lade Citation2004). A brief review of the essential aspects of time-dependent soil behaviour will be presented so that limitations of existing approaches for structured soils and states in general stress space can be clearly appreciated.
Historically, creep or secondary consolidation was observed from logarithmic time plots that showed a structural viscous ‘plastic time lag’ component (Taylor and Merchant Citation1940; Terzaghi Citation1941; Taylor Citation1942) to the primary consolidation curve predicted by Terzaghi theory. The classical interpretation was that structural viscosity can be described by a function of the form
where is the rate of secondary compression,
is the ‘coefficient of secondary compression’ and
is the proportion of undeveloped secondary compression, equivalent to a limiting creep strain value (see Taylor Citation1942). For simple one-dimensional problems, this was simplified to the widely used constant logarithmic creep function, given by
where is the total axial strain,
is the axial strain at end of primary consolidation,
is the secondary compression index,
the time to reach end of primary consolidation, and
is the time since loading. A typical plot of change in void ratio versus time plot defining the terms mentioned in the previous section is presented in .
Figure 1. Curve of void ratio versus log (time) and definition ‘secondary: compression coefficient (adapted from Yin and Feng, Citation2016).
The application of any time-dependent model, through either EquationEquation 1(1)
(1) or EquationEquation 2
(2)
(2) , to simulate large-scale problems has, however, been complicated due to the reported variation of
with both applied stress and time (e.g. Mesri and Godlewski Citation1977; Mesri and Castro Citation1987). In order to explain the observed variation in
with time, Mesri and Godlewski (Citation1977) introduced an inter-relationship between secondary compression and a normal compression index throughout the consolidation stage. They suggested that for any soil,
, where
is the instantaneous compressibility index for a soil, is a constant both in the recompression and compression ranges, which implies that a semi-logarithmic strain-time relationship only applies if soil compressibility is constant.
For more general stress states in space, an alternative micromechanical approach has been used with some success to explain the phenomenological aspects of soil creep (e.g. Wu, Resendiz, and Neukirchner Citation1966; Mitchell, Campanella, and Singh Citation1968; Kuhn and Mitchell Citation1993). This approach adopts a relationship between axial strain rate,
, with deviator stress,
, and time; the creep equation typically takes the form
where A is a parametric constant, is a stress-dependent creep function,
is a reference time and
is the absolute value of slope of the straight line on the log-strain-rate versus log-time plot. The micromechanical equation is similar in nature to EquationEquation 1
(1)
(1) originally suggested by Taylor and Merchant (Citation1940), and equivalent to EquationEquation 2
(2)
(2) if
.
In both approaches, an arbitrary definition of the origin of time, , is required. A further difficulty arises in problems that involve applied loads that vary with time. In such cases, both the origin of time and the viscous component of the total strain are not readily defined. For both these phenomenological relationships, the degree or type of structure is not incorporated into the equations.
Rheological models of the forms
have been formulated to overcome the difficulty of needing an origin of time by having the behaviour depend only on the present condition and independent of previous history. Models in the form of are equivalent to the isotache framework first suggested by Šuklje (Citation1957) in which the rate of volumetric strain is a function of void ratio and vertical effective stress. Models of this description are however limited in their generality due to only being defined under one-dimensional conditions.
For practical applications, such as the design of structures on clay foundations, it is important to understand the time-dependent nature of soils subject to general states of stress, not simply one dimensional. Many studies investigating this problem (e.g. Crooks and Graham Citation1976; Graham, Crooks, and Bell Citation1983a; Graham, Crooks, and Lau Citation1988; Soga and Mitchell Citation1996) have indicated that a time-dependent yield surface can capture much of the behaviour, suggesting the framework proposed by Bjerrum (Citation1967) can be applied to general states of stress. These observations have led to many formulations of elastic-viscoplastic models including a number of constitutive models using overstress theory (e.g. Kutter and Sathialingam Citation1992; Yin and Graham Citation1999; Kelln et al. Citation2008). A limitation of all overstress type formulations is that they require an explicit definition of a time parameter to account for the beginning of creep time, . The value of
is needed to fix the normal consolidation line in models in
space as well as define the ‘equivalent timelines’ defined by Yin and Graham (Citation1994). These models also have difficulty in reproducing viscous volumetric and shear strain components in more general stress space as highlighted by Bodas Freitas, Potts, and Zdravković (Citation2012). In extending the one-dimensional time-dependent behaviour into triaxial stress space, many of the existing overstress models have incorrectly assumed a constant magnitude of the volumetric strain component around the entire yield surface: a behaviour not supported by experimental data. This is particularly an issue for soils with either a high degree of structure/bonding, or that are heavily over-consolidated, for which very small strains are expected before yield. It is however noted that overstress type constitutive models are just one class of time-dependent constitutive model. A number of alternative models have been proposed to capture the time-dependent behaviour of soils (see Liingaard, Augustesen, and Lade Citation2004). Of particular note are models which include a bounding surface (e.g. Kaliakin and Dafalias Citation1990a, Citation1990b) or sub-loading surface (e.g. Hashiguchi and Okayasu Citation2000) as they allow plastic strains to develop inside the gross yield surface and are able to simulate a quick response in plastic strain component to an abrupt change of stress path (Soga and O’sullivan Citation2010).
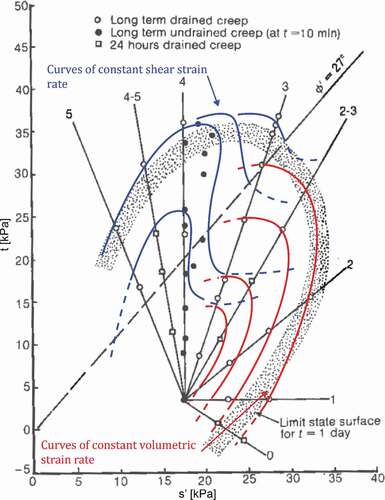
One of the first experimental investigations into the time-dependent behaviour of clays in triaxial stress space was completed by Tavenas et al. (Citation1978). The researchers were able to investigate the evolution of viscous strain components along specific stress paths in stress space by performing incrementally loaded drained triaxial tests. Each increment of stress application,
(referred to as the incremental stress ratio in this research), was selected to be less than 0 3. Loads were maintained constant for approximately 2 weeks to observe drained creep behaviour. The relatively low value of incremental stress ratio was expected to minimize the influence of primary consolidation on the measured soil response. A schematic diagram of the definitions of incremental stress and strain ratios used to interpret results presented by Tavenas et al. (Citation1978) is given in . Results from these small-step-loading creep tests indicated that there are regions of equal viscous strain components for both volumetric and shear strain, which are similar in shape but of different scale to the yield surface, as shown . While Tavenas et al. (Citation1978) were able to demonstrate a relationship between the stress state and yield locus to the measured viscous strain component, the authors were not able to comment on the evolution of viscous behaviour at or beyond yielding.
Figure 2. Schematic diagram of incremental stress and strain ratios.
Figure 3. Stress conditions applied in creep test on a lightly overconsolidated clay (Le et al., Citation2019, modified from Tavenas et al. Citation1978).
Drained creep tests by both Soga and Mitchell (Citation1996) and Zhu and Yin (Citation2001) on undisturbed samples of clay from Pancone and Hong Kong, respectively, relate to the time-dependent stress strain behaviour of the clays in stress space in three aspects: (i) effect of plasticity, (2) effect of stress magnitude, and (3) effect of stress ratio (
). Tests performed by Soga and Mitchell (Citation1996) were however incrementally loaded, and as such possess similar limitations as the work by Tavenas et al. (Citation1978) as discussed previously. Soga and Mitchell (Citation1996) were however able to also demonstrate that (i) the creep rate was dependent on the stress ratio (
), but independent of the absolute stress magnitude for a given stress ratio, (ii) the soil became more time-dependent as the distance between the compression curves of the intact and reconstituted specimens increased, and (iii) structured natural soils exhibited larger time-dependency compared to reconstituted specimens. Zhu and Yin (Citation2001) improved upon the procedure of achieving the target stress state by applying small stress increments. Zhu and Yin (Citation2001) suggested an alternative hyperbolic equation to describe the development of time-dependent deviatoric and volumetric strains at effective stress ratios between
and
, where
is the failure ratio in
stress space. Results presented by Zhu and Yin (Citation2001) indicated an increase of both the initial and limiting strain components with increasing stress ratio,
. The evolution of plastic strain increments at different stress ratios however, was not discussed.
As has been demonstrated, significant research involving the time-dependent nature of clays has involved natural, often structured, soils (e.g. Berre and Iversen Citation1972; Tavenas et al. Citation1978; Leroueil et al. Citation1985; Mesri and Choi Citation1985; Tian et al. Citation1994; Soga and Mitchell Citation1996; Zhu et al. Citation1999; Zhu and Yin Citation2001). There have, however, been few studies which have explicitly considered the role of structure to the overall time-dependent creep behaviour. It is currently unclear from the literature how soil structure, particularly of different nature and causes (e.g. lightly overconsolidated, sensitive, highly overconsolidated) affects the viscous deformation of soils subjected to creep stages (constant stress). A renewed interest in understanding the influence of structure on viscous behaviour has emerged as increasingly advanced constitutive models are being formulated which account for both time-dependent behaviour and structure (Yin et al. Citation2011; Sivasithamparam, Karstunen, and Bonnier Citation2015; Kavvadas and Kalos Citation2019; Mánica et al. Citation2021). A detailed investigation related to the evolution of the time-dependent creep strain component in stress space is therefore warranted. Of particular importance is understanding how the volumetric and shear strain components vary depending on degree of structure present – equivalent to the distance between the intact and reconstituted compression curve – and relevance of type of structure. A study of two differently structured soils was therefore undertaken to provide insight into this uncertainty.
3 Experimental programme
This paper presents the results of seven multi-staged drained compression triaxial tests with prolonged periods of constant stress on two structured clays using closed-loop computer-controlled systems. Drained compression tests on artificially cemented gypsum-kaolin (GK), representative of a natural soft clay (Le and Airey Citation2021), were performed under constant cell pressure while tests on undisturbed London Clay (LC) were performed at defined stress gradients.
To prepare the GK specimens, dry mixture of 30% hemihydrate (HH) and 70% kaolin was first prepared with water content 60% of the dry soil mass. The slurry was thoroughly mixed until a homogenous paste was obtained. The material was transferred to a mould and allowed to cure until firm enough to handle (approximately 30–40 minutes). The samples were then extruded and ends trimmed to the dimension of the final test sample. Results presented by Le and Airey (Citation2021) indicate that the samples prepared following the procedure described above yield a weakly bonded (structured) material with a vertical yield stress of approximately 100 kPa, similar to many natural soft clays. The one-dimensional compression curves of bonded and reconstituted samples of gypsum-kaolin are shown in . At low stress levels (<120 kPa), the void ratio of the structured soil was found to be greater than for a reconstituted sample at an equivalent effective stress. The difference in void ratio, , has been conceptually associated with the degree of structure present in the intact specimen (e.g. Leroueil and Vaughan Citation1990). Further discussion on the behaviour of gypsum cemented kaolin clay can be found in Le and Airey (Citation2021). Variability in initial void ratio is believed to be a consequence of the random nature of the bonding that develops on hydration of the hemihydrate.
Figure 4. One-dimensional compression curves of structured and unstructured gypsum–kaolin specimens (Le and Airey Citation2021).
Samples of London Clay were taken from Hyde Park, London, and were selected from similar depths, 26.40–28.50 m of the Division B2 of the London Clay Formation (Standing Citation2020). The soil structure of undisturbed London Clay has been discussed in detail by Gasparre et al. (Citation2007) and (Sorensen, Baudet, and Simpson Citation2007) and will therefore only be briefly mentioned here. London Clay is a highly overconsolidated, stiff clay with a post-sedimentation structure. Undisturbed specimens of London Clay from unit B2 present a relatively homogeneous mesofabric (i.e. visible without magnification) features with occasional silt or sand partings and fissures (Gasparre et al. Citation2007). Fissures in the undisturbed specimens tended to be discontinuous and extend up to 15 cm, with orientations that were typically between from the horizontal (Gasparre et al. Citation2007). Oedometer test data for undisturbed and reconstituted samples of London Clay collected from Hyde Park and Heathrow Terminal 5 are plotted in . Consistency was generally observed between the slopes of the one-dimensional compression curves of the undisturbed samples from the different sites. The onset of gross yield is gradual in the semi-log plot, however the gradient of the compression curve at high stress does tend towards the slope traced by reconstituted specimen. Similar to results presented by Gasparre et al. (Citation2007), the compression paths of the undisturbed and reconstituted specimens do not converge even at high stresses. Gasparre et al. (Citation2007) suggest that the lack of convergence between the undisturbed and reconstituted specimens of London Clay is believed to be a result of the micro-structural interparticle arrangements, or fabric, rather than bonding. summarizes the index properties of the cemented gypsum-kaolin samples and London Clay from Hyde Park.
Table 1. Material properties.
Figure 5. One-dimensional compression curves of undisturbed and reconstituted specimens of London Clay.
Triaxial drained creep tests were carried out in a stress-controlled triaxial testing system with bespoke computer control software to maintain defined stress conditions. Test specimens were 50 and 70 mm diameter for gypsum-kaolin and London Clay, respectively, and had a 2:1 height to diameter ratio. Axial load was applied by a mechanical frame, which was equipped with a load cell accurate to at least ±1 N. Mechanical screw pumps were used to control both the cell and pore water pressure; all controllers were able to resolve to a minimum of 0.001 cm3 and a pressure of 1 kPa. Temperature was maintained constant at C. The level of saturation was determined by performing a B-value check. Both GK and LC specimens had B-values higher than 95%. All tests have been corrected for area and membrane enhancement following Lade (Citation2016).
Following saturation, samples GK1 and GK3 were consolidated to an initial isotropic pressure of 40 kPa prior to drained compression while GK4 was anisotropically consolidated along a stress path. Samples of London Clay were isotropically consolidated back to the approximate in situ mean effective stress of 400 kPa. Special attention was paid on the procedure used to achieve the designed stress state. As has been noted above, a single rapid loading stage with dissipation would be inappropriate due the varied effective stress conditions and development of significant excess pore water pressure inside the specimen. Computer-controlled stress ramps and slow strain rates were therefore used to apply very small increments of volumetric (
) and deviatoric stress (
) change in order to minimize the pore water pressure build up. Time to 100% degree of consolidation for an isotropically loaded triaxial specimen was found to be 200 minutes for gypsum kaolin specimens. Time to failure for a drained test with double-ended drainage is therefore at least 1700 minutes as recommended by Head (Citation2010). Specimens of gypsum kaolin were sheared at an axial strain rate of 0.05%/hr to ensure drained condition. A stress increment rate,
of 1 kPa/hr was used along each of the defined stress paths in between stages of constant stress (creeping stages). Stress rates of 1 kPa/hr have been shown to result in minimal excess pore pressure development in London Clay (see Gasparre Citation2005). Measured axial strain rates were generally between 0.0022 and 0.0104%/hr during drained shearing for London Clay. Tests were terminated when the samples formed a shear band.
Continuous measurements were made during each test stage of changes in sample height, and volume change, and the cell and back pressures. The London Clay triaxial tests also included measurements of local axial and radial strains and temperature. Volumetric and shear strains for samples of London Clay were therefore calculated using the first, , and second,
, strain invariant definitions, where
is the volumetric strain,
is the natural axial strain,
is the natural radial strain, and
is the shear strain. Volumetric and shear strains for gypsum-kaolin samples were calculated assuming right cylinder deformations and are given by
and
, respectively, in which
is the change in volume as measured by the volume gauge and
is the current volume of the sample.
To account for small external changes in temperature in the laboratories, even though they were temperature controlled, strain components were compared over 24-hour periods when temperatures returned to a common value to avoid diurnal temperature effects. At pre-determined stages along each stress path, periods of constant stress were held.
4 Experimental viscous deformation in triaxial stress space
4.1 Development of time-dependent creep strain
For this study, viscous (time-dependent) behaviour is only considered for positive deviator stresses. No distinction is made between secondary and creep deformation for the reasons outlined earlier. The current study investigates the time-dependent behaviour of the structured soils for the stress space region between stress paths representing constant drained compression and constant
drained compression.
show the effective stress paths for GK and LC specimens, respectively; the figures also mark the creep stages at constant effective stress. At each creep stage, the stresses were held constant for a minimum of 1000 minutes. summarizes the applied stress path and creep stress states for each of the tests. show the associated stress-strain curves, and the total accumulated volumetric strain and shear strain
invariants developed with time for GK and LC specimens. plots the stress-strain curves of each specimen of LC separately for clarity. The start points of each creep and shear (effectively end of creep) stage are indicated in ) and 10. show the overall
relationship with shearing for GK and LC specimens, respectively.
Table 2. Test summary.
Figure 6. Effective stress paths for tests on gypsum-kaolin (GK) specimens.
Figure 7. Effective stress paths for tests on London Clay (LC) specimens.
Figure 8. Development of strain for gypsum-kaolin (GK) specimens (a) stress-strain behaviour. (b) time of strain development.
Figure 9. Large stress-strain behaviour of intact London Clay (LC) with intermediate stages of constant stress.
Figure 10. Development of volumetric and shear strain with time for samples of London Clay with time.
Figure 11. Development of strain increment for gypsum kaolin (GK) specimens.
Figure 12. Development of strain increments for LC specimens.
As the individual specimens for either GK or LC were similar in terms of physical characteristics and degree of structuration, differences in the overall mechanical response are attributed here to the applied effective stress gradient (, stress state during period of constant stress and soil structure. Generally, the drained shearing behaviour of both the GK and LC specimens is typical of structured soils. That is, from an isotropic stress state well within the yield surface until nearing a yield stress, both the accumulated volumetric and shear strains were proportional to stress change with the former dominating measured strains. As the stress state neared the yield surface, the total accumulated strain (sum of strain invariants,
, as defined in ) during stages of constant stress was found to increase. The effects of the yielding of the GK specimens were readily identified due to the relatively low degree of bonding present in the artificial material. The yield surface was mapped from a combination of drained and undrained monotonic triaxial compression tests and is shown in (see Le Citation2018). Structural yielding of London Clay in the positive deviator stress space was more difficult to identify due to its highly overconsolidated nature. The development of an increasing proportion of shear strains was still observed as the stress state approached the Hvorslev surface (peak friction angle) suggesting incipient yielding of the soil structure.
During the periods of constant stress, all specimens showed trends in time-dependent behaviour that were consistent with (i) approaching stress path; (ii) current state; and (iii) degree of structuration. In , the incremental viscous strain ratio () is plotted in stress space during creep for the GK and LC specimens respectively. The volumetric and shear strains shown in the figures were taken from the final measured values for each creep stage and are represented in the figures as components of the resultant incremental strain vector,
. The base of each vector is taken to be the effective stress state at which a creep stage was performed. The magnitude and inclination of the vectors are calculated by assuming volumetric and shear strain components are the abscissa and ordinate strain components respectively. Particularly, it was observed that the magnitude and direction of the incremental strain ratio was dependent on the position of the current stress state relative to the initial yield surface. For both materials, the incremental viscous strain ratio (
was found to increase, at an equivalent deviatoric stress, with counter-clockwise rotation of stress increment (
from the horizontal, as discussed in more detail below. This suggests that the viscous strain increment ratio is dependent on the applied stress path. As the stress state approached the peak, samples showed an increasing tendency to dilate with continued shearing.
Figure 13. Ratios of incremental creep viscous strain components for GK specimens in stress space.
Figure 14. Ratios of incremental viscous creep strain components for LC specimens in stress space.
For GK1 and GK3 where the stress path intersects the initial yield surface at point A, as shown in , the magnitude of the incremental strain ratio increased immediately following yielding but gradually decreased with continued strain. The increase of the viscous incremental strain during the intermediate stages of constant stress is attributed to an increased compressibility associated with structural collapse. The decrease in magnitude with continued strain therefore reflects a reduced contribution of structure degradation to the overall measured strain. Aside from the reduction in magnitude of the incremental strain ratio, the direction of the vector was found to depend on the current stress state relative to the yield surface. That is, significant rotation of the incremental strain vector only occurred beyond gross yield and tended towards the direction of the approaching stress path. Owing to the heavily overconsolidated nature of London Clay, the stress path never reached the gross yield surface. As a result, the magnitude of the viscous incremental strain vector was only found to increase with continued shearing. As suggested earlier, the increase in viscous incremental strain ratio reflects the gradual degradation of the soil structure. For both clays, a gradual counter-clockwise rotation of the viscous strain vector, , with continued strain was observed. Results would indicate, therefore, that the ratio between volumetric and shear strains is less dependent on the type and amount of structure. The incremental strain ratio was found to always tend towards critical state conditions (
.
The dilatancy characteristics of the GK and LC specimens, as shown in , respectively, were found to be consistent with the structure identified and applied effective stress path. That is, specimens of GK were found to experience continuous contraction with drained loading at constant confining stress due to the collapse of soil structure. The dilatancy behaviour of LC was found to be typical of a highly overconsolidated clay as the specimens exhibited only limited volumetric contraction before dilating with continued drained shearing. The direction of the effective stress path from a common initial mean effective stress was found to influence the amount of dilatancy experienced by the specimens. While it is clear that the dilatancy characteristics of the two soils are different, largely due to the structure present in the specimens, the orientation of the time-dependent (creep) incremental strain component was found to develop in a similar manner up to the point of failure. However, specimens of LC were able to maintain dilatant behaviour at constant stress states near failure, unlike specimens of GK. The difference in behaviour close to failure is thought to be related to the initial soil structure and strains developed during shearing.
The behaviour reported for these two structured clays is shown to be consistent with that presented by Tavenas et al. (Citation1978) for a lightly overconsolidated clay. Specifically, for stress states lying beneath a stress ratio of
, where
is the critical state stress ratio, viscous deformations measured after an extended period (a minimum of 1,000 to a maximum of 70,000 minutes in this study) were small; where viscous strains were measured, volumetric deformations were found to dominate. With continued increase in deviator stress, such that stress states were between stress ratios
and
, measured shear strains were found to increase over an equivalent period of time (a reference time of 1000 minutes was used to compare the difference stages) during the holding constant stress stage. The total viscous shear strain component for a given time period therefore increases with stress ratio. As a result, time-dependent incremental shear strain was found to increasingly contribute to the overall viscous deformation. The increase in shear strain component with stress ratio can be seen in both through: (i) the counter-clockwise rotation of the resultant incremental viscous strain vector as the stress state approaches failure; and (ii) the relative increase in viscous strain during the creep stages. It is worth noting that the relative increase in the volumetric strain component at about 70 kPa deviator stress for GK during drained shearing is a result of yielding. As first described by Mesri and Godlewski (Citation1977), the time-dependent behaviour of a soil at constant effective stress is thought to be related to the ‘instantaneous compressibility’ of the soil structure. This suggests that the increased viscous deformation is therefore related to an increased compressibility due to the collapse of structure because of its proximity to the yield surface.
Incrementally loaded drained compression tests with intermediate stages of constant stress along either constant cell pressure ( or constant axial stress (
stress paths for London Clay from Lovenbury (Citation1969) have also been included in with viscous strain vectors at the end of each holding stage plotted. Similar to the results presented in this study, Lovenbury (Citation1969) found a gradual counter-clockwise rotation of the resultant incremental viscous strain vector with increasing incremental stress ratio until the approach of drained failure where shear strains completely dominate measured deformations.
From these results, both plastic yielding and the incremental flow rule were found to follow the assumptions made in the critical state soil mechanics (CSSM) framework (Roscoe and Burland Citation1968) both within and outside the yield surface. In particular, it was shown that the time-dependent incremental viscous strain ratio, , was dependent on (i) the approaching stress path and (ii) the type of structure present in the soil (heavily overconsolidated or bonding type structure).
4.2 Development of strain with time
While a number of researchers have shown that the time-dependent deformation of clays is essentially governed by the position of the current stress state relative to the yield surface (e.g. Mitchell, Campanella, and Singh Citation1968; Tavenas et al. Citation1978), more recent studies (e.g. Kuwano and Jardine Citation2002; Imai, Tanaka, and Saegusa Citation2003) have revealed a more complex strain-rate-dependent relationship with time than the simple phenomenological relationships given by EquationEquation 2(2)
(2) or (EquationEquation 3
(3)
(3) ). Contrary to incrementally loaded creep tests, computer-controlled steadily ramped stress paths result in less pronounced viscous strain with time. Applying a semi-logarithmic creep strain function to an intermediate creep stage would result in a significant overestimation of the overall viscous strain. In such cases, the overestimation is a result of the inclusion of time in the relationship and hence there is a requirement for a ‘reference time’. Further, the creep parameter
in EquationEquation 3
(3)
(3) does not appear to be a material constant and varies with stress level and interacts with the primary consolidation. For drained triaxial tests, the origin of time, typically taken as 24 hours for an oedometer test, is unclear as no ‘primary consolidation’ occurs during shearing; therefore, any curve-fitting procedure at constant effective stress is not possible using a semi-logarithmic function.
plots a typical time-dependent response of a soil specimen upon reaching a creep constant stress stage. Measured strains are plotted for both volumetric and shear strain components against linear and logarithmic time; strain rate is calculated as the slope between two consecutive points in the strain-time plots. As shown in (b) and (d) rather than a typical constant power decay curve (given by the parameter ), there exists a significant period of near constant strain-rate prior to any measurable decrease in strain-rate with time. Similar to the results presented by Kuwano and Jardine (Citation2002) for granular soils and Soga and Mitchell (Citation1996) for Pancone clay samples, creep tests on both of the structured clays investigated here show significant interaction between the approaching strain rate and the measured strain-rate-time-decay relationship. That is, the decay of strain-rate was related to the strain-rate imposed during the stress path leading to the creep constant stress stage and the instantaneous compressibility of the soil. For these two structured soils, the parameter
was found to be dependent on the soils’ current stress state relative to the yield surface. This result contradicts the conclusions presented by Tavenas et al. (Citation1978) for a lightly overconsolidated clay, where
was found to decrease with increasing stress ratio.
Figure 15. Typical strain development at constant stress. Development of strain for Sample LC1 at Creep Stage 3: Volumetric (a) strain against time (b) strain-rate against time; Shear (c) strain against time (d) strain-rate against time.
This discrepancy can be resolved by examining the different incremental step sizes used during shearing. Whereas Tavenas et al. (Citation1978) achieved each creep constant stress stage by applying incremental loads, constant stress stages in this investigation were reached by slowly ramping both the confining cell pressure and deviator stress, while allowing for the dissipation of any excess pore pressure (namely, larger and smaller incremental stress ratios in ). The differences in the strain rate applied in these two approaches to reach the required stress state significantly influence their subsequent creep response. The reduced rate of loading, associated with slow ramping, results in an overlap between the effects of consolidation and viscous behaviour associated with creep in the measured displacements. Similar experimental observations have been made about oedometer tests where small stress increments have been applied where a strong dependence of on the incremental vertical stress ratio (
) has been reported (e.g. Leonards and Altschaeffl Citation1964; Mesri and Godlewski Citation1977; Leroueil et al. Citation1985; Tanaka and Tsutsumi Citation2016). Leonards and Altschaeffl (Citation1964) found that as the incremental stress ratio became very small, the volume changes and excess pore-water pressure relating to consolidation became insignificant compared with the volume changes and pore pressures associated with soil structural changes at constant effective stress. It was also found that the dimensionless compression curves relating time factor,
, with average degree of consolidation,
, predicted by Terzaghi’s consolidation theory were invalid for such small incremental stress ratios. As shown in , there are three cases of compression versus time curves which differ depending on the incremental stress ratio and can be generally classified as: (i) significant incremental increase in vertical stress (curve 1) where the classical one-dimensional compression curve is observed; (ii) small increase in incremental stress (curve 2) where a marked reduction in compressibility is observed immediately after loading with proportionally greater strain developed after the complete dissipation of pore pressure; and (iii) intermediate increases in incremental stress (curve 3) where the behaviour is between curves 1 and 2. It is worth noting that with small load increment ratios, strain versus
plots do not have the characteristic S-shape and Terzaghi’s theory cannot predict rates of pore pressure dissipation, even though
is unity at the start of consolidation (see also Leroueil et al. Citation1985).
Figure 16. Influence of incremental stress ratio ( on the settlement time curves (after Leonards and Altschaeffl Citation1964) with permission from ASCE.
The variation in with incremental stress ratio and stress level has long been discussed. Mesri and Godlewski (Citation1977) explain the variation as evidence for a
relationship for clays as it is difficult to separate ‘primary’ and ‘secondary’ stages of consolidation with small incremental stress ratios and therefore to define
. Approaches that specify creep as commencing at the end-of-primary (EOP) consolidation, where the dissipation of all excess pore pressure is complete, also underestimate viscous deformation, as with small stress increments, EOP occurs much earlier than commonly predicted by the classical construction (e.g. Leonards and Altschaeffl Citation1964).
As no end-of-primary consolidation can be determined for these tests, owing to the slow rate of shearing, it is not possible to directly compare the results of this current study with the observations presented by Leonards and Altschaeffl (Citation1964). However, results presented here suggest that there exists another curve for very low stress increments (or approximately zero when considering slow drained ramping) where end-of-primary occurs instantaneously following loading and noticeable decay of strain-rate does not occur immediately following the beginning of any creep stage. This type of behaviour is postulated as ‘negligible increase in effective stress’ (curve 4) shown in . In such cases, a noticeable plateau of constant strain rate would be observed before any significant decrease in strain-rate occurs. It is also recognized that ‘curve 4ʹ is likely to be equivalent to the compression-time plots for both the volumetric and shear strain components in (a) and (c). Creep stages where the preceding shearing strain-rate is slow would result in an extended period of constant creep strain-rate before exhibiting the classical power law decay (constant ), as shown in (b) and (d).
The increase in time required before a decrease in strain rate was measured is likely due to the soil state in being on a lower ‘equivalent timeline’ or ‘isotache line’ compared to the ‘reference timeline’ (either 24 hours or EOP) (Yin, Zhu, and Graham Citation2002). Creep strain predictions using elapsed time measured from the instance of constant stress ‘creep stage’ will therefore yield problematic interpretation as the current isotache line/equivalent timeline and reference timeline are mismatched. Careful interpretation of time is therefore necessary when predicting the long-term behaviour of soil elements subject to slow consolidation and present large creep potential (e.g. sensitive or soft clays). As Yin, Zhu, and Graham (Citation2002) have previously demonstrated that constant equivalent time,
, lines are equivalent to lines of constant viscoplastic strain rate,
, it can be expected that the evolution of strain rate with elapsed time will be delayed due to the offset of the current soil state to the ‘reference timeline’.
It has been shown that the creep rate and magnitude of strain developed at constant effective stress is dependent on two factors: (i) the soil’s current stress state relative to its yield surface and (ii) the magnitude of the incremental stress ratio. When predicting the strain rate developed under constant stress conditions in the field, both the relative change in stress (both in terms of the incremental step size and the effective stress path) and proximity to the yield surface of individual soil elements should carefully be taken into account. It can also be seen that phenomenological equations derived from standard incrementally loaded oedometer tests fail to capture the strain development with time in the absence of excess pore pressure dissipation while at constant stress.
5 Conclusions
The paper has summarized a number of empirical and constitutive models commonly used to interpret the viscous behaviour of soils under a range of stress conditions and has reported new the results from several multi-stage triaxial creep tests where hold stages were applied during drained compression. The following conclusions are drawn. Tests on two structured soils showed a time-dependent behaviour that is related to the nature of the structure present in the soils. The viscous strain components (volumetric and shear strains) of both structured soils are a function of the current effective stress state and the relative location of the yield surface. The resultant incremental viscous strain vector during creep is dependent on the development of strain during the previous shearing stage. Along defined compression stress paths (positive changes in deviator stress), the incremental resultant viscous strain vector was found to rotate counter-clockwise towards a vertical orientation (i.e. with viscous shear strains became progressively more dominant as shearing progressed). Negligible rotation of the incremental resultant viscous strain vector was observed for stress states with
. The proportion of shear strains to total strains measured during a constant stress stage increased for stress states within 0.2 M to 1.0 M. Classical strain-rate decay functions overestimated the real strain-time behaviour of the tests reported as they require a ‘reference time’ definition.
Several common limitations present in the phenomenological and constitutive models are identified based on the results presented in this study and are summarized as follows. As observed in previous studies where small incremental stress ratios were employed, the results from this current study indicate that great care should be taken when assuming a constant secondary compression index. To account correctly for the viscous deformation developed during stages of constant stress, the step size and relative position of the current effective stress state to the gross yield surface should be incorporated in any advanced time-dependent constitutive model. It may be necessary to include a creep parameter associated with the instantaneous compressibility (compressibility associated with structural degradation) to capture accurately the increased viscous potential during the yielding of soft and sensitive clays in triaxial stress space (an expression of this type can be found in Liu and Carter (Citation2000) for one-dimensional conditions). For heavily overconsolidated soils, creep strains were measured at constant stress within the gross yield surface. The ratio of strain components ( was found to vary along the drained stress path. In order to replicate the time-dependent behaviour of a stiff overconsolidated clay, constitutive models should be able to simulate creep behaviour prior to gross yield and allow for the rotation of the strain increment vector along an applied stress path.
Data availability
The data that support the findings of this study are available from the corresponding author upon reasonable request.
NOTATION
Table
Acknowledgments
Tests were performed both at the University of Sydney and Imperial College, London. The authors are grateful for the help provided by the technicians at both universities, especially Mr. Ross Barker and Mr. Steven Ackerley for their help in setting up the apparatus for the experimental work.
Disclosure statement
No potential conflict of interest was reported by the author(s).
References
- Adachi, T., F. Oka, and M. Mimura. 1987. “Mathematical Structure of an Overstress Elasto-viscoplastic Model for Clay.” Soils and Foundations 27 (3): 31–42. doi:https://doi.org/10.3208/sandf1972.27.3_31.
- Adachi, T., F. Oka, and M. Mimura. 1996. “Modelling Aspects Associated with Time Dependent Behavior of Soils.” In Measuring and Modeling Time Dependent Soil Behavior, edited by T. C. Sheahan and V. N. Kaliakin, 61–95. New York, NY: American Society of Civil Engineers (ASCE).
- Augustesen, A., M. Liingaard, and P. V. Lade. 2004. “Evaluation of Time-dependent Behavior of Soils.” International Journal of Geomechanics 4 (3): 137–156. doi:https://doi.org/10.1061/(ASCE)1532-3641(2004)4:3(137).
- Berre, T., and K. Iversen. 1972. “Oedometer Test with Different Specimen Heights on a Clay Exhibiting Large Secondary Compression.” Géotechnique 22 (1): 53–70. doi:https://doi.org/10.1680/geot.1972.22.1.53.
- Bjerrum, L. 1967. “Engineering Geology of Norwegian Normally-consolidated Marine Clays as Related to Settlements of Buildings.” Géotechnique 17 (2): 83–118. doi:https://doi.org/10.1680/geot.1967.17.2.83.
- Bjerrum, L., and K. Y. Lo. 1963. “Effect of Again of the Shear-strength Properties of a Normally Consolidated Clay.” Géotechnique 13 (2): 147–157. doi:https://doi.org/10.1680/geot.1963.13.2.147.
- Bodas Freitas, T. M., D. M. Potts, and L. Zdravković. 2012. “Implications of the Definition of the Φ Function in Elastic-viscoplastic Models.” Géotechnique 62 (7): 643–648. doi:https://doi.org/10.1680/geot.10.P.053.
- Crooks, J. H. A., and J. Graham. 1976. “Geotechnical Properties of the Belfast Estuarine Deposits.” Géotechnique 26 (2): 293–315. doi:https://doi.org/10.1680/geot.1976.26.2.293.
- Gasparre, A. (2005). “Advanced Laboratory Characterisation of London Clay.” PhD thesis, Imperial College London.
- Gasparre, A., S. Nishimura, M. R. Coop, and R. J. Jardine. 2007. “The Influence of Structure on the Behaviour of London Clay.” Géotechnique 57 (1): 19–31. doi:https://doi.org/10.1680/geot.2007.57.1.19.
- Graham, J., J. H. A. Crooks, and A. L. Bell. 1983a. “Time Effects on the Stress-strain Behaviour of Natural Soft Clays.” Géotechnique 33 (3): 327–340. doi:https://doi.org/10.1680/geot.1983.33.3.327.
- Graham, J., J. H. A. Crooks, and S. L. K. Lau. 1988. “Yield Envelopes: Identification and Geometric Properties.” Géotechnique 38 (1): 125–134. doi:https://doi.org/10.1680/geot.1988.38.1.125.
- Graham, J., M. L. Noonan, and K. V. Lew. 1983b. “Yield States and Stress–strain Relationships in a Natural Plastic Clay.” Canadian Geotechnical Journal 20 (3): 502–516. doi:https://doi.org/10.1139/t83-058.
- Hashiguchi, K., and T. Okayasu. 2000. “Time-dependent Elastoplastic Constitutive Equation Based on the Subloading Surface Model and Its Application to Soils.” Soils and Foundations 40 (4): 19–36. doi:https://doi.org/10.3208/sandf.40.4_19.
- Head, K. H., and R. J. Epps. 2010. Manual of Soil Laboratory Testing. Vol 3, Whittles Publishing, Scotland, UK.
- Imai, G., Y. Tanaka, and H. Saegusa. 2003. “One-dimensional Consolidation Modeling Based on the Isotach Law for Normally Consolidated Clays.” Soils and Foundations 43 (4): 173–188. doi:https://doi.org/10.3208/sandf.43.4_173.
- Jian-Hua, Y., and Wei-Qiang, F. 2016. A new simplified method and its verification for calculation of consolidation settlement of a clayey soil with creep. Canadian Geotechnical Journal 54 (3): 333–347. https://doi.org/https://doi.org/10.1139/cgj-2015-0290
- Kaliakin, V. N., and Y. F. Dafalias. 1990a. “Theoretical Aspects of the Elastoplastic-viscoplastic Bounding Surface Model for Cohesive Soils.” Soils and Foundations 30 (3): 11–24. doi:https://doi.org/10.3208/sandf1972.30.3_11.
- Kaliakin, V. N., and Y. F. Dafalias. 1990b. “Verification of the Elastoplastic-viscoplastic Bounding Surface Model for Cohesive Soils.” Soils and Foundations 30 (3): 25–36. doi:https://doi.org/10.3208/sandf1972.30.3_25.
- Kavvadas, M., and A. Kalos. 2019. “A Time-dependent Plasticity Model for Structured Soils (TMS) Simulating Drained Tertiary Creep.” Computers and Geotechnics 109: 130–143. doi:https://doi.org/10.1016/j.compgeo.2019.01.022.
- Kelln, C., J. Sharma, D. Hughes, and J. Graham. 2008. “An Improved Elastic–viscoplastic Soil Model.” Canadian Geotechnical Journal 45 (10): 1356–1376. doi:https://doi.org/10.1139/T08-057.
- Kuhn, M. R., and J. K. Mitchell. 1993. “New Perspectives on Soil Creep.” Journal of Geotechnical Engineering 119 (3): 507–524. doi:https://doi.org/10.1061/(ASCE)0733-9410(1993)119:3(507).
- Kutter, B. L., and N. Sathialingam. 1992. “Elastic-viscoplastic Modelling of the Rate-dependent Behaviour of Clays.” Géotechnique 42 (3): 427–441. doi:https://doi.org/10.1680/geot.1992.42.3.427.
- Kuwano, R., and R. J. Jardine. 2002. “On Measuring Creep Behaviour in Granular Materials through Triaxial Testing.” Canadian Geotechnical Journal 39 (5): 1061–1074. doi:https://doi.org/10.1139/t02-059.
- Lade, P. V. 2016. Triaxial Testing of Soils. John Wiley & Sons Ltd, Chichester, U.K.
- Le, T. (2018). “Time Dependent Behaviour of Naturally and Artificially Structured Clays.” PhD thesis, University of Sydney.
- Le, T., and D. Airey. 2021. “Mechanical Behaviour of a Weakly Structured Soil at Low Confining Stress.” Géotechnique 1–15. doi:https://doi.org/10.1680/jgeot.21.00035.
- Lefebvre, G., D. Leboeuf, M. E. Rahhal, A. Lacroix, J. Warde, and K. H Stokoe Ii. 1994. “Laboratory and Field Determinations of Small-strain Shear Modulus for a Structured Champlain Clay.” Canadian Geotechnical Journal 31 (1): 61–70. doi:https://doi.org/10.1139/t94-007.
- Leonards, G. A., and A. G. Altschaeffl. 1964. “Compressibility of Clay.” Journal of the Soil Mechanics and Foundations Division 90 (5): 133–155. doi:https://doi.org/10.1061/JSFEAQ.0000649.
- Leoni, M., M. Karstunen, and P. A. Vermeer. 2008. “Anisotropic Creep Model for Soft Soils.” Géotechnique 58 (3): 215–226. doi:https://doi.org/10.1680/geot.2008.58.3.215.
- Leroueil, S., M. Kabbaj, F. Tavenas, and R. Bouchard. 1985. “Stress–strain–strain Rate Relation for the Compressibility of Sensitive Natural Clays.” Géotechnique 35 (2): 159–180. doi:https://doi.org/10.1680/geot.1985.35.2.159.
- Leroueil, S., and P. R. Vaughan. 1990. “The General and Congruent Effects of Structure in Natural Soils and Weak Rocks.” Géotechnique 40 (3): 467–488. doi:https://doi.org/10.1680/geot.1990.40.3.467.
- Liingaard, M., A. Augustesen, and P. V. Lade. 2004. “Characterization of Models for Time-dependent Behavior of Soils.” International Journal of Geomechanics 4 (3): 157–177. doi:https://doi.org/10.1061/(ASCE)1532-3641(2004)4:3(157).
- Liu, M. D., and J. P. Carter. 2000. “Modelling the Destructuring of Soils during Virgin Compression.” Géotechnique 50 (4): 479–483. doi:https://doi.org/10.1680/geot.2000.50.4.479.
- Lovenbury, H. (1969). “Creep Characteristics of London Clay.” PhD, Imperial College London.
- Mánica, M. A., A. Gens, E. Ovando-Shelley, E. Botero, and J. Vaunat. 2021. “An Effective Combined Framework for Modelling the Time-dependent Behaviour of Soft Structured Clays.” Acta Geotechnica 16 (2): 535–550. doi:https://doi.org/10.1007/s11440-020-01025-4.
- Mesri, G., and A. Castro. 1987. “Cα/Cc Concept and K0 during Secondary Compression.” Journal of Geotechnical Engineering 113 (3): 230–247. doi:https://doi.org/10.1061/(ASCE)0733-9410(1987)113:3(230).
- Mesri, G., and Y. K. Choi. 1985. “Settlement Analysis of Embankments on Soft Clays.” Journal of Geotechnical Engineering 111 (4): 441–464. doi:https://doi.org/10.1061/(ASCE)0733-9410(1985)111:4(441).
- Mesri, G., and P. M. Godlewski. 1977. “Time and Stress-compressibility Interrelationship.” Journal of the Geotechnical Engineering Division 103 (5): 417–430. doi:https://doi.org/10.1061/AJGEB6.0000421.
- Mitchell, J. K., R. G. Campanella, and A. Singh. 1968. “Soil Creep as a Rate Process.” Journal of the Soil Mechanics and Foundations Division 94 (1): 231–253. doi:https://doi.org/10.1061/JSFEAQ.0001085.
- Qu, G., S. D. Hinchberger, and K. Y. Lo. 2010. “Evaluation of the Viscous Behaviour of Clay Using Generalised Overstress Viscoplastic Theory.” Géotechnique 60 (10): 777–789. doi:https://doi.org/10.1680/geot.8.P.031.
- Roscoe, K. H., and J. B. Burland. 1968. “On the Generalized Stress-strain Behaviour of Wet Clay.” In Engineering Plasticity, 535–609. Cambridge, U.K: Cambridge Press.
- Silva, A., and H. Brandes. 1996. “Drained Creep Behaviour of Marine Clays.” In Measuring and Modelling Time Dependent Soil Behaviour, edited by T. C. Sheahan and V. N. Kaliakin, 228–242. New York: American Society of Civil Engineers (ASCE).
- Singh, A., and J. K. Mitchell. 1968. “General Stress-strain-time Function for Soils.” Journal of the Soil Mechanics and Foundations Division 94 (1): 21–46. doi:https://doi.org/10.1061/JSFEAQ.0001084.
- Sivasithamparam, N., M. Karstunen, and P. Bonnier. 2015. “Modelling Creep Behaviour of Anisotropic Soft Soils.” Computers and Geotechnics 69: 46–57. doi:https://doi.org/10.1016/j.compgeo.2015.04.015.
- Soga, K., and J. Mitchell. 1996. “Rate-dependent Deformation of Structured Natural Clays.” In Measuring and Modelling Time Dependent Soil Behaviour, edited by T. C. Sheahan and V. N. Kaliakin, 228–242. New York NY: American Society of Civil Engineers (ASCE).
- Soga, K., and C. O’sullivan. 2010. “Modeling of Geomaterials Behavior.” Soils and Foundations 50 (6): 861–875. doi:https://doi.org/10.3208/sandf.50.861.
- Sorensen, K. K., B. A. Baudet, and B. Simpson. 2007. “Influence of Structure on the Time-dependent Behaviour of a Stiff Sedimentary Clay.” Géotechnique 57 (1): 113–124. doi:https://doi.org/10.1680/geot.2007.57.1.113.
- Standing, J. R. 2020. “Identification and Implications of the London Clay Formation Divisions from an Engineering Perspective.” Proceedings of the Geologists’ Association 131 (5): 486–499. doi:https://doi.org/10.1016/j.pgeola.2018.08.007.
- Šuklje, L. 1957. “The Analysis of the Consolidation Process by the Isotaches Method.” Proceedings of the 4th International Conference on Soil Mechanics and Foundation Engineering London. 1: 200–206. Butterworths.
- Tanaka, H., and A. Tsutsumi. 2016. “Isotache Model for Consolidation with a Small Incremental Load.” Geotechnical Research 3 (4): 180–191. doi:https://doi.org/10.1680/jgere.16.00011.
- Tatsuoka, F., M. Ishihara, B. H. Di, and R. Kuwano. 2002. “Time-dependent Shear Deformation Characteristics of Geomaterials and Their Simulation.” Soils and Foundations 42 (2): 103–129. doi:https://doi.org/10.3208/sandf.42.2_103.
- Tavenas, F., J.-P. Des Rosiers, S. Leroueil, P. La Rochelle, and M. Roy. 1979. “The Use of Strain Energy as a Yield and Creep Criterion for Lightly Overconsolidated Clays.” Géotechnique 29 (3): 285–303. doi:https://doi.org/10.1680/geot.1979.29.3.285.
- Tavenas, F., and S. Leroueil. 1980. “The Behaviour of Embankments on Clay Foundations.” Canadian Geotechnical Journal 17 (2): 236–260. doi:https://doi.org/10.1139/t80-025.
- Tavenas, F., S. Leroueil, P. L. Rochelle, and M. Roy. 1978. “Creep Behaviour of an Undisturbed Lightly Overconsolidated Clay.” Canadian Geotechnical Journal 15 (3): 402–423. doi:https://doi.org/10.1139/t78-037.
- Taylor, D. W. 1942. Research on Consolidation of Clays, 82. Massachusetts Institute of Technology. Cambridge, MA.
- Taylor, D. W., and W. Merchant. 1940. “A Theory of Clay Consolidation Accounting for Secondary Compression.” Journal of Mathematics and Physics 19 (1–4): 167–185. doi:https://doi.org/10.1002/sapm1940191167.
- Terzaghi, K. 1941. “Undisturbed Clay Samples and Undisturbed Clays.” Boston Society of Civil Engineers 28: 3.
- Tian, W.-M., A. J. Silva, G. E. Veyera, and M. H. Sadd. 1994. “Drained Creep of Undisturbed Cohesive Marine Sediments.” Canadian Geotechnical Journal 31 (6): 841–855. doi:https://doi.org/10.1139/t94-101.
- Truong Le., David A., and Jamie, S. 2019. Creep behaviour of undisturbed London Clay in triaxial stress space. 7th International Symposium on Deformation Characteristics of Geomaterials (IS-Glasgow 2019), Glasgow: EDP Sciences.
- Vaid, Y. P., and R. G. Campanella. 1977. “Time-dependent Behavior of Undisturbed Clay.” Journal of Geotechnical and Geoenvironmental Engineering 103 (ASCE): 13065.
- Wu, T. H., D. Resendiz, and R. J. Neukirchner. 1966. “Analysis of Consolidation by Rate Process Theory.” Journal of the Soil Mechanics and Foundations Division 92 (6): 229–248. doi:https://doi.org/10.1061/JSFEAQ.0000921.
- Yin, J.-H., and J. Graham. 1994. “Equivalent Times and One-dimensional Elastic Viscoplastic Modelling of Time-dependent Stress–strain Behaviour of Clays.” Canadian Geotechnical Journal 31 (1): 42–52. doi:https://doi.org/10.1139/t94-005.
- Yin, J.-H., and J. Graham. 1999. “Elastic Viscoplastic Modelling of the Time-dependent Stress-strain Behaviour of Soils.” Canadian Geotechnical Journal 36 (4): 736–745. doi:https://doi.org/10.1139/t99-042.
- Yin, J.-H., J.-G. Zhu, and J. Graham. 2002. “A New Elastic Viscoplastic Model for Time-dependent Behaviour of Normally and Overconsolidated Clays: Theory and Verification.” Canadian Geotechnical Journal 39 (1): 157–173. doi:https://doi.org/10.1139/t01-074.
- Yin, Z.-Y., M. Karstunen, C. S. Chang, M. Koskinen, and M. Lojander. 2011. “Modeling Time-dependent Behavior of Soft Sensitive Clay.” Journal of Geotechnical and Geoenvironmental Engineering 137 (11): 1103–1113. doi:https://doi.org/10.1061/(ASCE)GT.1943-5606.0000527.
- Zhu, J. G., and J.-H. Yin. 2001. “Drained Creep Behaviour of Soft Hong Kong Marine Deposits.” Géotechnique 51 (5): 471–474. doi:https://doi.org/10.1680/geot.2001.51.5.471.
- Zhu, J.-G., J.-H. Yin, S.-T. Luk, J-H. Yin, and S-T. Luk. 1999. “Time-dependent Stress-strain Behavior of Soft Hong Kong Marine Deposits.” Geotechnical Testing Journal 22 (2): 118–126. doi:https://doi.org/10.1520/GTJ11270J.