
 ?Mathematical formulae have been encoded as MathML and are displayed in this HTML version using MathJax in order to improve their display. Uncheck the box to turn MathJax off. This feature requires Javascript. Click on a formula to zoom.
Abstract
There is growing interest of ergogenic aids that deliver supplemental oxygen during exercise and recovery, however, breathing supplemental oxygen via specialist facemasks is often not feasible. Therefore, this study investigated the effect of an oxygen-nanobubble beverage during submaximal and repeated sprint cycling. In a double-blind, randomized, placebo-controlled study, 10 male cyclists (peak aerobic capacity, 56.9 ± 6.1 mL·kg−1·min−1; maximal aerobic power, 385 ± 25 W) completed submaximal or maximal exercise after consuming an oxygen-nanobubble (O2) or placebo (PLA) beverage. Submaximal trials comprised 30-min of steady-state cycling at 60% peak aerobic capacity and 16.1-km time-trial (TT). Maximal trials involved 4 × 30 s Wingate tests interspersed by 4-min recovery. Time-to-completion during the 16.1-km TT was 2.4% faster after O2 compared with PLA (95% CI = 0.7–4.0%, p = 0.010, d = 0.41). Average power for the 16.1-km TT was 4.1% higher for O2 vs. PLA (95% CI = 2.1–7.3%, p = 0.006, d = 0.28). Average peak power during the repeated Wingate tests increased by 7.1% for O2 compared with PLA (p = 0.002, d = 0.58). An oxygen-nanobubble beverage improves performance during submaximal and repeated sprint cycling, therefore may provide a practical and effective ergogenic aid for competitive cyclists.
Introduction
Whilst the lung is recognized as the primary organ of gas exchange, there is emerging evidence to suggest that the gastrointestinal (GI) tract may provide a gas exchange surface for oxygen uptake (Forth and Adam Citation2001). Indeed, oxygen-enriched beverages have been shown to be capable of diffusion through the mucosa of the colon, peritoneum and stomach in animals (Klug et al. Citation1988; Cooper Citation1995; Barr et al. Citation1996; Forth and Adam Citation2001) as well as the oral cavity and stomach in humans (Nestle et al. Citation2004). Resulting increases in oxygen tension in the splanchnic circulation and portal venous system have led to the marketing of commercially available oxygen-enriched drinks as ergogenic aids for athletic performance. This is despite a lack of evidence-base, within peer-reviewed literature, for their efficacy (Hampson et al. Citation2003; Piantadosi Citation2006). Indeed, to date, there are no peer-reviewed studies reporting an ergogenic effect of oxygen-enriched water on neither submaximal (Mielke et al. Citation2005; McNaughton et al. Citation2007), maximal (Mielke et al. Citation2005; Wilmert et al. Citation2002) or time-trial (TT) related outcomes (Wing-Gaia et al. Citation2005; McNaughton et al. Citation2007; Fleming et al. Citation2017).
The investigations on submaximal and maximal performance have predominantly relied on measures of oxygen uptake (VO2) using breath by breath calorimetry. This method relies on the Haldane transformation, which is based on the assumption that, in steady state, the mass of nitrogen inspired over time is exactly the same as that expired (Haldane Citation1912). However, ingested oxygen is not accounted for through this equation so it is not known how much oxygen has been utilized, although volumes of oxygen encapsulated in a beverage are trivial in comparison to respiration (Piantadosi Citation2006). In addition, any changes in arterial oxygen content are likely to be met by proportional changes in muscle blood flow to control oxygen delivery (Saltin et al. Citation1998). The lack of a performance outcome from TT investigations may be due to inadequate oxygen delivered to the working muscles to provide any detectable benefit. Such studies provided only small volumes of an oxygen-enriched solution (15–160 mL) (Wing-Gaia et al. Citation2005; McNaughton et al. Citation2007; Fleming et al. Citation2017) that deliver very small quantities of oxygen to the GI tract (Piantadosi Citation2006).
Recent advancements in cancer therapy have identified a novel oxygen delivery method for combating the hypoxic nature of many solid tumors (Nakazawa et al. Citation2016). One such strategy has been the administration of oxygen filled micro and nanobubbles (Kwan et al. Citation2012; McEwan et al. Citation2015; Eisenbrey et al. Citation2015; Mahjour et al. Citation2019). For instance, Owen et al. (Citation2016) demonstrate comparable effects upon tumor oxygen levels achieved through either intravenous and oral administration of oxygen-loaded nanobubbles, superior to that of oxygen saturated water. The precise mechanism of action is still under investigation, but it is possible that a greater quantity of oxygen may be delivered to the tissue than initially encapsulated in the consumed dose if the lecithin coated bubbles contained in the drink act as oxygen carriers (Owen et al. Citation2022), much like how perfluorocarbon nanodroplets are reported to function as blood substitutes (Riess Citation2005). This novel nanobubble delivery method may also offer an alternative means of increasing oxygen availability for exercising skeletal muscle. Therefore, the aim of this study was to investigate the physiological responses to submaximal and maximal effort cycling following the ingestion of an oxygen-loaded nanobubble drink when compared to an inactive placebo.
Materials and methods
Study design
A randomized, across subjects, double-blind, placebo-controlled, crossover experimental design was implemented for this study. Trial order was allocated by the principal investigator using an online randomized number generator. Each participant attended six separate laboratory visits. On the first two visits, participants completed baseline health measurements, quantification of lactate threshold (4 mmol·L−1) and peak aerobic capacity (VO2peak), followed by familiarization to testing procedures. Each participant returned to the laboratory on four separate occasions (visit 3–6) to complete four experimental trials consisting of either i) 30 min steady-state (SS) cycling at 60% VO2peak followed by a 16.1-km TT or ii) 4 × 30 s Wingate tests interspersed by 4-min recovery. Each trial was performed at a similar time of day (±2 h) to control for effects of circadian rhythms on exercise performance (Reilly Citation1990) and separated by a 48–96 h wash-out period. Laboratory ambient temperature was maintained at 20 °C, and the relative humidity was 41.7 ± 3.1%. Nutritional intake was recorded via self-report food diaries for 24 h before the first experimental trial and replicated prior to subsequent sessions.
Participants
Ethical approval was provided by the University of Surrey institutional ethics committee (REF: CRC379). All participants provided written informed consent prior to commencing the study, and research procedures were conducted in accordance with the Revised Declaration of Helsinki (2013). Given the crossover study design, our sample size calculation (G*Power, HHU, Germany) determined that 9 participants were required to reject the null hypothesis that population means for TT power output are equal with a probability of 0.80 and associated type I error of 0.05, based on the assumption of a moderate effect size. To account for potential dropout rates, 11 healthy, competitive male cyclists (age, 27 ± 10 years; height, 1.80 ± 0.07 m; body mass, 72.7 ± 6.2 kg; and VO2peak, 56.9 ± 6.1 ml/kg/min; maximal aerobic power, 385 ± 25 W) were enrolled according to the CONSORT 2010 guidelines. Participants performed ∼10 h cycling training per week, had UK Category 3 race status and were classified as trained, competitive cyclists in accordance with previously defined criteria with regards to physiological response and training history (De Pauw et al. Citation2013; Priego Quesada et al. Citation2018). Participants were identified as healthy by the completion of a medical questionnaire alongside assessment of lung function (forced expiratory capacity [FVC], forced expiratory volume in 1 s [FEV1), blood pressure, and pulse oximetry (SpO2). Participants were excluded if: i) FEV1:FVC < 70%, ii) FVC or FEV1 < 80% predicted, iii) blood pressure > 140/90 mmHg, and iv) SpO2 <95%. All participants were declared as nonsmokers taking no medication or dietary supplements and were asked not to consume caffeine, tobacco and alcohol or perform strenuous exercise for 24 h before laboratory visits.
Nutritional interventions
During experimental trials, participants consumed either an oxygen-nanobubble (O2) or placebo (PLA) beverage. These were supplied by Avrox Technologies in 500 mL individually sealed bottles and consisted of the same solution containing water, glycerol, glycyrrhizin, lecithin and citric acid. Both beverages have similar organoleptic properties, including taste, aroma, and texture. Previous investigations have indicated that the oxygen nanobubble drink consists of a suspension of lecithin vesicles with a modal diameter of ∼100 nm and concentration 7 × 10¹² particles/ml (Owen et al. Citation2022). We propose that these vesicles act as oxygen carriers increasing the capacity of the blood to transport oxygen by ∼0.1 mg/L. Beverages were prepared by a member of the research team not responsible for data collection immediately prior to consumption to minimize the loss of oxygen saturation. Medical grade oxygen (CD Oxygen, BOC International, UK) was released into the solution for 2 min through a 5 mm inner diameter tube, at a pressure of 2 bar. The size distribution and concentration of the nanobubbles were measured using a nanoparticle tracking analyzer (Nanosight NS300, Malvern, PA). Their oxygen content was measured using an OXY MINI Minisensor Oxygen Meter (PreSens Precision Sensing GmbH, Regensburg, Germany). The results are shown in Supplemental Figures 1 and 2. Verification of the oxygen concentration was also made immediately prior to ingestion using an oxygen meter with a dip probe (Oakton DO6+, UK). Participants ingested a series of 75–200 mL volumes at fixed time points, before (5 min prior), during and/or after exercise. The dose is in-line with American College of Sports Medicine recommendations for appropriate fluid replacement in individuals performing physical activity (Sawka et al. Citation2007).
Blood sampling
Finger prick capillary blood samples were taken in agreement with World Health Organization guidelines (WHO Citation2010) to determine blood lactate and blood gas (pH, [HCO3−], TCO2, PO2 and PCO2). To measure blood lactate, 20 μL samples were collected into end-to-end sodium-heparised capillary tubes and analyzed using a Biosen C-line (EKF Diagnostic GmbH, Germany; coefficient of variation = < 1.5%, at a value of 12 mmol·L−1). To measure blood gas, 95 μL samples were collected into blood gas capillary tubes (Vitrex, Herlev, Denmark) and transferred into single-use i-STAT G3+ cartridges (Abbott, Illinois, USA). Samples were analyzed using an i-STAT 1 (Abbott, Illinois, USA). This analyzer has demonstrated excellent accuracy and precision for pH and [HCO3−] (intraclass correlation coefficients, r = 0.88, 0.86) (Dascombe et al. Citation2007).
Screening, baseline measures, and familiarization
Two weeks prior to the experimental trials, participants attended a screening visit to perform a spirometry assessment using a metabolic cart (Geratherm Respiratory GmbH, Lovemedical Ltd, UK) to measure FVC, FEV1 and FEV1:FVC. Participants also completed a submaximal incremental exercise test on an electronically braked SRM cycle ergometer (Schoberer Rad Meßtechnik, Germany) to determine lactate threshold. Power output commenced at 115 W, with increments of 35 W applied every 4 min. At the end of each incremental stage, blood lactate was measured until a concentration of > 4 mmol·L−1 was obtained. After 30 min rest, participants performed an incremental cycling test to exhaustion for the determination of VO2peak and maximal aerobic power. The protocol began with a 5 min warm up at 100 W, after which workload was automatically increased to 170 ± 10 W, with increments of 20 W applied every min until voluntary exhaustion. Breath-by-breath pulmonary gas exchange (VO2, VCO2, RER) was collected via a metabolic cart (Geratherm Respiratory GmbH, Lovemedical Ltd, UK) and HR (H10, Polar, UK) was recorded continuously during exercise. VO2peak and maximal aerobic power were taken as the highest 30 s average value obtained before voluntary exhaustion. Four days prior to the experimental trials, participants were familiarized with the SS cycle protocol and the 16.1-km TT, as described below.
Steady state and 16.1-km time trial cycling
Participants consumed a 200 mL bolus of either the O2 or PLA beverage 5 min prior to commencing 30 min of SS cycling on the SRM cycle ergometer. The workload for the SS cycling was set at 60% of the participants’ VO2peak and calculated from the linear relationship between VO2 and power output obtained from the submaximal incremental test. Measures of VO2, VCO2, HR, rating of perceived exertion (RPE), SpO2, blood lactate and blood gases were collected at baseline prior to exercise and throughout SS cycling at 5, 10, 20 and 30 min. After 10 min rest, participants consumed a further 200 mL bolus of either beverage 5 min prior to commencing a 16.1-km cycling TT followed by a series of 75 mL volumes at 4, 8, 12 and 16-km during the TT. Capillary blood sampling was repeated pre-exercise and at 2, 5, 10, 15, 20, 25, and 30 min post-exercise to determine blood lactate and blood gases. Participants were given no indication of completion time and received no feedback on performance during or after the TT. Reproducibility testing of the 16.1-km TT from our laboratory returned a coefficient of variation (CV) of 1.40% for average power.
Repeated sprint cycling
Participants consumed a 200 mL bolus of the O2 or PLA beverage and immediately commenced a 5 min warm-up on a Monark peak bike (Ergomedic 894E, Monark Sports and Medical, Sweden) with a resistance of 2.0 W·kg−1 body mass at 60–90 rev·min−1. Participants rested for 3 min prior to performing 4 × 30 s Wingate tests against a constant braking force (7.5% BW) with 4 min recovery between efforts. Participants consumed a series of 75 mL volumes immediately after the 1st, 2nd, 3rd, and 4th sprints. Capillary blood sampling was performed prior to the consumption of the 200 mL bolus, 2 min after each 30 s sprint to determine blood lactate and blood gases, and at 5, 10, 15, 20, 25, and 30 min post-exercise for lactate only. RPE was obtained immediately after each Wingate test, whereas HR and SpO2 were recorded throughout. Peak and average power were calculated for each Wingate test. Reproducibility testing of the 4 × 30 s Wingate test protocol from our laboratory returned a CV of 1.47% and 2.93% for average and peak power, respectively.
Gastrointestinal discomfort questionnaires
At 30 min and 24 h post experimental trials, participants completed Likert scales to quantify severity of gastrointestinal discomfort symptoms (such as nausea, vomiting, bloating, cramping, flatulence, diarrhoea). Symptoms were graded on a 0–5 scale (‘0’ = none, ‘5’ = unbearable), which has been validated in other areas of pain/discomfort research (Bijur et al. Citation2003). Aggregate gastrointestinal discomfort was calculated from the sum of each symptom.
Data analysis
All statistical tests were performed using SAS® version 9.4. Performance was quantified by the time-to-completion of the 16.1-km TT and from power indices in the TT and repeated sprints. Lactate clearance kinetics were quantified during recovery from the TT and repeated sprints by measuring the area under the curve (AUC) and lactate half-life. The latter was determined from the elimination rate constant (κ), calculated from the 7 blood lactate concentrations taken post exercise (5, 10, 15, 20, 25, and 30 min post-exercise) κ = . Where
is the half-life of the drug. All data were initially tested for normal distribution using Shapiro Wilks test. Each response variable, separately for each condition (submaximal, TT, and repeated sprints), was statistically contrasted in a general linear mixed model, with treatment, period, treatment by period and treatment by time interactions as fixed effects, subject as random effects, and baseline as a covariate and time as repeated measure with an unstructured variance covariance matrix. The effect of treatment over the time course, was also determined by statistically contrasting the treatment by time interaction and examining their paired differences. Paired t-tests were performed to determine differences in TT performance (time, power output), lactate clearance kinetics (AUC, half-life) and gastrointestinal discomfort between O2 and PLA trials. Between treatment effects sizes (d) for improvements in performance were calculated by dividing mean difference by pooled SD and were interpreted as trivial (≤0.20), small (0.20–0.49), moderate (0.50–0.79) or large (≥0.80) (Cohen, Citation1988). The statistical significance was evaluated at 5% level. Data are reported as mean ± SD.
Results
Participant disposition, drop out, and randomization
Eleven participants were enrolled to ensure 9 participants completed the study as planned. One participant withdrew from the study after the familiarization visit due to time constraints. Ten participants completed each experimental trial separated by 4 ± 1 days. In total, 3 participants were unable to complete the 4th Wingate test due to gastrointestinal discomfort induced by the preceding maximal efforts (n = 1, O2; n = 2, PLA). All other variables are complete data sets (n = 10). No significant differences were observed for baseline measures and no period effect observed (p > 0.05), confirming the effectiveness of order randomization.
Steady state exercise responses
Exported SRM data files indicate that SS cycling was performed at 59.7 ± 0.9% of VO2peak. VO2 and VCO2 increased and remained elevated above baseline after 5 min of SS cycling (p = 0.04, p = 0.002, respectively), but no treatment effects were observed (p > 0.05). Time-course responses of blood lactate, HR and RPE and blood gases are shown in and Supplemental Table 1, respectively. No treatment or interaction effects were observed for any of these physiological variables during SS cycling (p > 0.05).
Table 1. Blood lactate, HR and RPE (mean ± SD) at baseline and during 30 min SS cycling after consuming the placebo (PLA) and oxygen-encapsulated (O2) beverages.
16.1-km time trial performance
Mean and individual 16.1-km TT completion times are displayed in , whereas the accompanying power output profiles are shown in . There was no difference in time-to-completion for the 16.1-km TT between familiarization and PLA (p > 0.05). Time-to-completion was 2.4% faster after O2 compared with PLA (26.1 ± 1.6 min vs. 26.8 ± 1.8 min, 95% CI = 0.7–4.0%, p = 0.01, d = 0.41). Average power output during the 16.1-km TT was also 4.1% greater for O2 compared with PLA (252 ± 34 W vs. 242 ± 38 W, 95% CI = 2.1-7.3%, p = 0.006, d = 0.28). In total, 9 of the 10 participants reported improvements in average power output greater than the CV (1.40%) for O2 vs. PLA.
Final blood lactate concentration at the end of the 16.1-km TT was 7.5 ± 2.7 mmol·L−1 vs. 6.4 ± 2.8 mmol·L−1 for O2 and PLA, respectively (p > 0.05). Blood lactate concentration returned toward baseline during the 30 min recovery period (p < 0.001, ), but no treatment effect (p = 0.38) or interaction effect (p = 0.56) was observed. There was no differences in lactate AUC (122 ± 50 mmol·min−1 vs. 108 ± 52 mmol·min−1, p = 0.33) or half-life (17.1 ± 2.9 min vs. 18.4 ± 6.0 min, p = 0.32) between O2 and PLA.
Blood pH, PCO2, [HCO3−], and TCO2 increased during the 30 min recovery period following the 16.1-km TT (p < 0.05, ), but no treatment effects were observed (p > 0.05). PO2 and O2 saturation decreased during the 30 min recovery period (p < 0.001, ), but no treatment effects were observed (p > 0.05).
Figure 1. A–B Mean time-to-completion (A) and power output (B) during the 16.1-km time trial (O2 – white box; PLA – grey box) (n = 10). data presented as mean bar and individual responses to experimental beverages. * denotes a difference between O2 and PLA (p < 0.05).
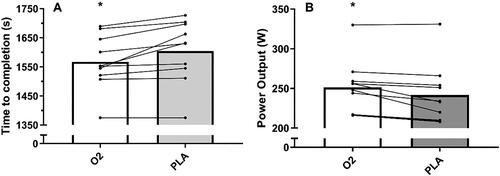
Figure 2. A–F Time-course changes in blood lactate (a), pH (B), PO2 (C), [HCO3−] (D), PCO2 (E), and TCO2 (F) following 16.1-km time trial (O2 – white circles; PLA – black squares) (n = 10). data presented as mean ± SD.
![Figure 2. A–F Time-course changes in blood lactate (a), pH (B), PO2 (C), [HCO3−] (D), PCO2 (E), and TCO2 (F) following 16.1-km time trial (O2 – white circles; PLA – black squares) (n = 10). data presented as mean ± SD.](/cms/asset/1915d400-00bb-40ec-8bb6-512930c51cd8/ijds_a_2203738_f0002_b.jpg)
Repeated sprint performance
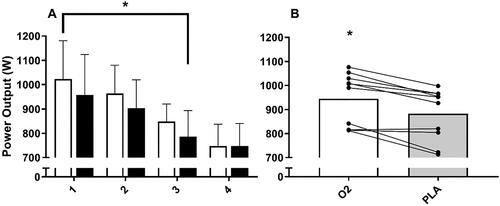
Peak and average power output declined over the 4 × 30 s Wingates (p < 0.001, ), but no condition (p = 0.19, p = 0.61) or interaction (p = 0.87, p = 0.57) effects were observed. Since some participants were unable to complete the 4th sprint, post-hoc analysis conducted on Wingates 1, 2 and 3 (n = 10) revealed that the O2 beverage increased average peak power by 7.1% compared with PLA (945 ± 110 W vs. 882 ± 108 W, p = 0.002, d = 0.58; ). Average power during these 3 Wingates also increased by 2.3% for O2 compared with PLA (639 ± 50 W vs. 624 ± 50 W, p = 0.014; d = 0.30).
Figure 3. A–B Average peak power over all repeated sprints (A) (O2 – white box; PLA - black box) and average peak power over the first three sprints (B) (O2 – white box; PLA - black box) (n = 10). data presented as mean bar and individual responses to experimental beverages. * denotes a difference between O2 and PLA (p < 0.05).
Time-course responses of blood gases and lactate are shown in Supplemental Table 2. Blood lactate concentration increased after each 30 s Wingate (p < 0.05), but no treatment effects were observed (p > 0.05). Peak blood lactate concentration after the 4 × 30 s Wingates was not different between O2 and PLA (17.7 ± 2.8 mmol·L−1 vs. 17.4 ± 2.3 mmol·L−1, p > 0.05). Lactate returned toward baseline during the 30 min recovery period (p < 0.001), but there was no difference between O2 and PLA (p > 0.05). Blood pH, PCO2, HCO3, and TCO2 decreased during the 4 × 30 s Wingates (p < 0.001), however no treatment effects were reported (p > 0.05). PO2 increased during the 4 × 30 s Wingates (p < 0.001), but there was no difference between O2 and PLA (p > 0.05). There was no change in SpO2 across the 4 × 30 s Wingates (p > 0.05).
Gastrointestinal distress symptoms
After completing the 16.1-km cycling TT, no differences in gastrointestinal discomfort severity were reported between O2 and PLA at 30 min (0.6 ± 0.5 vs. 1.0 ± 1.2) and 24 h (0.4 ± 0.5 vs. 0.7 ± 1.5) post-exercise (p > 0.05). Similarly, following the 4 × 30 s Wingate tests, no differences in gastrointestinal discomfort severity were observed between O2 and PLA at 30 min (4.2 ± 2.2 vs. 3.8 ± 5.1) and 24 h (0.9 ± 1.9 vs. 0.9 ± 1.9) post-exercise (p > 0.05).
Discussion
Performance in competitive cycling events is largely determined by the potential for oxidative energy provision in active muscles, but also the ability to generate a relatively high-power output during decisive stages of the race (Baron et al. Citation1999). Consequently, the present study not only investigated the effects of an oxygen-nanobubble beverage on performance during SS and 16.1-km TT cycling, but also repeated sprint performance which has been overlooked in prior studies. This is the first study to have demonstrated improved performance with the consumption of an oxygen-nanobubble beverage by enhancing 16.1-km TT and repeated sprint performance. The magnitude of this ergogenic benefit on time-to-completion (2.4%) and average power output (4.1%) during the TT were greater than the smallest worthwhile change in performance for road time-trial cyclists (∼0.6% and 1.0%, respectively) (Paton and Hopkins Citation2006; Paton and Hopkins Citation2001). Furthermore, 9 of 10 participants reported an improvement in average power output higher than the day-to-day variations of our reproducibility investigations (1.4%). Since we also observed no differences in gastrointestinal discomfort between treatments, our results suggest that the oxygen-nanobubble beverage may provide a practical and effective ergogenic aid for competitive cyclists.
To date, only a small number of studies have looked at the effect of oxygen-enriched beverages on cycling or running TT performance with no significant improvements reported (Wing-Gaia et al. Citation2005; McNaughton et al. Citation2007; Fleming et al. Citation2017). Contrary to these findings, the present study reports significant improvements in time-to-completion and average power output during the 16.1-km TT for O2 compared with PLA. This may be a consequence of the oxygen-encapsulation method used in the current study, resulting in greater oxygen solubility than previously tested drinks (Owen et al. Citation2016, Citation2022). However, we did not observe an increase in PO2 in the O2 trials, which would be expected to support this hypothesis. This could be due to the insensitivity of our measures, given the recognized error in predicting arterial PO2 from capillary blood samples. Even so, a distinct elevation in PO2 does not necessary lead to a significant increase in arterial oxygen carrying capacity given that hemoglobin saturation is high (> 96%) at sea level and the amount of oxygen dissolved in plasma is relatively low (∼1.5%).
Previous research has also involved the consumption of smaller volumes of oxygen-enriched drinks when compared to the current investigation (a total of 500 mL over ∼30 min). For instance, Wing-Gaia et al. (Citation2005) provided 160 mL over ∼30 min of exercise, Fleming et al. (Citation2017) provided only 35 mL across ∼30 min, whereas McNaughton et al. (Citation2007) administered 15 mL of oxygen-enriched water. However, the difference in dose is unlikely to fully account for our results, as participants still ingested a very small amount of oxygen in the beverage (∼15 mL, Supplemental Figures 1 and 2) compared to the volume of oxygen consumed during the 16.1-km TT (estimated in the region of ∼80 L). It is possible that a greater quantity of oxygen may be delivered to the tissue than initially encapsulated in the consumed dose if the lecithin coated bubbles contained in the beverage act as oxygen carriers (Owen et al. Citation2022), much like how perfluorocarbon nanodroplets are reported to function as blood substitutes (Riess Citation2005). Further research should investigate the bioavailability of these oxygen-loaded nanobubbles before it is possible to confirm this hypothesis and better understand potential mechanism of actions.
This is the first study to demonstrate that the ingestion of an oxygen-nanobubble beverage can improve maximal-intensity repeated sprint performance. We observed significant increases in peak power (∼7.1%) and average power (2.3%) during 3 × 30 s Wingate tests interspersed with 4 min of recovery. Given the greater power output, we would expect to see higher blood lactate concentration (and metabolic acidosis), reflecting increased glycolytic activity and anaerobic metabolism (Mendez-Villanueva et al. Citation2012). Therefore, it was surprising that no differences between trials for blood gas and lactate were observed. Fleming et al. (Citation2017) reported significantly lower blood lactate half-life and AUC data during recovery when participants consumed an oxygen-enriched solution immediately after, and 15 min after, exercise cessation. However, in the present study, lactate concentrations and AUC response were similar between trials when O2 beverages were consumed immediately after completion of the 16.1-km TT and 4 × 30 s Wingate tests. The effect of timing and dosage of oxygen-enriched water in relation to post-exercise recovery should be investigated in future research.
Our observations that the O2 beverage did not affect the physiological response to a constant submaximal workload are in agreement with previous findings for oxygen-enriched water (Mielke et al. Citation2005; McNaughton et al. Citation2007). Consumption of the O2 beverage did not reduce the VO2 cost of submaximal exercise at 60% VO2peak, which suggests no change in skeletal muscle contractile efficiency (adenosine triphosphate cost of muscle contraction) and/or mitochondrial respiration (adenosine triphosphate produced per mole of O2 used). It is likely that any changes in arterial oxygen content (although undetected in this study) were met by proportional changes in muscle blood flow to control oxygen delivery (Saltin et al. Citation1998). However, there was no detectable change in HR and likewise ventilatory volume were similar between treatments, suggesting no alternations in cardiorespiratory cost of oxygen transport. Furthermore, there were no differences in measures of capillary blood gases and lactate, which is somewhat surprising considering participants were able to sustain greater average power output during the 16.1-km TT after the O2 beverage. No physiological measurements were collected during the TT to limit distractions and ensure ecological validity, so we are unable to quantify the VO2 cost of the work completed. However, using calculations from baseline cardiopulmonary exercise testing we estimate that participants were cycling at ∼73% VO2peak during the TT. Peak blood lactate concentration at the end of the TT confirms that cyclists were exercising at a higher intensity relative to the SS protocol (where physiological measures were obtained) and potentially at the boundary of the heavy-severe intensity exercise domain (Jones et al. Citation2019). Vascular control differs at intensities above critical power (Poole et al. Citation2016). Severe intensity exercise tolerance is improved by hyperoxia (Amann et al. Citation2006), likely due to enhanced blood-myocyte oxygen diffusion and raised intramyocyte PO2. Although the latter is unconfirmed in the present study, previous research has demonstrated that tumor tissue oxygen levels can be increased following oral administration of the same stabilized oxygen nanobubbles in mice (Owen et al. Citation2016). Neuronal nitric-oxide synthase (nNOS) derived nitric oxide (NO) plays a commanding role in regulating blood flow to type II muscle fibers, which are preferentially recruited at work rates above critical power (Copp et al. Citation2013; Poole et al. Citation2016). Given that enzymatic production of NO requires oxygen as a co-substrate (Babu et al. Citation1999) and the Km for nNOS is high (∼350 µM O2), increasing intramyocyte PO2 may increase the production of NO (Hickok et al. Citation2013) and help to elevate blood flow and oxygen delivery to these muscles. This may explain, in part, why we have observed improved exercise performance in the severe intensity domain.
Limitations and future research suggestions
There are methodological limitations from this study that need to be considered when interpreting results and should be addressed in the future. Firstly, we did not evaluate the success of our double-blind design, therefore, changes in performance might be somewhat attributed to participants’ expectancy of positive outcomes from their belief that they successfully identified the O2 beverage (Hurst et al. Citation2020). Whilst there were no notable differences in taste, texture or appearance of the O2 and PLA beverages, we should have assessed blinding via treatment allocation questionnaires to determine whether participant biases influenced results (Schulz and Grimes Citation2002). Secondly, we were unable to measure skeletal muscle oxygenation and blood flow. This can be estimated through near-infrared spectroscopy with venous occlusion (Tran et al. Citation1999; Boushel and Piantadosi Citation2000). Further research is warranted using such methods to determine if ingesting an oxygen-nanobubble beverage affects the physiological control during more sustained vigorous exercise intensities (∼75% VO2peak) exercise. Lastly, whilst participants were classified as competitive cyclists based on physiological response and training history (De Pauw et al. Citation2013; Priego Quesada et al. Citation2018), it was noted that they were heterogenous in their true cycling performance. More specific performance indicators such as weight-relative power at peak workload and lactate threshold may be better suited for classifying participants than VO2peak and training history.
Conclusion
This study investigated the acute performance and physiological responses to submaximal and repeated sprint cycling following ingestion of an oxygen-nanobubble beverage. Our findings demonstrate significant and practically meaningful improvements in 16.1-km TT completion time and repeated sprint performance in competitive cyclists. Consumption of the oxygen-nanobubble beverage may elicit small performance benefits for athletes performing sustained vigorous efforts, as well as repeated bouts of high intensity exercise, but further research is required to clarify physiological mechanisms underlying these ergogenic effects.
Author’s contributions
Conceptualization, David G. King and Julie Hunt; Methodology, David G. King and Julie Hunt; Formal Analysis, David G. King, Jeewaka Mendis, William H. Gurton and Julie Hunt; Investigation, David G. King, William H. Gurton, Heather Macrae and Louise Jones; Resources, David G. King, Eleanor Stride and Julie Hunt. Writing – Original Draft, David G. King, Eleanor Stride and Julie Hunt; Writing – Review & Editing, David G. King, Eleanor Stride, Jeewaka Mendis, William H. Gurton, Heather Macrae, Louise Jones and Julie Hunt.
Supplemental Material
Download Zip (109.7 KB)Acknowledgements
The authors would like to thank all of the participants for their time and effort during the study.
Disclosure statement
The authors have no conflicts of no interests to declare. The authors alone are responsible for the content and writing of the article.
Additional information
Funding
References
- Amann M, Romer LM, Pegelow DF, Jacques AJ, Hess CJ, Dempsey JA. 2006. Effects of arterial oxygen content on peripheral locomotor muscle fatigue. J Appl Physiol (1985). 101(1):119–127. doi:10.1152/japplphysiol.01596.2005.
- Babu BR, Frey C, Griffith OW. 1999. l-arginine binding to nitric-oxide synthase: the role of H-bonds to the nonreactive guanidinium nitrogens. J Biol Chem. 274(36):25218–25226. doi:10.1074/jbc.274.36.25218.
- Baron R, Bachl N, Petschnig R, Tschan H, Smekal G, Pokan R. 1999. Measurement of maximal power output in isokinetic and non-isokinetic cycling. A comparison of two methods. Int J Sports Med. 20(8):532–537. doi:10.1055/s-1999-8839.
- Barr J, Lushkov G, Strauss S, Gurevitch S, Lahat E, Bistritzer T, Klin B, Eshel G. 1996. Peritoneal ventilation in rabbits: augmentation of gas exchange with cisapride. Thorax. 51(1):82–86. doi:10.1136/thx.51.1.82.
- Bijur PE, Latimer CT, Gallagher EJ. 2003. Validation of a verbally administered numerical rating scale of acute pain for use in the emergency department. Acad Emerg Med. 10(4):390–392. doi:10.1111/j.1553-2712.2003.tb01355.x.
- Boushel R, Piantadosi CA. 2000. Near‐infrared spectroscopy for monitoring muscle oxygenation. Acta Physiol Scand. 168(4):615–622. doi:10.1046/j.1365-201x.2000.00713.x.
- Cohen J. 1988. Statistical Power Analysis for the Behavioral Sciences, Routledge Academic.
- Cooper EA, Smith H, Pask EA. 1995. On the efficiency of intragastric oxygen. Anaesthesia. 50(6):535–544. doi:10.1111/j.1365-2044.1995.tb06048.x.
- Copp SW, Holdsworth CT, Ferguson SK, Hirai DM, Poole DC, Musch TI. 2013. Muscle fibre‐type dependence of neuronal nitric oxide synthase‐mediated vascular control in the rat during high speed treadmill running. J Physiol. 591(11):2885–2896. doi:10.1113/jphysiol.2013.251082.
- Dascombe BJ, Reaburn PRJ, Sirotic AC, Coutts AJ. 2007. The reliability of the i-STAT clinical portable analyser. J Sci Med Sport. 10(3):135–140. doi:10.1016/j.jsams.2006.05.023.
- De Pauw K, Roelands B, Cheung SS, De Geus B, Rietjens G, Meeusen R. 2013. Guidelines to classify subject groups in sport-science research. Int J Sports Physiol Perform. 8(2):111–122. doi:10.1123/ijspp.8.2.111.
- Eisenbrey JR, Albala L, Kramer MR, Daroshefski N, Brown D, Liu J-B, Stanczak M, O’Kane P, Forsberg F, Wheatley MA. 2015. Development of an ultrasound sensitive oxygen carrier for oxygen delivery to hypoxic tissue. Int J Pharm. 478(1):361–367. doi:10.1016/j.ijpharm.2014.11.023.
- Fleming N, Vaughan J, Feeback M. 2017. Ingestion of oxygenated water enhances lactate clearance kinetics in trained runners. J Int Soc Sports Nutr. 14(1):9–7. doi:10.1186/s12970-017-0166-y.
- Forth W, Adam O. 2001. Uptake of oxygen from the intestine–experiments with rabbits. Eur J Med Res. 6(11):488–492. PMID: 11726308
- Haldane JS. 1912. Methods of air analysis. Philadelphia: Charles Griffin & Co Ltd., JB Lippincott Co.;
- Hampson NB, Pollock NW, Piantadosi CA. 2003. Oxygenated water and athletic performance. JAMA. 290(18):2408-b–2409. doi:10.1001/jama.290.18.2408-a.
- Hickok JR, Vasudevan D, Jablonski K, Thomas DD. 2013. Oxygen dependence of nitric oxide-mediated signalling. Redox Biol. 1(1):203–209. doi:10.1016/j.redox.2012.11.002.
- Hurst P, Schipof-Godart L, Szabo A, Raglin J, Hettinga F, Roelands B, Lane A, Foad A, Coleman D, Beedie C. 2020. The placebo and nocebo effect on sports performance: a systematic review. Eur J Sport Sci. 20(3):279–292. doi:10.1080/17461391.2019.1655098.
- Jones AM, Burnley M, Black MI, Poole DC, Vanhatalo A. 2019. The maximal metabolic steady state: redefining the ‘gold standard. Physiol Rep. 7(10):e14098. doi:10.14814/phy2.14098.
- Klug W, Knoch HG, Müller A. 1988. Oxygen partial pressure after rectal oxygen insufflation–experimental animal studies. Z Exp Chir Transplant Kunstliche Organe. 21(4):222–226. PMID3176591
- Kwan JJ, Kaya M, Borden MA, Dayton PA. 2012. Theranostic oxygen delivery using ultrasound and microbubbles. Theranostics. 2(12):1174–1184. doi:10.7150/thno.4410.
- Leibetseder V, Strauss-Blasche G, Marktl W, Ekmekcioglu C. 2006. Does oxygenated water support aerobic performance and lactate kinetics? Int J Sports Med. 27(3):232–235. doi:10.1055/s-2005-865633.
- Mahjour A, Khazaei M, Nourmohammadi E, Khoshdel‐Sarkarizi H, Ebrahimzadeh‐Bideskan A, Rahimi HR, Safipour Afshar A. 2019. Evaluation of antitumor effect of oxygen nanobubble water on breast cancer‐bearing BALB/c mice. J Cell Biochem. 120(9):15546–15552. doi:10.1002/jcb.28821.
- McEwan C, Owen J, Stride E, Fowley C, Nesbitt H, Cochrane D, Coussios CC, Borden M, Nomikou N, McHale AP, et al. 2015. Oxygen carrying microbubbles for enhanced sonodynamic therapy of hypoxic tumours. J Control Release. 203:51–56. doi:10.1016/j.jconrel.2015.02.004.
- McNaughton LR, Kenney S, Siegler J, Midgley AW, Lovell RJ, Bentley DJ. 2007. The effect of superoxygenated water on blood gases, lactate, and aerobic cycling performance. Int J Sports Physiol Perform. 2(4):377–385. doi:10.1123/ijspp.2.4.377.
- Mendez-Villanueva A, Edge J, Suriano R, Hamer P, Bishop D. 2012. The recovery of repeated-sprint exercise is associated with PCr resynthesis, while muscle pH and EMG amplitude remain depressed. PLoS One. 7(12):e51977. doi:10.1371/journal.pone.0051977.
- Mielke M, Kroy JO, Torok D, Zoeller R. 2005. Oxygenated Water Does Not Improve Endurance Exercise Performance: 228: Board# 135: 9: 30 AM–11: 00 AM. Med Sci Sports Exerc. 37(Suppl):S42–S43. doi:10.1249/00005768-200505001-00227.
- Monedero J, Donne B. 2000. Effect of recovery interventions on lactate removal and subsequent performance. Int J Sports Med. 21(8):593–597. doi:10.1055/s-2000-8488.
- Nakazawa MS, Keith B, Simon MC. 2016. Oxygen availability and metabolic adaptations. Nat Rev Cancer. 16(10):663–673. doi:10.1038/nrc.2016.84.
- Nestle N, Wunderlich A, Nüssle-Kügele K. 2004. In vivo observation of oxygen-supersaturated water in the human mouth and stomach. Magn Reson Imaging. 22(4):551–556. doi:10.1016/j.mri.2004.01.040.
- Owen J, McEwan C, Nesbitt H, Bovornchutichai P, Averre R, Borden M, McHale AP, Callan JF, Stride E. 2016. Reducing tumour hypoxia via oral administration of oxygen nanobubbles. PLoS One. 11(12):e0168088. doi:10.1371/journal.pone.0168088.
- Owen, Joshua, Logan, Keiran, Nesbitt, Heather, Able, Sarah, Vasilyeva, Alexandra, Bluemke, Emma, Kersemans, Veerle, Smart, Sean, Vallis, Katherine A., McHale, Anthony P., Callan, John F.,2022. Orally administered oxygen nanobubbles enhance tumor response to sonodynamic therapy. Nano Select, 3(2):394–401. doi:10.1002/nano.202100038.
- Ozkaya O, Balci GA, As H, Vardarli E. 2018. The test-retest reliability of new generation power indices of Wingate all-out test. Sports. 6(2):31. doi:10.3390/sports6020031.
- Paton CD, Hopkins WG. 2001. Tests of cycling performance. Sports Med. 31(7):489–496. doi:10.2165/00007256-200131070-00004.
- Paton CD, Hopkins WG. 2006. Variation in performance of elite cyclists from race to race. Eur J Sport Sci. 6(1):25–31. doi:10.1080/17461390500422796.
- Piantadosi CA. 2006. “Oxygenated” water and athletic performance. Br J Sports Med. 40(9):740–741. doi:10.1136/bjsm.2006.028936.
- Poole DC, Burnley M, Vanhatalo A, Rossiter HB, Jones AM. 2016. Critical power: an important fatigue threshold in exercise physiology. Med Sci Sports Exerc. 48(11):2320–2334. doi:10.1249/MSS.0000000000000939.
- Reilly T. 1990. Human circadian rhythms and exercise. Crit Rev Biomed Eng. 18(3):165–180. PMID: 2286092
- Priego Quesada JI, Kerr ZY, Bertucci WM, Carpes FP. 2018. The categorization of amateur cyclists as research participants: findings from an observational study. J Sports Sci. 36(17):2018–2024. doi:10.1080/02640414.2018.1432239.
- Riess JG. 2005. Understanding the fundamentals of perfluorocarbons and perfluorocarbon emulsions relevant to in vivo oxygen delivery. Artif Cells Blood Substit Immobil Biotechnol. 33(1):47–63. doi:10.1081/bio-200046659.
- Saltin B, Rådegran G, Koskolou MD, Roach RC. 1998. Skeletal muscle blood flow in humans and its regulation during exercise. Acta Physiol Scand. 162(3):421–436. doi:10.1046/j.1365-201X.1998.0293e.x.
- Sawka MN, Burke LM, Eichner ER, Maughan RJ, Montain SJ, Stachenfeld NS, American College of Sports Medicine. 2007. American College of Sports Medicine position stand. Exercise and fluid replacement. Med Sci Sports Exerc. 39(2):377–390. doi:10.1249/mss.0b013e31802ca597.
- Schulz KF, Grimes DA. 2002. Blinding in randomised trials: hiding who got what. Lancet. 359(9307):696–700. doi:10.1016/S0140-6736(02)07816-9.
- Sparks AS, Williams EL, Jones HJ, Bridge CA, Marchant D, McNaughton L. 2016. Test-retest reliability of a 16.1 km time trial in trained cyclists using the CompuTrainer ergometer. Journal of Science and Cycling. 5(3):35–41.
- Tran TK, Sailasuta N, Kreutzer U, Hurd R, Chung Y, Mole P, Kuno S, Jue T. 1999. Comparative analysis of NMR and NIRS measurements of intracellular PO2 in human skeletal muscle. Am J Physiol. 276(6):R1682–R1690. doi:10.1152/ajpregu.1999.276.6.R1682.
- Wing SL, Askew EW, Luetkemeier MJ, Ryujin DT, Kamimori GH, Grissom CK. 2003. Lack of effect of Rhodiola or oxygenated water supplementation on hypoxemia and oxidative stress. Wilderness Environ Med. 14(1):9–16. doi:10.1580/1080-6032(2003)014[0009:LOEORO.2.0.CO;2
- Wing-Gaia SL, Subudhi AW, Askew EW. 2005. Effects of purified oxygenated water on exercise performance during acute hypoxic exposure. Int J Sport Nutr Exerc Metab. 15(6):680–688. doi:10.1123/ijsnem.15.6.680.
- Wilmert N, Porcari JP, Doberstein S, Brice G. 2002. The effects of oxygenated water on exercise physiology during incremental exercise and recovery. J Exerc Physiol Online. 5(4):pp16–21.
- World Health Organisation. 2010. WHO Guidelines on Drawing Blood: Best Practices in Phlebotomy. Geneva: World Health Organization press.
- Zavorsky GS, Cao J, Mayo NE, Gabbay R, Murias JM. 2007. Arterial versus capillary blood gases: a meta-analysis. Respir Physiol Neurobiol. 155(3):268–279. doi:10.1016/j.resp.2006.07.002.