
 ?Mathematical formulae have been encoded as MathML and are displayed in this HTML version using MathJax in order to improve their display. Uncheck the box to turn MathJax off. This feature requires Javascript. Click on a formula to zoom.
Abstract
This study investigated if paraxanthine (PX) impacts energy expenditure, lipolysis and perceptual responses. In a randomized, double-blind, placebo-controlled, crossover fashion, 21 adults (13 M, 8 F; 26.0 ± 6.4 years, 174.9 ± 11.5 cm, 81.0 ± 15.7 kg body mass, 26.3 ± 3.4 kg/m2) consumed a placebo (PLA), 100 mg (PX100), 200 mg (PX200), and 300 mg of PX (PX300, enfinity®, Ingenious Ingredients, L.P. Lewisville, TX, USA). Venous blood was collected 0, 30, 60, 90, 120 and 180 min (min) after ingestion and analyzed for glycerol and free fatty acids. Resting hemodynamics, metabolic rate and perceptual indicators of hunger, appetite and anxiety were evaluated. Mixed factorial analysis of variance were used to evaluate changes time within and between groups. Heart rate decreased in PX100 compared to PLA 60 (p = .022) and 180 min (p = .001). Blood pressure did not change. Hunger ratings in PLA increased 30 (p = .05), 60 (p = .04), 90 (p = .02), and 180 min (p = .05) after ingestion when compared to PX200. PX200 increased energy expenditure (all p < .05) when compared to PLA. Rates of fat oxidation tended to increase 90 (p = .056) and 120 min (p = .066) in PX200 compared to PLA. Free fatty acids increased in PX300 compared to PLA (p = .002). Glycerol did not change. Ingestion of PX200 augmented energy expenditure and hunger ratings when compared to PLA without impacting hemodynamics or lipolysis.
Introduction
Caffeine (CAF; 1,3,7-trimethylxanthine) consumption exerts multiple effects including increased feelings of energy and alertness, visual tracking, cognition, energy expenditure, lipolysis, and reductions in hunger and appetite (Glade Citation2010; Guest et al. Citation2021). Secondary to these latter outcomes, CAF has been advocated to serve as a weight loss aid for its ability to promote favorable changes in energy balance. CAF stimulates the sympathetic nervous system which works to suppress hunger and decrease appetite thereby reducing energy intake while also increasing energy expenditure, lipolysis, and fat oxidation (Astrup et al. Citation1990; Harpaz et al. Citation2017). However, it takes larger concentrations of CAF to stimulate lipolysis in adipocytes in vitro compared to in vivo indicating that metabolism of CAF fosters development of bioactive components that potentiate its observed outcomes (Winder Citation1986). Furthermore, it also remains possible that a downstream product of CAF metabolism might be responsible for CAF’s lipolytic effects (Winder Citation1986). CAF is metabolized into three primary metabolites: paraxanthine (PX, 1,7-dimethylxanhine), theobromine (3, 7-dimethylxanthine), and theophylline (1, 3-dimethylxanthine) (Stavric Citation1988). Of these three metabolites, approximately 70–72% of CAF is metabolized to PX. When viewed from the perspective of total CAF elimination, PX is responsible for 84% with theobromine and theophylline being responsible for 12% and 4%, respectively (Lelo et al. Citation1986; Begas et al. Citation2007). Beyond these properties, PX has higher binding potencies for adenosine A1 and A2a receptors compared to CAF (Orru et al. Citation2013). In addition, Hetzler et al. (Hetzler et al. Citation1990) administered a CAF dose of 4 mg/kg and collected venous blood samples in a detailed time course spanning 180 min after ingestion and identified a high positive correlation between the appearance of PX and free fatty acids (FFA). Alternatively, a high negative correlation was observed between CAF and FFA levels in the blood leading the authors to conclude that PX may play a role in lipolysis after CAF administration (Hetzler et al. Citation1990).
While much less work has been completed on directly studying the impact of these CAF metabolites, toxicity investigations have highlighted that some of the known side effects of CAF (ie habituation, withdrawal, etc.) may be due in large part to some of the other CAF metabolites (Stavric Citation1988). In addition, genetic inquiry into CAF metabolism has established that individuals typically exhibit one of three genotypes of the CYP1A2 gene. This gene exerts control over the production of cytochrome P450, a liver enzyme that is largely responsible for CAF metabolism (Nelson et al. Citation2004). As such, the genotype inherited by an individual can impact the speed upon which someone metabolizes CAF, which can further go on to impact the observed half-life, ergogenic potential (Womack et al. Citation2012; Guest et al. Citation2018; Rahimi Citation2019), and even the propensity whereby someone may experience some of the untoward outcomes associated with CAF use (Cornelis et al. Citation2006; Palatini et al. Citation2009; Soares et al. Citation2018).
In consideration of these findings and in conjunction with the popularity of CAF and that a large majority of CAF metabolism yields PX, more research is warranted to establish any potential efficacy for PX administration. Currently, research on PX administration is limited to outcomes related to its ability to aid in cognitive efforts. In this respect, previous research by Xing et al. (Xing et al. Citation2021) and Yoo et al. (Yoo et al. Citation2021) have reported that acute PX administration positively impacts attention, some measures of cognitive function, and short-term working memory. While the work of Hetzler et al. (Hetzler et al. Citation1990) established the role of PX in the regulation of lipolysis after CAF administration, no research has examined the potential for lipolysis to be impacted by PX administration. Therefore, the purpose of the present study was to investigate if PX has effects independent of CAF on energy expenditure, lipolysis and subjective feelings of hunger and appetite and other perceptual measures.
Methods
Experimental design
The study was conducted using a randomized, double-blind, placebo (PLA)-controlled, crossover study design. Healthy males and females (13 M, 8 F) between the ages of 18–39 years of age were recruited to participate in this study. All participants signed an Institutional Review Board (IRB)-approved (Lindenwood University IRB #: IRB-22-30, approval date: November 15, 2021) informed consent document which conformed to the standards set by the latest revision of the Declaration of Helsinki. This study was retrospectively registered on March 31, 2023, at ClinicalTrials.gov as NCT05811923
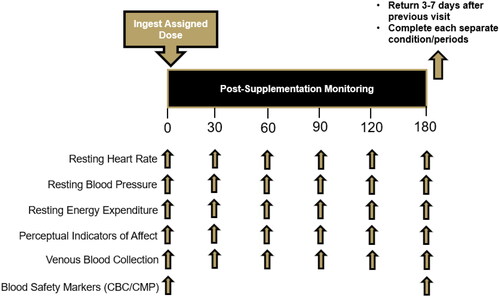
(https://clinicaltrials.gov/ct2/show/NCT05811923). Participants completed a health history questionnaire to finalize eligibility. All participants reported to the laboratory for all study visits between 0600 and 1000 h and were required to abstain from exercise, tobacco, nicotine, and alcohol for 24 h and observe an overnight (8–10 h) fast including CAF consumption. Study visit 1 was a screening visit where participants provided informed consent and completed a medical history in addition to having their height and weight assessed along with their resting heart rate and blood pressure. Prior to their second study visit, participants recorded their food and fluid intake for three days and were then instructed to replicate their food and fluid intake prior to each subsequent study visit. During each supplement condition, study participants donated their first of six venous blood samples before completing a series of visual analog scales (VAS) that assessed various perceptual indicators. After completion of these assessments, participants then had their resting metabolic rate assessed and completed VAS to evaluate perceptual responses to PX ingestion. Participants were assigned in a randomized, double-blind, PLA-controlled, crossover fashion to ingest one of four supplement conditions: a non-energetic PLA (maltodextrin) and a 100 mg (PX100), 200 mg (PX200), and 300 mg dose of PX (PX300, enfinity®, Ingenious Ingredients, L.P. Lewisville, TX, USA). The order of administration for all interventions was randomized using a random allocation software. After ingestion of their assigned supplement, a timer was started, and participants repeated all assessments 30, 60, 90, 120, and 180 min after ingestion of their assigned supplement. At least 72 h of rest was observed between each condition after all dietary and exercise adherence had been observed. provides an overview of the testing and study design.
Figure 1. Schematic overview of research design.
Study participants
21 healthy adults (13 M, 8 F; 26.0 ± 6.4 years, 174.9 ± 11.5 cm, 81.0 ± 15.7 kg body mass, 26.3 ± 3.4 kg/m2) between the ages of 18–39 years, who reported at least 30 min of moderate exercise three days per week were recruited for this study (). Sample size for this project was designed in large part by mirroring the work of Astrup et al. (Astrup et al. Citation1990). Participant flow through the study is illustrated in the CONSORT diagram (). Participants were required to abstain from taking any additional forms of nutritional supplementation (pre-workouts, creatine, beta-alanine, thermogenic supplements, etc.) for four weeks prior to beginning this study and throughout the study. Additionally, participants could not be currently restricting their energy intake or participating in some form of weight loss program. Participants were excluded if they were (a) outside of the required age range of 18–39 years old, (b) were currently being treated with or diagnosed a cardiac, pulmonary, neurological, metabolic, immunological, musculoskeletal, hepatic, kidney, autoimmune, psychiatric, or hematological disease or condition, (c) were currently taking a prescription or over the counter medicine that was deemed by the principal investigator to conflict with the study outcomes or not be safely tolerated by the study participants, (d) had a body mass index above 30 kg/m2 or below 18 kg/m2, and (e) were determined to be moderate CAF consumers defined as >300 mg CAF per day.
Figure 2. CONSORT flow diagram.
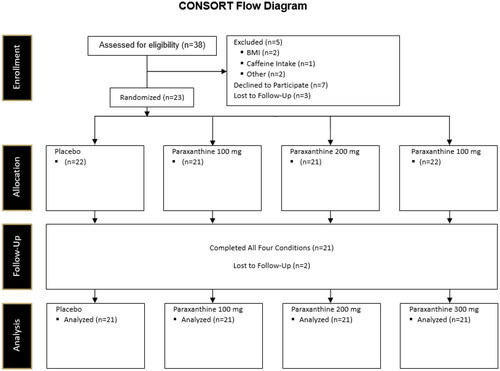
Table 1. Study participant characteristics.
Supplementation protocol
To objectively assess fasting compliance prior to completing any assessments, resting glucose levels were determined using a handheld glucose monitor (CVS Health Advanced Glucose Monitor, Agamatrix, Inc., Salem, NH, USA). Values above 110 mg/dl were deemed as non-fasting samples and participants were rescheduled. Study participants reported 100% compliance to the supplementation protocol. Water intake after supplement ingestion occurred ad libitum.
In a randomized, double-blind, PLA-controlled, crossover manner, one of four supplementation conditions were distributed to all participants. The four supplementation conditions were: PLA, 100 mg PX, 200 mg PX, and 300 mg PX (enfinity®, Ingenious Ingredients, L.P. Lewisville, TX, USA). No other additives or excipients were included. Dosages for this study were established based upon the known metabolism of CAF into PX and other methylxanthines. In this respect, Stavric et al. (Palatini et al. Citation2009) has previously reported that 70–72% of ingested CAF is metabolized to PX. Using this, a 200 mg CAF dose is equivalent to approximately 140 mg PX. Additionally, most of the caffeine literature indicates that CAF dosages of 3–6 mg/kg are needed to achieve many of the known effects of CAF (Guest et al. Citation2021). For humans weighing 70–80 kg, this would equate to CAF doses of 210–480 mg. When a 70% PX conversion rate is applied, a PX dose of 147–336 mg results. Finally, the caffeine content in many products ranges from 60 to 300 mg per serving (Guest et al. Citation2021), which again with a 70% PX conversion rate applied, this equates to 42–210 mg PX. All doses consisted of a single capsule that were identical in shape, color, size, and transparency and were consumed with 8–12 fluid ounces of cold tap water under the direct supervision of a research team member. The ingestion of the supplement was considered as the 0-min time-point and all subsequent measurements occurred as outlined in .
Procedures
Body mass and composition
Measurements of height, body mass, and body fat percentage were taken at the beginning of the first visit. Height was measured using a standardized wall-mounted stadiometer (Tanita HR-200, Tokyo, Japan) and recorded to the nearest ± 0.5 cm. Fat and fat-free mass were determined for descriptive purposes using a bioelectrical impedance analyzer (InBody 570, InBody, Cerritos, California). At the beginning of each study visit, body mass was measured (Tanita WB100A Class III, Tokyo, Japan) and recorded to the nearest ± 0.1 kg upon arrival prior to each study visit. All recorded body masses were compared to ensure participants were weight stable, and any participant whose body mass changed more than 2% between consecutive study visits were excluded from participation. Following body mass measurements, participants then rested in a seated position for 5 min and thereafter heart rate and blood pressure was assessed using an automated blood pressure cuff (Omron BP785, Kyoto, Japan). Two measurements were taken at each timepoint approximately 2–3 min apart during all study visits and averaged.
Dietary protocol
Study participants completed a hand-written three-day food log at the beginning of the study trial. A copy of this food log was made to facilitate the ability of participants to replicate their diet prior to each subsequent visit. Participants completed a 24-h food recall using the ASA24 online dietary assessment tool, for determination of baseline caloric and macronutrient intake (Subar et al. Citation2012). To assist in replicating their food intake the day prior to each testing visit, participants were given prepackaged frozen meals for breakfast, lunch, and dinner (Clean Eatz: https://www.cleaneatzkitchen.com/). All meals contained similar amounts of energy, carbohydrates, fats, and proteins.
Urine specific gravity assessment
Upon arrival to the laboratory (between 0600 and 1000 h) and after observing an overnight fast, participants provided a mid-flow urine sample to assess hydration status using a hand-held refractometer. A small sample (500 μL) of fresh urine was placed on the refractometer and instantly read. A urine specific gravity of <1.020 was used as the criterion threshold to substantiate hydration status (Casa et al. Citation2000). Participants were required to remain in the lab consuming water until their urine specific gravity sample was below 1.020.
Bioelectrical impedance analysis (BIA)
Fat and fat-free mass was determined using an InBody 570 (InBody Co., Ltd., Cerritos, CA, USA) bioelectrical impedance analyzer following an 8-h overnight fast. Prior to testing each visit, the device was calibrated according to manufacturer guidelines and device specifications. Prior to each analysis, participants removed any additional clothing, all metal jewelry, and any other accessories before wiping both hands and both feet clean with cleansing wipes (InBody Tissue; InBody Co., Ltd., Cerritos, CA, USA) provided by the manufacturer before standing erect with both hands and feet in contact with the sensors.
Venous blood collection and processing
To confirm a fasting state prior to catheter insertion and supplement administration, capillary blood was collected from a finger on their non-dominant hand. The collected blood was analyzed using a hand-held glucose analyzer (CVS Health Advanced Glucose Meter, Agamatrix, Inc., Salem, NH, USA) and fasting was confirmed if glucose was < 110 mg/dL. Within each of the four supplementation conditions, study participants’ venous blood was collected at six separate timepoints: 0 min (immediately prior to supplementation), and 30, 60, 90, 120, and 180 min after ingestion of their assigned study product. Blood was collected via an antecubital vein using an intravenous catheter into two ethylenediaminetetraacetic acid coated (EDTA) Vacutainer tubes and two Serum Separator Tubes (SST; both from Becton, Dickinson, and Company, Franklin Lakes, NJ, USA),. Additionally, at the 0- and 180-min timepoint, one extra tube of each type was collected for conducting complete blood count and comprehensive metabolic panel analyses, respectively. To ensure proper sample processing, all collected tubes were gently inverted ten times. Serum samples were allowed to clot at room temperature for 30 min prior to centrifugation. Specifically, EDTA tubes were centrifuged at 1500 g (MegaFuge 8 R, Thermo Fisher Scientific, Waltham, MA, USA) at 4° C for 20 min while SST tubes were centrifuged at 1,500 g (Horizon 6, Drucker Diagnostics, Port Matilda, PA, USA) at room temperature for 15 min. After centrifugation, 600 μL aliquots of plasma and serum were removed and frozen at −80 °C. Immediately after processing, whole blood and serum samples were placed into a room temperature container and sent to a commercial diagnostic laboratory (Quest Diagnostics) the same day as collection. Upon completion of data collection, plasma samples were analyzed for glycerol and free fatty acid determination.
Complete blood count
Whole blood samples were collected in EDTA tubes and analyzed at a commercial diagnostic laboratory (Quest Diagnostics) for changes in red blood cell count, white blood cell count, platelet count, hemoglobin, hematocrit, red blood cell dimension width (RDW), mean corpuscle volume (MCV), mean corpuscle hemoglobin (MCH), mean corpuscle hemoglobin content (MCHC), neutrophil % and cell count, lymphocytes % and cell count, monocytes % and cell count, eosinophils % and cell count, and basophils % and cell count (granulocytes → neutrophils, eosinophils, basophils). Complete blood counts were assessed at the 0 and 180-min time points to evaluate the safety of supplement ingestion.
Comprehensive metabolic panel
Serum samples were collected into SST and assayed at a commercial diagnostic laboratory (Quest Diagnostics) for a comprehensive metabolic panel (albumin, albumin/globulin ratio (calculated), alkaline phosphatase, alanine aminotransferase (ALT), aspartate aminotransferase (AST), blood urea nitrogen (BUN), BUN/creatinine ratio (calculated), calcium, carbon dioxide, chloride, creatinine with estimated GFR, globulin, glucose, potassium, sodium, total bilirubin, and total protein). Comprehensive metabolic panels were assessed at the 0 and 180-min time points to evaluate the safety of supplement ingestion.
Lipolysis markers
Plasma glycerol and free fatty acids were assessed using microplate fluorometric techniques (STA-619, Cell Biolabs, San Diego, CA, USA). Briefly, samples were thawed one time and diluted 1:10 with manufacturer provided assay buffer, which was then further diluted 20X for the assay. All other reagents were prepared according to manufacturer specifications. Standards, blanks, and diluted samples (10 µL) were added along with the enzyme mixture, covered, and incubated at 37 °C for 30 min. After incubation, samples were treated with enzyme mixture, NEM reagent, and fluorometric probe before reading samples at an excitation wavelength of 530–560 nm and emission wavelength of 585–595 nm. All samples were read on a Biotek microplate reader (Biotek, Santa Clara, CA, USA).
Resting metabolic rate determination
Resting metabolic rate measurements were conducted at the beginning of six timepoints (0, 30, 60, 90, 120, and 180 min after supplement ingestion) during each of the four experimental conditions, in a thermoneutral laboratory environment devoid of auditory and visual stimuli. For each assessment, participants rested supine for 15–20 min under a clear, hard plastic canopy with a transparent plastic drape (TrueOne® 2400 Canopy System, ParvoMedics, Sandy, UT, USA) placed over their head and shoulders. The hood was connected to the metabolic cart to collect all expired gases (oxygen and carbon dioxide). All expired gases were analyzed using indirect calorimetry (TrueMax 2400 Metabolic Measurement System, ParvoMedics, Sandy, UT, USA) and computed to determine rates of energy expenditure as well as rates of carbohydrate and fat oxidation according to the calculations of Weir (Weir Citation1949). Each day the metabolic cart was calibrated to within less than 2% of the previous day’s calibration factor. Throughout the assessment, participants were instructed to remain motionless and awake to ensure accurate measurements. The determination of resting metabolic rate within each 15–20 min assessment involved identifying any continuous 5-min segment where oxygen uptake changed by less than 5%. This stable period reflected the participants true resting metabolic rate and was averaged for data analysis. Once the resting metabolic rate assessment was completed for each timepoint, participants completed other data collection procedures and were instructed to limit activity prior to their next assessment.
Visual analog scales
Participants completed electronic VAS that evaluated perceptual responses. Each VAS was constructed similarly with a 100-mm line anchored by ‘Lowest Possible’ and ‘Highest Possible’ to assess subjective ratings and was presented using an electronic tablet. In each instance, the participant touched the screen and moved an indicator on the scale until it was positioned at a point they felt represented their rating for that scale. VAS for hunger, appetite, and anxiety were completed during all study visits.
Statistical analysis
The primary question being asked from this investigation was to evaluate how different doses of PX compared to a placebo. As a result, superiority of one PX dose nor how PX performed in comparison to CAF, other related metabolites, or combinations of them were not a fundamental question being asked by this investigation and all resulting statistical approaches were employed to evaluate differences in the measured outcomes versus placebo. Separate 2 × 6 mixed factorial analysis of variance (ANOVA) with repeated measures on time were the primary statistical analysis completed in this investigation. If a significant group × time interaction was observed, paired sample t-tests were completed to evaluate if statistical differences occurred in comparison to baseline observations. Before any statistical inferences were completed, data were assessed for normality, skewness and kurtosis and all non-normal data were transformed using natural log or square root approaches prior to analysis. Statistical determinations were set at an alpha (p value) of .05 while p values ranging from .055 to .10 are considered statistical trends. All tables and figures have been constructed to highlight main effects of group and time and the interaction between group × time. Change within a single group across the measurement period were evaluated using factorial ANOVA with repeated measures. Statistical significance is reported using both LSD and Bonferroni procedures. The primary outcomes for this study were the changes in energy expenditure and perceptual responses to hunger and appetite. Secondary outcomes included rates of carbohydrate and fat oxidation, plasma concentrations of glycerol and free fatty acids. Safety assessments included perceptual responses of anxiety, hemodynamics, and assessed components of a complete blood count and comprehensive metabolic panel. All data is represented as means ± standard deviation. Area under the curves (AUC) were calculated using the trapezoidal method (EquationEquation 1(1)
(1) ), where C0 is the unknown value at the first time point of interest, C1 is the unknown value at the second time point of interest, and Time1-0 is the total time interval between the two time points when the unknown was measured. These individual AUC values for each time interval were then summed to determine the total AUC (EquationEquation 2
(2)
(2) ). All AUC data were generated using Microsoft Excel (Seattle, WA, USA).
(1)
(1)
(2)
(2)
All analyses were completed using Microsoft Excel and the Statistical Package for the Social Sciences (v23; SPSS Inc., Chicago IL). Figures were generated using GraphPad (Boston, MA)
Results
Pre-supplementation status
In alignment with the crossover protocol, no significant differences in pre-supplementation body mass (p = .95), energy expenditure (p = .48), heart rate (p = .17), systolic blood pressure (p = .54), and diastolic blood pressure (p = .19) were observed.
Protocol compliance
Participants reported 100% compliance with adherence to all pre-study visit requirements. All doses were administered by study investigators; as such, ingestion was directly observed by the research team. In addition, participants initially recorded their dietary intake and then replicated this intake for each subsequent visit. Dietary intake was computed and was found to be: energy = 1822 ± 568 kcals/day; carbohydrate = 105.2 ± 40.1 g/day, protein = 194.3 ± 82.8 g/day, and fat = 69.0 ± 24.2 g/day.
Adverse events
One participant during the PX300 condition reported dizziness, fast (racing) heart rate, lightheadedness, nervousness, and shortness of breath. In all instances, the severity was reported as minor, and all were resolved within 24 h of completing this study condition.
Hemodynamics
A significant group × time interaction for heart rate was observed between PX100 and PLA (p = .05). As seen in and , heart rate reduced to a greater degree in PX100 (when compared to PLA) after 60 min (−6.8 ± 12.5, 95% CI: −12.52, −1.10, p = .022) and 180 min (−5.3 ± 6.0, 95% CI: −8.03, −2.54, p = .001). No significant group × time interaction for PX200 (p = .44) and PX300 (p = .10). Heart rates in PX100 experienced significant decreases (p < .01) in comparison to their baseline levels 60, 90, 120, and 180 min after ingestion. PX200 experienced a significant decrease in heart rate 90 and 120 min after ingestion while PX300 heart rate values were reduced 30 and 90 min after ingestion. No changes from baseline occurred in PLA.
Figure 3. Changes in heart rate from baseline in all supplementation groups. † = p < .05 for the changes in observed in heart rate at the indicated time point from baseline between PX100 and PLA.
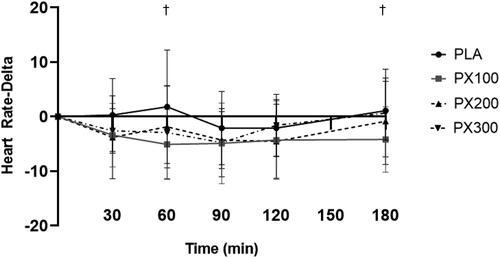
Table 2. Hemodynamic responses.
No group × time interactions were observed for were observed for systolic blood pressure (PX100, p = .50; PX200, p = .95; PX300, p = .63). PX200 experienced increases from its baseline value 90 min after ingestion while PX300 reported increases 30, 60, 90, and 180 min after ingestion. No changes across time were observed in systolic blood pressure for PLA and PX100.
No group × time interactions were observed for were observed for diastolic blood pressure (PX100, p = .27; PX200, p = .19; PX300, p = .08). PLA experienced increases from baseline 30, 120, and 180 min after ingestion while PX300 reported increases 60, 90, 120, and 180 min after ingestion. No changes across time were observed in diastolic blood pressure for PX100 and PX200.
Visual analog scales
contains raw data and AUC scores for hunger, appetite, and anxiety VAS. A significant group × time interaction (p = .05) was observed for hunger VAS scores () between PX200 and PLA. Separate paired samples t-tests indicated significantly greater (p ≤ .05) increases in hunger ratings in PLA when compared to PX200 after 30 min (5.1 ± 10.3; 95% CI: −0.05, 10.2, p = .05), 60 min (7.7 ± 14.7; 95% CI: 0.37, 15.0; p = .04), 90 min (8.9 ± 14.9; 95% CI: 1.5, 16.3, p = .02), and 180 min of ingestion (9.4 ± 19.2; 95% CI: −0.09, 19.0, p = .05) while the differences at 120 min of ingestion tended to be different (7.6 ± 15.8, 95% CI: −0.3, 19.0, p = .06). No group × time interaction was observed between PLA and PX100 (p = .16) and PX300 (p = .08). Hunger VAS ratings for PLA and PX100 significantly increased from their respective baseline values 30, 60, 90, 120, and 180 min after ingestion while PX300 increased 180 min after ingestion. Hunger VAS ratings in PX200 reported no statistically significant changes from baseline.
Figure 4. Hunger VAS change from baseline. ‡ = PX200 change from baseline (0 min) is different (p < .05) than change in PLA at designated time point. Determined using paired samples t-test after observing significant group × time interaction using 2 × 6 mixed factorial ANOVA with repeated measures on time.
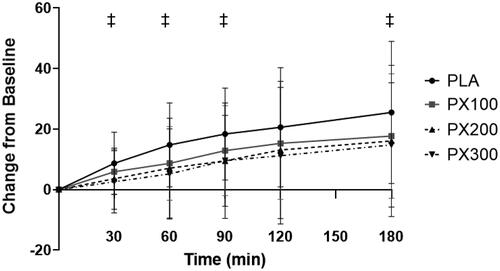
Table 3. Hunger, appetite, and anxiety Visual Analog Scale (VAS) values.
No significant group × time interactions were observed for appetite VAS at any PX dose (PX 100: p = .65, PX 200: p = .61, and PX 300: p = .53). Appetite VAS ratings for PLA and PX200 were increased 90, 120, and 180 min from baseline while PX100 reported increased 120 and 180 min after ingestion. Appetite VAS ratings in PX300 did not change from baseline.
No significant group × time interactions were observed for anxiety VAS at any PX dose (PX 100: p = .56, PX 200: p = .69, and PX 300: p = .53) at any PX dose. Anxiety VAS ratings in all groups did not change from baseline.
Energy expenditure
contains energy expenditure, rate of fat oxidation, free fatty acids, and glycerol data. When expressed in calories expended per day, a significant group × time interaction (p = .04) between PX200 and PLA was observed (). Separate paired samples t-tests indicated significantly greater (p ≤ .05) increases in REE in PX200 when compared to PLA 30 min (70.6 ± 152.4 kcals/day; 95% CI: 1.4, 140.2, p = .05), 60 min (59.1 ± 123.9 kcals/day; 95% CI: 2.7, 115.5; p = .04), 90 min (144.3 ± 257.7 kcals/day; 95% CI: 27.0, 261.6, p = .02), 120 min (110.1 ± 180.7 kcals/day; 95% CI: 27.9, 192.3, p = .01), and 180 min (118.7 ± 232.9 kcals/day; 12.7, 224.8, p = .03). No group × time interaction was observed between PLA and PX100 (p = .23) and PX300 (p = .45). Energy expenditure rates for PX200 significantly increased from baseline 30, 60, 90, 120, and 180 min after ingestion while PLA, PX100, and PX300 did not exhibit statistically significant changes from their respective baseline values. AUC calculations indicated that PX200 and PX300 had significantly higher AUC values when compared to PLA (p < .05) ().
Figure 5. Resting energy expenditure (kcals/day) changes from baseline. ‡ = PX200 change from baseline (0 min) is different (p < .05) than PLA at designated time point. Determined using paired samples t-test after observing significant group × time interaction using 2 × 6 mixed factorial ANOVA with repeated measures on time.
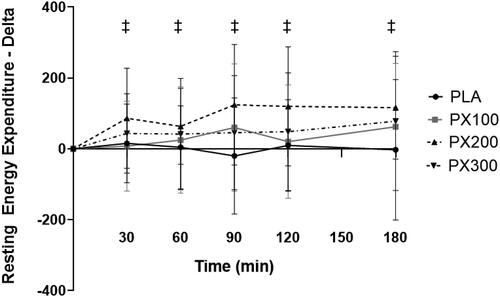
Figure 6. Resting energy expenditure AUC. * = differences (p < .05) in calculated AUC values between PX200 and PLA and PX300 and PLA using one-way ANOVA with Tukey corrections.
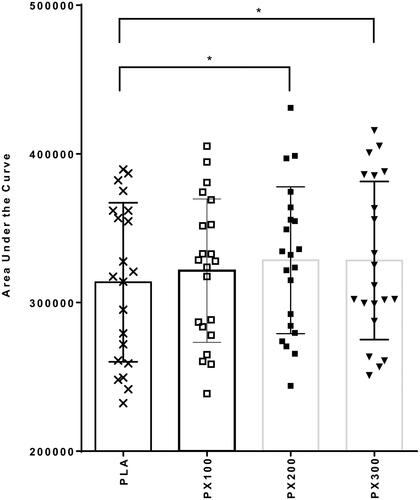
Table 4. Energy expenditure data, rate of fat oxidation, and lipolysis markers.
Energy expenditure was also expressed as calories burned per minute throughout the current study. Again, a significant group × time interaction (p = .03) between PX200 and PLA was observed. Separate paired samples t-tests indicated significantly greater (p ≤ .05) increases in REE in PX200 when compared to PLA 30 min (0.055 ± 0.122 kcals/min; 95% CI: −0.0003, 0.1104, p = .05) and 120 min (0.0701 ± 0.1455 kcals/min; 95% CI: 0.0039, 0.1364, p = .04). No group × time interaction was observed between PLA and PX100 (p = .25) and PX300 (p = .39). PX200 significantly increased from baseline 30, 60, 90, 120, and 180 min after ingestion while PLA, PX100, and PX300 did not exhibit statistically significant changes from their respective baseline values. When extrapolated across the 180-min measurement period in the current study, PX200 resulted in 99.9 ± 115.9 kcal/180 min increase in calories burned, compared to 3.9 ± 126.3 kcal/180 min for PLA, 35.8 ± 154.0 kcal/180 min for PX100 and 45.2 ± 185.0 kcal/180 min for PX300. When compared to PLA, PX200 (9.37 ± 13.79 kcal/180 min; 95% CI: 3.09, 15.65, p = .005) and PX300 (8.27 ± 11.82 kcal/180 min; 95% CI: 2.89, 13.65, p = .004) was significantly greater than PLA
Rate of fat oxidation
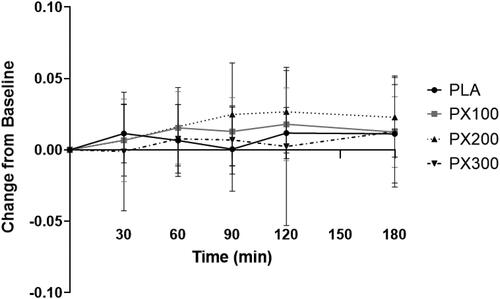
A significant group × time interaction (p = .05) was observed for rates of fat oxidation between PX200 and PLA (). Separate paired samples t-tests indicated a tendency for fat oxidation rates in PX200 to be higher than PLA 90 min (−0.024 ± 0.055 g/min, 95% CI: −0.049, 0.00073, p = .056) and 120 min (−0.0149 ± 0.035 g/min, 95% CI: −0.0308, 0.0011, p = .066) of ingestion. No significant group × time interactions were observed for PX100 (p = .24) and PX300 (p = .40). When compared to their respective baseline values, PX100 experienced significant (p ≤ .01) increases 60 and 120 min after ingestion. Rates of fat oxidation were significantly increased 60, 90, 120, and 180 min after ingestion and PLA reported a significant increase 120 min after ingestion. No changes in fat oxidation rates were observed in comparison to baseline for PX300. Additionally, no significant differences between groups (p = .89) were identified for fat oxidation AUC. No changes between conditions were observed for respiratory quotient (data not shown).
Figure 7. Rate of fat oxidation changes from baseline. § = PX200 change from baseline (0 min) tended to be different than PLA after 90 min (mean difference: −0.024 ± 0.055; 95% CI: −0.049, 0.00073, p = .056) and 120 min (mean difference: −0.0149 ± 0.035; 95% CI: −0.0308, 0.0011, p = .066).
Free fatty acids
No significant group × time interactions were observed between PLA and PX100 (p = .86) and PX200 (p = .28). Additionally, none of the observed changes in PLA, PX100, and PX200 were different than their respective baseline values. The group × time interaction (p = .08) for PX300 is technically not statistically significant. However, using a forced post-hoc approach, the observed changes in PX300 when compared to PLA were different after 120 min (Mean difference: −148.8 ± 59.7 µM; 95% CI: −19.9, −2.5, p = .03), but no other timepoints were statistically significant. When viewed against its respective baseline values, only the PX300 free fatty acid concentrations 180 min after ingestion were statistically different than baseline. Finally, AUC calculations were analyzed using one ANOVA and PX300 AUC values were greater than PLA (22,633 ± 5107; 95% CI: 7501, 37,765, p = .002).
Glycerol
No significant group × time interactions were observed between PLA and PX100 (p = .24), PX200 (p = .43), and PX300 (p = .30). Changes from respective baseline values within each group did not reveal any statistically significant changes in all groups. AUC values for glycerol values were not different between PX doses and PLA (p > .05) and no individual pairwise comparisons approached statistical significance.
Complete blood count and comprehensive metabolic panels
All traditional components of complete blood counts () and comprehensive metabolic panels () were assessed 0 and 180 min after supplementation on whole-blood and serum samples, respectively. In comparison to PLA, no significant group × time interactions (p ≥ .05) were observed for any of the assessed components for either complete blood counts and comprehensive metabolic panels for PX100 and PX200. When comparing the changes observed with PX300 against PLA, significant group × time interactions were observed for absolute basophils (p = .05), glucose (p = .05), calcium (p = .02), and bilirubin (p = .02). In all instances, all recorded stayed within clinically accepted normative values. As a result, the clinical significance of this statistically significant change should be carefully considered. Within the comprehensive metabolic panels, glucose exhibited a significant group × time interaction (p = .03) between PLA and PX200 while significant group × time interactions were observed between PX300 and PLA for glucose (p = .05), calcium (p = .02), and bilirubin (p = .02).). Here again, all recorded values stayed within clinically accepted normative values and one should carefully consider this statistically significant change.
Table 5. Complete blood count.
Table 6. Comprehensive metabolic panel.
Discussion
CAF is a well-known stimulant that has been shown to have various beneficial effects on energy balance by increasing energy expenditure and lipolysis (Astrup et al. Citation1990; Glade Citation2010) and decreasing appetite (Harpaz et al. Citation2017). However, the extent to which PX, CAF’s main metabolite, is responsible for CAF’s effects on energy balance is currently unclear. Our data demonstrate that a single 200 mg dose of PX (PX200) induces thermogenesis at all measured timepoints and when expressed as AUC over a 180-min measurement time course when compared to PLA. Additional findings include the ability of PX200 to augment the increases in subjective hunger ratings observed in PLA at all observed timepoints (tendency for difference at 120 min). Additionally, a 100 mg dose of PX significantly reduced heart rate values 60 and 180 min after ingestion when compared to PLA while a 300 mg dose of PX resulted in significant increases in free fatty acid levels 120 min after ingestion and when calculated as AUC when compared to PLA while also demonstrating greater energy expenditure when expressed AUC across the 180-min measurement period in the present study.
Currently, no previous research is available that has reported on metabolic and cardiovascular changes that result from oral ingestion of PX. The majority of research examining these outcomes has come from studies that have administered different doses of CAF and from this work, CAF is well-known for its ability to stimulate thermogenesis by increasing sympathetic nervous system activity (Biaggioni et al. Citation1991; Kalmar and Cafarelli Citation1999) and increasing the release of catecholamines such as adrenaline and noradrenaline (Westerterp-Plantenga Citation2010). These catecholamines activate thermogenic pathways in most tissues (Westerterp-Plantenga Citation2010), which increase heat production and energy expenditure. In the present study we observed immediate (30 min after ingestion) and widespread increases in energy expenditure in PX200. PX100 did not augment energy expenditure rates relative to PLA and when expressed as AUC, both the 200 mg and 300 mg doses of PX resulted in significantly greater levels of energy expenditure when compared to PLA. Whether or not these outcomes are due to PX exhibiting similar properties as CAF in that PX also stimulates catecholamine release cannot be determined from this study and need to be examined more fully in subsequent research.
The decrease in heart rate after PX100 ingestion was not anticipated. While no such data is available for PX, previous dose-response studies involving CAF have highlighted a similar ability of CAF to decrease heart rate. For example, Astrup and colleagues (Astrup et al. Citation1990) also utilized a randomized, double-blind, placebo-controlled, crossover study design and orally administered CAF doses of 0, 100, 200, and 400 mg and observed mean decreases in heart rate similar to the changes observed in the present study. It is challenging to fully reconcile why the PX100 dose exhibited statistically significant changes versus PLA and similar changes were not observed in PX200 and PX300, but greater CAF dosages in the Astrup study (Astrup et al. Citation1990) also did not yield progressively greater changes in heart rate. Whether or not a 100 mg dose of PX exhibits a dose-specific inhibitory effect on adenosine receptors is intriguing to consider, but additional research is needed before this can be discussed more fully.
In addition to evaluating changes in thermogenesis, we sought to examine if any changes in substrate partitioning as measured by changes in rates of fat oxidation using indirect calorimetry and plasma concentrations of glycerol and FFA was evident due to PX ingestion. The theoretical basis behind these assessments stems from CAF’s ability to augment catecholamine production and stimulation of sympathetic nervous system activity, which ultimately impacts protein kinase B and hormone sensitive lipase signaling (Rahimi Citation2019). Observed changes in these parameters in the present study were more sporadic as PX200 tended to cause greater increases in rates of fat oxidation versus PLA with no observed impact on glycerol and FFA. Alternatively, PX300 was not responsible for any changes in rates of fat oxidation versus what was observed in PLA, but PX300 did increase plasma concentrations of FFA in comparison to PLA 120 min after ingestion. Moreover, when FFA values were expressed as AUC, PX300 had significantly greater values than PLA (). Previously Astrup et al. (Astrup et al. Citation1990) reported consistent increases in FFA and glycerol after CAF ingestion in comparison to PLA with glycerol and FFA changes demonstrating a clear dose-response relationship with no changes being reported for respiratory quotient values. These findings somewhat conflict with outcomes from the present study as we reported no changes in plasma glycerol after PX ingestion (irrespective of the dose) and only PX300 exhibited any ability to increase FFA concentrations while rates of fat oxidation tended to increase to a greater degree when compared to PLA.
Previous research involving CAF have linked CAF to weight loss and body weight management through its ability to stimulate thermogenesis (Astrup et al. Citation1990), increase markers of lipolysis (Astrup et al. Citation1990), suppress appetite and presumably decrease energy intake (Glade Citation2010; Westerterp-Plantenga Citation2010). In addition to evaluating PX’s ability to change energy expenditure rates and substrate oxidation, we also sought to examine if PX’s ability to alter subjective feelings of hunger and appetite. Results from the present study indicated PX200 was able to augment the increase in subjective hunger ratings that were observed in PLA () while no changes were observed for subjective ratings of appetite. Previous research has connected CAF’s ability to inhibit adenosine (Nelson et al. Citation2004) and neuropeptide Y (Womack et al. Citation2012) signaling, a strong suppressant of appetite, but firm conclusions cannot be drawn about PX’s ability to influence appetite without completing additional research. Future acute investigations in this area should explore if PX ingestion significantly impacts how much energy one consumes when eating a standardized meal while more prolonged research should be considered to see if the changes in energy expenditure and hunger can combine over the course of several weeks to positively weight loss and body compositions changes after PX consumption.
Previously animal research involving PX demonstrated a reduced anxiogenic effect when compared to CAF (Okuro et al. Citation2010). While not a comprehensive evaluation of this area, no PX dose (or PLA) was responsible for changes in subjective ratings of anxiety (). Human research by Xing et al. (Lelo et al. Citation1986) delivered acute 50, 100, 150, and 200 mg doses of PX to 12 healthy male and females and as part of this study evaluated changes in reported adverse events over a 6-h time course. No changes in adverse events as assessed by clinical chemistry panels and the frequency or severity of reported adverse events were found providing initial evidence to suggest that PX in humans is well tolerated. These results are in concert with our present findings as PX doses of 100 and 200 mg were not associated for any changes in any clinical chemistry panel or complete blood count component, changes in systolic or diastolic blood pressure, or the severity or frequency of any reported adverse events.
A few study limitations need to be highlighted to help readers put our findings into appropriate context. For starters, this study highlights acute changes in a well-controlled study design after one dose of the assigned PX dose or PLA and readers are cautioned to extrapolate our findings the confines of this design. A primary intent for this initial study was to evaluate initial efficacy for PX’s ability to impact thermogenesis, substrate oxidation, and perceptual indicators related to energy balance. Due to PX being the primary metabolite of CAF metabolism, any attempt to explain mechanistic reasons for our findings has focused upon CAF’s known ability to impact adenosine signaling and catecholamine production. We were unable to perform these analyses as part of this investigation and future research should seek to identify PX’s mechanism of action for the outcomes we observed. Another limitation of this manuscript relates to the lack of a positive control such as caffeine. Our primary aim was to investigate the impact of different doses of paraxanthine versus a placebo. As mentioned previously, genetic and other differences exist between CAF and PX which go on to further dictate what responses result from their administration. For this reason, the intent of the paper was to characterize how PX responded. As more research accumulates, future studies may seek to better understand how PX performs in comparison to CAF. In addition, we employed a mixed gender cohort to maximize external validity for our findings and as a result we did not perform any type of gender analysis as part of our findings. Future work could explore if PX exerts greater or lesser impact on any one sex, but the reader should note that Astrup did previously report that gender did not exert any statistical influence over the outcomes of their study, which we mirrored in our study design. Lastly, some readers may feel that our findings may have been confounded by a wider dispersion of body composition in our participants than was needed. To this point, previous work by Bracco and colleagues (Bracco et al. Citation1995) indicated that obese in comparison to lean subjects experience reduced changes in thermogenesis after caffeinated coffee ingestion with obese women experiencing a blunted increase in basal lipid oxidation rates in comparison to lean subjects. To this point, readers should consider the crossover nature of our design whereby any individual differences would be normalized and future studies could examine this more closely with the recruitment of only lean or only obese participants.
Conclusion
PX, the primary metabolite of CAF, has beneficial effects on energy balance by increasing energy expenditure and reducing hunger. Specifically, PX200 when compared to changes observed in PLA increased thermogenesis at all measured time points after ingestion. In addition, PX200 significantly attenuated the increases in subjective hunger ratings that were observed in PLA 30, 60, 90, and 180 after ingestion while also tending to increase fat oxidation rates (90 and 120 min after ingestion). PX300 also increased energy expenditure rates (in comparison to PLA) when expressed as AUC and was responsible for greater increases in FFA 120 min after ingestion and when all values were expressed as AUC. Future clinical trials are required to assess the longitudinal potential of PX as a weight management aid.
Ethics approval
Ethical approval was obtained from the Lindenwood University IRB: IRB-22-30, initially approved on 11/5/21, renewal approved on 10/21/22).
Consent form
All study participants were required to sign and provide their informed consent on an IRB-approved informed consent document prior to any data collection, which conformed to the standards set by the latest revision of the Declaration of Helsinki.
Acknowledgements
The authors would also like to thank the participants who completed the study protocol.
Disclosure statement
M.P, R.J. and C.M.K serve on the scientific advisory board of NNB Nutrition, the manufacturer of the paraxanthine used in this study. These individuals are not compensated based upon the sales of PX. R.J. and M.P. are researchers and principals of Ingenious Ingredients, the sponsor of the study, and inventors of numerous patent applications for the use of paraxanthine. RJ and MP were not involved in data collection, analysis or interpretation of the data, or in preparing the initial draft of the manuscript. All other authors declare no competing interests.
Data availability statement
The datasets used and/or analyzed during the current study will be made available from the corresponding author upon request.
Additional information
Funding
Notes on contributors
Kristen N. Gross
Kristen Gross, MS, Leah Allen, MS, Paige Sutton, MS, and Esther Duncan, BS were all students working in the Exercise and Performance Nutrition Laboratory on this project and have research interests in exercise, nutrition, and health.
Leah E. Allen
Kristen Gross, MS, Leah Allen, MS, Paige Sutton, MS, and Esther Duncan, BS were all students working in the Exercise and Performance Nutrition Laboratory on this project and have research interests in exercise, nutrition, and health.
Anthony M. Hagele
Anthony Hagele, MS is the Coordinator of the Exercise and Performance Nutrition Laboratory and Joesi Krieger, MS is a Research Coordinator in the Exercise and Performance Nutrition Laboratory. Both have research interests in exercise, nutrition, and health.
Joesi M. Krieger
Anthony Hagele, MS is the Coordinator of the Exercise and Performance Nutrition Laboratory and Joesi Krieger, MS is a Research Coordinator in the Exercise and Performance Nutrition Laboratory. Both have research interests in exercise, nutrition, and health.
Paige J. Sutton
Kristen Gross, MS, Leah Allen, MS, Paige Sutton, MS, and Esther Duncan, BS were all students working in the Exercise and Performance Nutrition Laboratory on this project and have research interests in exercise, nutrition, and health.
Esther Duncan
Kristen Gross, MS, Leah Allen, MS, Paige Sutton, MS, and Esther Duncan, BS were all students working in the Exercise and Performance Nutrition Laboratory on this project and have research interests in exercise, nutrition, and health.
Petey W. Mumford
Petey Mumford, PhD and Chad Kerksick, PhD, are faculty members at Lindenwood University and have research interests in exercise and nutritional interventions that impact health, performance, and recovery.
Ralf Jäger
Martin Purpura, PhD and Ralf Jager, PhD work for Increnovo, LLC and have research interests in exercise and nutrition interventions and their impact on health, performance, and recovery.
Martin Purpura
Martin Purpura, PhD and Ralf Jager, PhD work for Increnovo, LLC and have research interests in exercise and nutrition interventions and their impact on health, performance, and recovery.
Chad M. Kerksick
Petey Mumford, PhD and Chad Kerksick, PhD, are faculty members at Lindenwood University and have research interests in exercise and nutritional interventions that impact health, performance, and recovery.
References
- Astrup A, Toubro S, Cannon S, Hein P, Breum L, Madsen J. 1990. Caffeine: a double-blind, placebo-controlled study of its thermogenic, metabolic, and cardiovascular effects in healthy volunteers. Am J Clin Nutr. 51(5):759–767. doi: 10.1093/ajcn/51.5.759.
- Begas E, Kouvaras E, Tsakalof A, Papakosta S, Asprodini EK. 2007. In vivo evaluation of CYP1A2, CYP2A6, NAT-2 and xanthine oxidase activities in a Greek population sample by the RP-HPLC monitoring of caffeine metabolic ratios. Biomed Chromatogr. 21(2):190–200. doi: 10.1002/bmc.736.
- Biaggioni I, Paul S, Puckett A, Arzubiaga C. 1991. Caffeine and theophylline as adenosine receptor antagonists in humans. J Pharmacol Exp Ther. 258(2):588–593.
- Bracco D, Ferrarra JM, Arnaud MJ, Jéquier E, Schutz Y. 1995. Effects of caffeine on energy metabolism, heart rate, and methylxanthine metabolism in lean and obese women. Am J Physiol. 269(4 Pt 1):E671–E678. doi: 10.1152/ajpendo.1995.269.4.E671.
- Casa DJ, Armstrong LE, Hillman SK, Montain SJ, Reiff RV, Rich BS, Roberts WO, Stone JA. 2000. National athletic trainers’ association position statement: fluid replacement for athletes. J Athl Train. 35(2):212–224.
- Cornelis MC, El-Sohemy A, Kabagambe EK, Campos H. 2006. Coffee, CYP1A2 genotype, and risk of myocardial infarction. JAMA. 295(10):1135–1141. doi: 10.1001/jama.295.10.1135.
- Glade MJ. 2010. Caffeine-not just a stimulant. Nutrition. 26(10):932–938. doi: 10.1016/j.nut.2010.08.004.
- Guest N, Corey P, Vescovi J, El-Sohemy A. 2018. Caffeine, CYP1A2 genotype, and endurance performance in athletes. Med Sci Sports Exerc. 50(8):1570–1578. doi: 10.1249/MSS.0000000000001596.
- Guest NS, VanDusseldorp TA, Nelson MT, Grgic J, Schoenfeld BJ, Jenkins NDM, Arent SM, Antonio J, Stout JR, Trexler ET, et al. 2021. International society of sports nutrition position stand: caffeine and exercise performance. J Int Soc Sports Nutr. 18(1):1.
- Harpaz E, Tamir S, Weinstein A, Weinstein Y. 2017. The effect of caffeine on energy balance. J Basic Clin Physiol Pharmacol. 28(1):1–10. doi: 10.1515/jbcpp-2016-0090.
- Hetzler RK, Knowlton RG, Somani SM, Brown DD, Perkins RM3rd. 1990. Effect of paraxanthine on FFA mobilization after intravenous caffeine administration in humans. J Appl Physiol (1985). 68(1):44–47. doi: 10.1152/jappl.1990.68.1.44.
- Kalmar JM, Cafarelli E. 1999. Effects of caffeine on neuromuscular function. J Appl Physiol (1985). 87(2):801–808. doi: 10.1152/jappl.1999.87.2.801.
- Lelo A, Miners JO, Robson RA, Birkett DJ. 1986. Quantitative assessment of caffeine partial clearances in man. Br J Clin Pharmacol. 22(2):183–186. doi: 10.1111/j.1365-2125.1986.tb05247.x.
- Nelson DR, Zeldin DC, Hoffman SM, Maltais LJ, Wain HM, Nebert DW. 2004. Comparison of cytochrome P450 (CYP) genes from the mouse and human genomes, including nomenclature recommendations for genes, pseudogenes and alternative-splice variants. Pharmacogenetics. 14(1):1–18. doi: 10.1097/00008571-200401000-00001.
- Okuro M, Fujiki N, Kotorii N, Ishimaru Y, Sokoloff P, Nishino S. 2010. Effects of paraxanthine and caffeine on sleep, locomotor activity, and body temperature in orexin/ataxin-3 transgenic narcoleptic mice. Sleep. 33(7):930–942. doi: 10.1093/sleep/33.7.930.
- Orru M, Guitart X, Karcz-Kubicha M, Solinas M, Justinova Z, Barodia SK, Zanoveli J, Cortes A, Lluis C, Casado V, et al. 2013. Psychostimulant pharmacological profile of paraxanthine, the main metabolite of caffeine in humans. Neuropharmacology. 67:476–484. doi: 10.1016/j.neuropharm.2012.11.029.
- Palatini P, Ceolotto G, Ragazzo F, Dorigatti F, Saladini F, Papparella I, Mos L, Zanata G, Santonastaso M. 2009. CYP1A2 genotype modifies the association between coffee intake and the risk of hypertension. J Hypertens. 27(8):1594–1601. doi: 10.1097/HJH.0b013e32832ba850.
- Rahimi R. 2019. The effect of CYP1A2 genotype on the ergogenic properties of caffeine during resistance exercise: a randomized, double-blind, placebo-controlled, crossover study. Ir J Med Sci. 188(1):337–345. doi: 10.1007/s11845-018-1780-7.
- Soares RN, Schneider A, Valle SC, Schenkel PC. 2018. The influence of CYP1A2 genotype in the blood pressure response to caffeine ingestion is affected by physical activity status and caffeine consumption level. Vascul Pharmacol. 106:67–73. doi: 10.1016/j.vph.2018.03.002.
- Stavric B. 1988. Methylxanthines: toxicity to humans. 3. Theobromine, paraxanthine and the combined effects of methylxanthines. Food Chem Toxicol. 26(8):725–733. doi: 10.1016/0278-6915(88)90073-7.
- Subar AF, Kirkpatrick SI, Mittl B, Zimmerman TP, Thompson FE, Bingley C, Willis G, Islam NG, Baranowski T, McNutt S, et al. 2012. The automated self-administered 24-hour dietary recall (ASA24): a resource for researchers, clinicians, and educators from the National Cancer Institute. J Acad Nutr Diet. 112(8):1134–1137. doi: 10.1016/j.jand.2012.04.016.
- Weir JB. 1949. New methods for calculating metabolic rate with special reference to protein metabolism. J Physiol. 109(1-2):1–9. doi: 10.1113/jphysiol.1949.sp004363.
- Westerterp-Plantenga MS. 2010. Green tea catechins, caffeine and body-weight regulation. Physiol Behav. 100(1):42–46. doi: 10.1016/j.physbeh.2010.02.005.
- Winder WW. 1986. Effect of intravenous caffeine on liver glycogenolysis during prolonged exercise. Med Sci Sports Exerc. 18(2):192–196.
- Womack CJ, Saunders MJ, Bechtel MK, Bolton DJ, Martin M, Luden ND, Dunham W, Hancock M. 2012. The influence of a CYP1A2 polymorphism on the ergogenic effects of caffeine. J Int Soc Sports Nutr. 9(1):7.
- Xing D, Yoo C, Gonzalez D, Jenkins V, Nottingham K, Dickerson B, Leonard M, Ko J, Faries M, Kephart W, et al. 2021. Dose-response of paraxanthine on cognitive function: a double blind, placebo controlled, crossover trial. Nutrients. 13(12):13. doi: 10.3390/nu13124478.
- Yoo C, Xing D, Gonzalez D, Jenkins V, Nottingham K, Dickerson B, Leonard M, Ko J, Faries M, Kephart W, et al. 2021. Acute paraxanthine ingestion improves cognition and short-term memory and helps sustain attention in a double-blind, placebo-controlled, crossover trial. Nutrients. 13(11):3980. doi: 10.3390/nu13113980.