
Abstract
Prebiotic and probiotic combinations may lead to a synbiotic effect, demonstrating superior health benefits over either component alone. Using the Mucosal Simulator of the Human Intestinal Microbial Ecosystem (M-SHIME®) model, the effects of repeated supplementation with inulin (prebiotic, which is expected to provide a source of nutrition for the live microorganisms in the gut to potentially support optimal digestive health), Bacillus coagulans lactospore (probiotic), and a low and high dose of a synbiotic combination of the two on the gut microbial community activity and composition were evaluated. Test product supplementation increased the health-promoting short-chain fatty acids acetate and butyrate compared with levels recorded during the control period, demonstrating a stimulation of saccharolytic fermentation. This was likely the result of the increased abundance of several saccharolytic bacterial groups, including Megamonas, Bifidobacterium, and Faecalibacterium, following test product supplementation. The stimulation of acetate and butyrate production, as well as the increased abundance of saccharolytic bacterial groups were more evident in treatment week 3 compared with treatment week 1, demonstrating the value of repeated product administration. Further, the synbiotic formulations tended to result in greater changes compared with prebiotic or probiotic alone. Overall, the findings demonstrate a synbiotic potential for inulin and B. coagulans lactospore and support repeated administration of these products, indicating a potential for promoting gut health.
Introduction
The gut microbiome has multiple functions in human health, some of which include the metabolism of non-digestible carbohydrates and the production of vitamins and amino acids. This, in turn, provides energy and absorbable substrates to the host. A healthy gut microbiome also serves to protect against pathogens and has a role in modulating the host immune system. Dysbiosis occurs when there is a microbial imbalance in the gut, and is associated with an ever increasing number of diseases, syndromes, and functional aberrations, including irritable bowel syndrome, inflammatory bowel disease, systemic metabolic diseases, and allergies (Bull and Plummer Citation2014; Weiss and Hennet Citation2017).
Prebiotics are defined as “a substrate that is selectively utilized by host microorganisms conferring a health benefit” (Gibson et al. Citation2017). These non-digestible oligosaccharides resist digestion and absorption in the small intestine and are completely or partially fermented by bacteria that reside in the large intestine/colon (Davani-Davari et al. Citation2019). Gut bacteria digest prebiotics in a process called saccharolytic fermentation with health-promoting short-chain fatty acids (SCFAs) being a major byproduct of this fermentative process (Roberfroid Citation1997; Davani-Davari et al. Citation2019). Inulin is a well-established prebiotic that selectively influences the colon microbiota ecosystem and improves intestinal barrier function, insulin sensitivity, and laxation, among other beneficial effects (Vandeputte et al. Citation2017; Hughes et al. Citation2022). Probiotics, on the other hand, are defined as “live microorganisms which when administered in adequate amounts confer a health benefit to the host” (Hill et al. Citation2014). Bacillus probiotics, including Bacillus coagulans, are associated with a number of health benefits, such as the ability to increase the abundance of bacteria that produce health-promoting SCFAs (Sasaki et al. Citation2020; Marzorati et al. Citation2020; Marzorati et al. Citation2021; Majeed et al. Citation2023). Synbiotic formulations combine both a prebiotic and probiotic element with the idea that the combination will have superior health benefits compared with administration of either component alone (Schrezenmeir and de Vrese Citation2001; Markowiak and Śliżewska Citation2017). Inulin and B. coagulans are among the prebiotics and probiotics commonly used in synbiotic formulations (Pandey et al. Citation2015).
The use of human intervention studies for the evaluation of potential prebiotic, probiotic, and/or synbiotic effects on intestinal health is highly physiologically relevant. However, these studies have several shortcomings. Indeed, most findings from these studies are derived from endpoint data, making it difficult to assess dynamic changes in the gut environment. Additionally, it is not feasible to investigate treatment-related changes in specific regions of the intestine. A final drawback is the fact the host is involved, making it impossible to focus solely on gut microbial activity. Therefore, in vitro methods are commonly used to investigate the effects of prebiotic, probiotic, and synbiotic supplementation. The Simulator of the Human Intestinal Microbial Ecosystem (SHIME®) is a continuous model of the human gastrointestinal tract that allows the culture of complex gut microbiota over an extended period and in reactors conditioned to represent different intestinal regions (Molly et al. Citation1993). This allows the assessment of detailed, localized information regarding the fermentation profile of test compounds. An important feature of the SHIME® model is the two-week stabilization period, that allows the human fecal inoculum to evolve to a stable in vitro microbial ecosystem representative of the colonic regions of interest prior to administering test products. Additionally, the capacity for a three-week treatment period allows for the evaluation of repeated administration of a test product over an extended period, which is important given that previous studies have shown that pre- and probiotic properties cannot often be evaluated prior to 2–3 wk of continuous administration (Rauch et al. Citation2022). The Mucosal SHIME (M-SHIME®) model is an adaptation of the original model that includes a mucosal component, allowing the study of the gut microbiome composition in both the lumen and mucosal compartments to obtain a more complete picture of the status of the colonic microbiota (Van den Abbeele et al. Citation2012).
This study investigated the effects of repeated supplementation with the prebiotic inulin, the probiotic B. coagulans lactospore, and two doses of a synbiotic combination of the aforementioned prebiotic and probiotic on the gut microbiome community activity and composition using the long-term M-SHIME® model.
Materials and methods
Fecal samples
Fecal samples were collected from five healthy young adult donors aged between 25 and 35 years, who had not been treated with antibiotics in the previous 6 months. Fecal slurries were prepared in anaerobic phosphate buffer at a concentration of 40% w/v. The fecal slurry was briefly centrifuged to remove large particles (2 min, 500xg). Afterwards, an equal volume of cryoprotectant solution (Hoefman et al. Citation2013) was added to the fecal supernatant in the anaerobic workstation. After homogenization, the cryoprotected fecal slurry was snap-frozen in liquid nitrogen and stored at −80 °C for use in the short-term colonic batch experiment and long-term M-SHIME® study. The collection and use of the fecal samples was approved by the Ethics Committee of the University Hospital Ghent (reference number B670201836585).
Test products
The test products included the prebiotic, dietary fiber inulin, and the probiotic, B. coagulans lactospore, and were received from Haleon (Warren, NJ, USA). When tested individually, dietary fiber inulin was supplemented at a dose of 2.5 g/day in the M-SHIME® study, which corresponds to an in human dose of 5 g/day. B. coagulans lactospore was supplemented at a dose of 10 mg/day (1 × 10⁹ colony forming units [CFU]) in the M-SHIME® study, which corresponds to an in human dose of 20 mg/day (2 × 10⁹ CFU). The test products were also evaluated in combination (synbiotic) at two dose levels. The in vitro low dose synbiotic comprised 2.5 g/day prebiotic and 10 mg/day probiotic and the in vitro high dose synbiotic comprised 3 g/day prebiotic and 20 mg/day probiotic. The test products included the same ingredients as Benefiber Prebiotic Fiber + Probiotics GummiesTM, dietary fiber inulin as a prebiotic and B. coagulans lactospore as a probiotic.
Short-term colonic incubations and donor prescreening
To select an appropriate donor for use in the long-term M-SHIME® study, fecal material from the five donors was prescreened using short-term colonic incubations, which were performed as previously described (Van den Abbeele et al. Citation2018). Briefly, individual colonic reactors were filled with sugar-depleted nutritional medium containing basal colonic nutrients. Diluted fecal inoculum (corresponding to 7.5% w/v) was then added to each colonic reactor (10% v/v) followed by a single dose of test product (low dose of synbiotic; 2.5 g/day inulin and 10 mg/day B. coagulans lactospore, corresponding to 4.167 g/L and 17 mg/L, respectively, in the colonic incubations), or an equivalent volume of nutrient medium (blank). Incubations were performed at 37 °C with shaking (90 rpm) and under anaerobic conditions for 48 h. For each donor, each test condition (blank or synbiotic) was replicated four times, resulting in 40 independent incubations. pH was measured and samples were collected for SCFA profiling at the start of the incubation (0 h) and at 24 h and 48 h. Donor selection was based on SCFA production profiles, with results shown in Figures S1 and S2. While the results of this donor prescreening study confirmed that all donors were able to efficiently boost microbial fermentation following product supplementation (as seen by pH reductions and production of a diverse spectrum of SCFAs), donor E was selected for the long-term M-SHIME® study given that the response to synbiotic treatment was most balanced for donor E compared with donors A–D (i.e. donor E showed intermediately increased production of all SCFA, indicating a balanced microbiome). Short-term colonic incubations were also utilized to assess gas pressure during the long-term M-SHIME® study. Here, microbiota derived from the proximal colon (PC) compartment of the M-SHIME® set up either during the control period (representing the non-adapted microbial community) or at the end of the three-week treatment period (representing the pre-adapted microbial community) was used to inoculate the short-term batch colonic reactors, next to the respective treatments (including a blank control). These treatments included prebiotic, probiotic, synbiotic low dose and synbiotic high dose, supplemented at the same concentration as used during the M-SHIME® experiment. When a pre-adapted microbial community was used, separate blank incubations (with addition of the microbial inoculum, though without product addition) were performed per treatment condition. All test conditions were tested in quadruplicate. Gas pressure was measured during the following time intervals: 0–2 h, 2–4 h, 4–6 h, 6–24 h, and 24–48 h.
Figure 1. Effect of prebiotic, probiotic, synbiotic low dose, and synbiotic high dose on base-acid consumption in the proximal Colon (PC) (left) and distal Colon (DC) (right).
The average weekly base-acid consumption (mL/day) during the control period (CTRL; n = 4), the first week of the treatment period (TR1; n = 4), and the final week of the treatment period (TR3; n = 4) are shown. *represents p < 0.05 relative to the preceding period for each test product. # represents p < 0.05 between CTRL and TR3 for each test product. p < 0.05 between different test products are indicated with different letters; lower case letters are used for TR1 and capital letters are used for TR3.
CTRL, control period; DC, distal colon; PC, proximal colon; TR1, treatment week 1; TR3, treatment week 3.
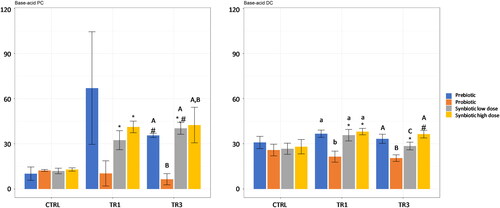
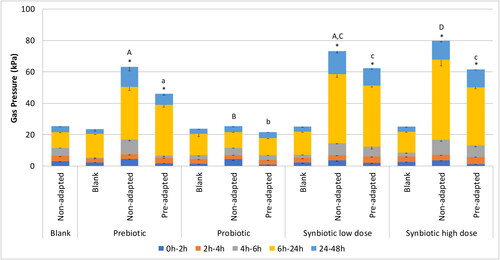
Figure 2. Gas production (kPa) following blank or prebiotic, probiotic, synbiotic low dose, and synbiotic high dose supplementation across different time intervals over 48 h (short-term colonic incubations).
Short-term colonic incubations were inoculated with proximal colon (PC) microbiota derived from the M-SHIME® reactors collected at the end of the control period (CTRL; representing the non-adapted microbial community) or at the end of the treatment period (TR3; representing the pre-adapted microbial community) for each test condition (n = 4). *represents p < 0.05 relative to corresponding blank for each test product. p < 0.05 between different test products (normalized to their own blank incubation) are indicated with different letters; lower case letters are used for the pre-adapted microbial community and capital letters are used for the non-adapted microbial community.
CTRL, control period; PC, proximal colon; TR3, treatment week 3.
M-SHIME® model
The M-SHIME® reactor configuration was adapted from the original SHIME® model (ProDigest and Ghent University, Belgium) to include modeling of both the mucus-associated and luminal microbial communities (Molly et al. Citation1993; Van den Abbeele et al. Citation2012). Details of the M-SHIME® setup, including retention times, pH, temperature settings, mucin-covered microcosms, and reactor feed composition have been described previously (Molly et al. Citation1993; Van den Abbeele et al. Citation2012). This study utilized a Quad-M-SHIME® configuration, using fewer compartments per condition compared to the standard M-SHIME® to allow for the comparison of four test products/conditions in parallel. In this modified configuration, there was a single compartment that simulated both the stomach and small intestine, and a single compartment each for the simulation of the PC and distal colon (DC). The stomach/small intestine compartment was operated using the fill-and-draw principle; SHIME feed (140 mL) was added to the compartment using peristaltic pumps and the pH was retained at 2.0 to simulate the gastric phase. Following a 1.5 h incubation, pancreatic and bile liquid (60 mL, pH 6.8) were added to simulate the small intestine. Following an additional 1.5 h incubation, the intestinal suspension was pumped into the PC compartment (pH 5.6–5.9; 20 h retention time; 500 mL) and then the DC compartment (pH 6.6–6.9; 32 h retention time; 800 mL). The mucosal compartment was simulated by the inclusion of mucin-coated beads, which were added to both the PC and DC compartments according to the method of Van den Abbeele et al. (Citation2013).
After inoculation of the colon reactors (PC and DC) with the cryopreserved fecal suspension from donor E, the microbial community was allowed a two-week stabilization period in which it could differentiate in the reactors according to the specific environmental conditions of the PC and DC. During this period, the reactors were fed basic M-SHIME® nutritional medium (PDNM002B, ProDigest, Belgium) to support maximum diversity of the gut microbiota. The stabilization period was followed by a one-week control period (CTRL), which acted as a reference to determine the baseline microbial community activity and composition within each reactor. During the CTRL, the reactors continued to be fed basic M-SHIME® nutritional medium. Next, a three-week treatment period was initiated during which the reactors were operated under nominal conditions and fed a diet of standard M-SHIME® medium supplemented with the different test products.
During the CTRL and weeks 1 and 3 of the three-week treatment period (TR1 and TR3, respectively), four samples each week were collected from both the luminal and mucosal compartments of the PC and DC compartments. Samples were then evaluated for microbial community activity and microbial community composition using the methods described below.
Microbial community activity
pH measurements were collected during the short-term colonic incubations (donor prescreening) using a Senseline F410 pH meter (ProSense, Oosterhout, The Netherlands). pH monitors were used throughout the M-SHIME® study to ensure the PC and DC compartments were maintained at the optimal pH (5.6–5.9 and 6.6–6.9, respectively). This allowed for the monitoring of base-acid consumption (thereby subtracting the acid consumption from the base consumption to assess colonic acidification) in these compartments. Gas pressure measurements were obtained using a hand-held pressure indicator (CPH6200; Wika, Echt, The Netherlands). SCFAs (acetate, propionate, and butyrate) and branched SCFAs (isobutyrate, isovalerate, and isocaproate) were measured according to the methods of De Weirdt et al. (Citation2010). Lactate levels were assessed using an enzymatic assay kit from R-Biopharm (Darmstadt, Germany) and measured spectrophotometrically according to the manufacturer’s instructions. Ammonium levels were evaluated using the method of de Wiele et al. (Citation2004).
Microbial community composition
To analyze changes in microbial community composition, two techniques were combined, i.e. 16S-targeted Illumina sequencing to provide proportional abundances of different taxa at different phylogenetic levels, and flow cytometry to accurately quantify total bacterial cells (Vandeputte et al. Citation2017). Following luminal and mucosal sample collection, total DNA was isolated as described by Duysburgh et al. (Citation2019). For 16S-targeted Illumina sequencing, primers spanning two hypervariable regions (V3–V4) of the 16S rRNA gene were used (341 F, 5′-CCTACGGGNGGCWGCAG-3′; 785 R, 5′-GACTACHVGGGTATCTAAKCC-3′) (Klindworth et al. Citation2013; Kozich et al. Citation2013). Using a paired sequencing approach, sequencing of 2 × 250 bp resulted in 424 bp amplicons (LGC Genomics GmbH, Berlin, Germany), which are taxonomically more useful than smaller fragments. The MiSeq SOP (Schloss lab) was largely followed for read assembly and cleanup (Schloss and Westcott Citation2011; Kozich et al. Citation2013). In brief, reads were assembled into contigs, alignment-based quality filtering was performed (alignment to the mothur-reconstructed SILVA SEED alignment, v138), chimeras were removed (vsearch v2.13.3), taxonomy was assigned using a naïve Bayesian classifier (Wang et al. Citation2007) and SILVA NR v138_1, and contigs were clustered into Operational Taxonomic Units (OTUs) at 97% sequence similarity using mothur (v.1.44.3). Sequences were removed if they were classified as Eukaryota, Archaea, chloroplasts, or mitochondria, or could not be classified. The most abundant sequence within an OTU was considered the representative sequence. Reads were considered as artifacts or bacteria with no biological impact and removed if they had a maximum abundance ≤5 across samples.
Flow cytometry was used on the same samples to determine the total number of bacterial cells. Cell counts were obtained using a BD Accuri C6 Plus Flow Cytometer (BD Biosciences, Franklin Lakes, New Jersey, USA) (high flow rate) with a threshold level of 700 on the SYTO channel applied to separate bacterial cells from medium debris and signal noise. All populations were determined using appropriate parent and daughter gates. The obtained cell counts allowed for the conversion of relative abundances into absolute abundances. To accomplish this, relative abundances of any population in a sample were multiplied with the total cell count obtained for that sample (Vandeputte et al. Citation2017).
Statistical analysis
Statistical analysis was performed for the following experimental parameters: base-acid consumption, gas, acetate, propionate, butyrate, lactate, ammonium, and bSCFA production; and 16S-targeted Illumina sequencing. For each parameter evaluated (except gas production), four consecutive samples were collected during the CTRL, TR1, and TR3 weeks. The average values of each parameter during that week were calculated and used for the analysis. Changes in each parameter were analyzed by week (TR1 vs CTRL, TR3 vs CTRL or TR1 vs TR3) to determine whether prolonged supplementation (e.g. >1 week) was needed to achieve meaningful changes. Additionally, differences between the test products were analyzed at TR1 and TR3 to determine whether there was synergy between the probiotic and prebiotic test products, and to evaluate differences between the two synbiotic doses. For gas production, the average of the four biological replicates was calculated and used for analysis. Statistical differences in gas production between the different test conditions were analyzed for the non-adapted and pre-adapted microbial community. A p-value of <0.05 (taking into account multiplicity) was considered statistically significant for all comparisons. Normality of data and equality of the variances were determined with a Shapiro-Wilk test and a Levene’s test, respectively. Diagnostics were checked including Residuals vs. Fit, normal Q-Q of the residuals, Residuals vs. Leverage, and Scale-Location. For normally distributed data with equal variances, a one-way ANOVA with a Holm-Bonferroni test was used. For normally distributed data with unequal variances, a Welch test with a Games-Howell test was conducted. If the global null-hypothesis was not rejected (i.e. global test was not significant), then further testing on the pairwise comparisons of the treatment arms was considered exploratory. For non-normally distributed data, a Kruskal-Wallis one-way ANOVA followed by a pairwise Wilcoxon rank sum test with the Holm correction was performed. All statistical analyses were carried out using R version 3.2.5 (The R Foundation for Statistical Computing, Vienna, Austria).
For determination of limit of quantification (LOQ) for the quantitative Illumina data, it was considered that one read corresponded to the LOQ, meaning that LOQ was determined by dividing one read by the total amount of reads in the sample multiplied by the number of cells/mL in the sample. For further statistical testing, the obtained values that were below LOQ could be replaced by the LOQ, which was not included in the current statistical testing.
Discriminant Analysis of Principal Components (DAPC) was used to assess changes in beta diversity on the microbial community composition following product supplementation. DAPC joins two analysis methods to assess population structure, i.e. sequence data are transformed using principal component analysis (PCA) and clusters are subsequently identified using discriminant analysis (DA) (Miller et al. Citation2020). Beta diversity analysis was conducted by hierarchically clustering Euclidean distances between samples using Ward’s minimum variance method. Using absolute abundances, a Variance Stabilizing Transformation (VST) was applied using DESeq2 v1.41.12 (Love et al. Citation2014) prior to the calculation of distances. A DAPC plot was constructed with two discriminants and 80% of the retained variance in the principal components using adegenet v2.1.10 in R (Jombart Citation2008; Jombart et al. Citation2010).
Linear Discriminant Effect Size (LEfSe) was performed to identify the taxa most likely to explain differences between treatments (Segata et al. Citation2011). All features shown in the LEfSe plots meet p ≤ 0.05 for the Kruskal-Wallis and Wilcoxon tests, and the 20 most significant features were plotted. No restrictions were put forward with respect to minimal linear discriminant analysis (LDA) scores, but in general LDA scores ≥ 2.0 are considered biologically relevant. LEfSe analysis was conducted on the Total-Sum Scaled taxonomic abundances at the genus level. LDA scores between treatment and individual taxon abundances were calculated using MASS v7.3.58-3. A heatmap shows the intra-taxon normalized abundances of the taxa with the highest LDA scores. The heatmap and dot plot were visualized using ggplot2 v3.4.3 in R.
Results
Microbial community activity
Base-acid consumption
In both the PC and DC compartments, base-acid consumption was significantly increased at TR1 compared with CTRL with both synbiotic low dose and synbiotic high dose supplementation, but not with prebiotic or probiotic alone (). At TR3, base-acid consumption remained significantly greater with synbiotic low dose supplementation compared with CTRL in both colon regions though with strongest effects observed in the PC, and was significantly increased compared with TR1 in the PC. With synbiotic high dose supplementation, base-acid consumption decreased at TR3 relative to TR1 in the DC. When comparing test products, base-acid consumption was significantly lower with probiotic supplementation compared with prebiotic and synbiotic low dose at TR3 in the PC and compared with all other test products at both TR1 and TR3 in the DC.
Gas production
Gas is a major end product of fermentation by gut microbes. In the M-SHIME® model, the headspace is regularly flushed with nitrogen gas to maintain anaerobiosis, so it is necessary to evaluate gas production in separate short-term colonic batch incubations. These incubations revealed a significant increase in gas pressure with prebiotic and synbiotic (both doses) supplementation relative to blank both for the non-adapted and pre-adapted microbial community, and an increase in gas pressure with both synbiotic doses relative to both prebiotic and probiotic supplementation (except for the synbiotic low dose compared to prebiotic supplementation for the non-adapted microbial community) (). Furthermore, a tendency toward reduced gas production was observed following pre-adaptation of the microbial community for all treatment conditions.
Saccharolytic fermentation
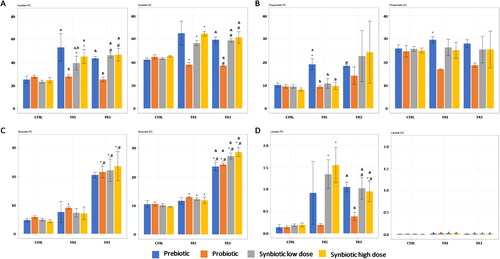
Saccharolytic fermentation was measured by the production of SCFAs (acetate, propionate, butyrate) and lactate. Acetate production was significantly increased at TR1 versus CTRL and at TR3 versus TR1 with both synbiotic doses in the PC and DC compartments, with strongest effects observed in the PC (). Acetate production tended to increase at TR1 and TR3 compared with CTRL with prebiotic supplementation, but these increases did not reach statistical significance. Acetate production was largely unaffected by probiotic supplementation. Propionate production was not affected by test product supplementation, with the exception of an increase at TR1 versus CTRL in both the PC and DC compartments following prebiotic supplementation (). In the DC compartment, propionate production was found to decrease to CTRL in both TR1 and TR3 following probiotic supplementation, though not reaching significance. Butyrate production was enhanced at TR1 versus CTRL with probiotic supplementation in the PC and with probiotic, synbiotic low dose, and synbiotic high dose supplementation in the DC (). Butyrate production continued to increase at TR3, with significantly higher levels versus both CTRL and TR1 following repeated supplementation with probiotic, synbiotic low dose, and synbiotic high dose in the PC and with all test products in the DC. Also at TR3, butyrate levels were higher with both doses of synbiotic compared with prebiotic or probiotic alone. In the PC, lactate production was significantly increased at TR1 compared with CTRL with both synbiotic doses, with a similar though non-significant increase observed following prebiotic supplementation, while this was not observed following probiotic administration (). Levels were reduced at TR3 versus TR1 with synbiotic supplementation but remained significantly greater than CTRL with synbiotic high dose supplementation. Overall, lactate production in the DC was very low. Despite this, there was a significant increase in lactate production relative to CTRL with all test products at TR1, and a significant decrease (vs CTRL) with probiotic, synbiotic low dose, and synbiotic high dose at TR3.
Figure 3. Effect of prebiotic, probiotic, synbiotic low dose, and synbiotic high dose on short-chain fatty acid (SCFA) and lactate production in the proximal Colon (PC) (left) and distal Colon (DC) (right).
The average weekly (3A) acetate (mM), (3B) propionate (mM), (3C) butyrate (mM), or (3D) lactate (mM) production during the control period (CTRL; n = 4), the first week of the treatment period (TR1; n = 4), and the final week of the treatment period (TR3; n = 4) are shown. * represents p < 0.05 relative to the preceding period for each test product. #represents p < 0.05 between CTRL and TR3 for each test product. p < 0.05 between different test products are indicated with different letters; lower case letters are used for TR1 and capital letters are used for TR3.
CTRL, control period; DC, distal colon; PC, proximal colon; SCFA, short-chain fatty acid; TR1, treatment week 1; TR3, treatment week 3.
Proteolytic fermentation
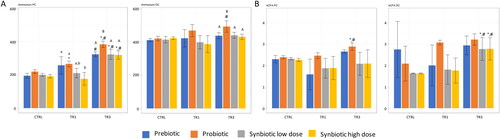
Proteolytic fermentation was measured by the production of ammonium and bSCFAs. In the PC, ammonium levels were significantly increased at TR1 versus CTRL for probiotic supplementation but not for the other test products; levels were significantly enhanced at TR3 versus CTRL and versus TR1 for all test products, reaching significance for most test conditions (except when comparing TR3 and CTRL following prebiotic supplementation) (). In the DC, ammonium levels significantly increased only with probiotic supplementation at TR3 versus TR1, also reaching statistical significance compared with all other test products at TR3 (similar to effects observed in the PC). In the PC, bSCFA production was significantly greater at TR3 versus CTRL and TR1 with probiotic supplementation (). In the DC, bSCFA production was significantly enlarged at TR3 versus CTRL and TR1 following supplementation with both synbiotic test doses.
Figure 4. Effect of prebiotic, probiotic, synbiotic low dose, and synbiotic high dose on ammonium and branched short-chain fatty acid (bSCFA) production in the proximal Colon (PC) (left) and distal Colon (DC) (right).
The average weekly (4A) ammonium (mg/L) and (4B) bSCFA (mM) production during the control period (CTRL; n = 4), the first week of the treatment period (TR1; n = 4), and the final week of the treatment period (TR3; n = 4) are shown. *represents p < 0.05 relative to the preceding period for each test product. # represents p < 0.05 between CTRL and TR3 for each test product. p < 0.05 between different test products are indicated with different letters; lower case letters are used for TR1 and capital letters are used for TR3.
bSCFA, branched short-chain fatty acid; CTRL, control period; DC, distal colon; PC, proximal colon; TR1, treatment week 1; TR3, treatment week 3.
Microbial community composition
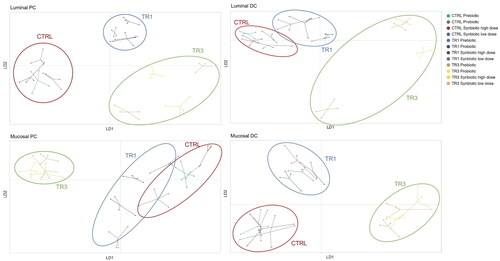
DAPC analysis of beta diversity revealed that supplementation with the test products shifted the composition of the luminal PC and DC and mucosal PC and DC microbial communities relative to the CTRL period (). A clear shift was observed in all colonic compartments at TR1 and was even more pronounced at TR3, demonstrating the cumulative impact of repeated test product administration over time.
Figure 5. Discriminant Analysis Of Principal component (DAPC) plots representing absolute abundance in the luminal proximal Colon (PC), luminal distal Colon (DC), mucosal PC, and mucosal DC.
Data are shown for prebiotic, probiotic, synbiotic high dose, and synbiotic low dose during the control period (CTRL; n = 4), the first week of the treatment period (TR1; n = 4), and the final week of the treatment period (TR3; n = 4) of the M-SHIME® study.
CTRL, control period; DAPC, Discriminant Analysis of Principal Component; DC, distal colon; PC, proximal colon; TR1, treatment week 1; TR3, treatment week 3.
Changes in abundance at the family level are shown in Supplementary Tables 1–4. Importantly, evidence for probiotic engraftment was observed following supplementation with the probiotic or either dose of the synbiotic test product. This was suggested by the consistent increase in members of the family Bacillaceae, specifically to OTU68 which is 100% similar to B. coagulans, in all colon areas (Supplementary Tables 1–4). Supplementation with synbiotic high dose tended to result in higher levels of B. coagulans (vs probiotic or synbiotic low dose) in the lumen and mucus of both colonic compartments, though not reaching statistical significance.
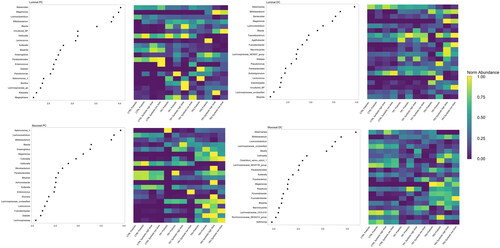
LEfSe analysis and average OTU abundance analysis provided an overview of changes in the microbial community at the genus level (). The mucosal PC appeared most affected by test product supplementation at TR3; changes were much more pronounced at TR3 than TR1, and tended to be more pronounced with the synbiotic test products compared with prebiotic or probiotic alone. In the mucosal DC and luminal PC and DC compartments, changes also tended to be more pronounced at TR3 than CTRL or TR1. In all colon compartments, abundances of Megamonas were consistently increased at TR3 compared with CTRL and TR1 following synbiotic treatment. Indeed, LDA scores of 3.978, 3.471, 3.111 and 2.283 were obtained for PC lumen, DC lumen, PC mucus and DC mucus, respectively, with these scores being a biomarker for treatment with the synbiotic high dose at TR3 (except in the mucosal DC, where it was a biomarker for prebiotic supplementation at TR3). There was a tendency for a reduced abundance of Akkermansia with test product supplementation at TR3 compared with CTRL and TR1 in the luminal and mucosal DC compartments, with LDA scores of 3.953 and 3.676 obtained, respectively, as biomarker for CTRL (of the synbiotic high dose). Bifidobacterium abundances increased at TR3 relative to CTRL and TR1 in both the mucosal and luminal DC following product supplementation, reaching highest LDA scores for synbiotic low dose (3.642) and synbiotic high dose (3.375) in the lumen and mucus, respectively. In the luminal DC, the abundance of Faecalibacterium was increased with test product supplementation and to higher levels following probiotic or synbiotic product administration, reaching a LDA score of 2.953 as a biomarker for treatment with the synbiotic low dose.
Figure 6. Overall treatment linear Discriminant effect size (LEfSe) analysis and average Operational Taxonomic unit abundance by treatment in the luminal proximal Colon (PC), luminal distal Colon (DC), mucosal PC, and mucosal DC.
LEfSe analysis was conducted on the Total-Sum Scaled taxonomic abundances at the genus level following supplementation with prebiotic, probiotic, synbiotic high dose, and synbiotic low dose. The heatmap shows the intra-taxon normalized abundances of the taxa with the highest LDA scores at each timepoint, including the control period (CTRL; n = 4), the first week of the treatment period (TR1; n = 4), and the final week of the treatment period (TR3; n = 4).
CTRL, control period; DC, distal colon; LEfSe, Linear Discriminant Effect Size; PC, proximal colon; TR1, treatment week 1; TR3, treatment week 3.
Discussion
This study demonstrated that repeated test product supplementation resulted in enhanced saccharolytic fermentation in the simulated human intestine, as shown by the increased production of both acetate and butyrate. Clear shifts in the microbial community composition were observed following treatment with the prebiotic, probiotic and synbiotic products compared to the control, resulting in the stimulation of saccharolytic bacterial groups, including Megamonas, Bifidobacterium, and Faecalibacterium. Changes in microbial community activity and composition were most pronounced during the final week of supplementation, indicating the need of long-term product administration to obtain maximum effects, and with synbiotic supplementation compared with prebiotic or probiotic supplementation alone showing synergistic potential.
Overall, the fermentation of the test products showed similar trends in both the PC and DC compartments, with the main fermentation occurring in the PC. Base consumption was significantly increased in the PC with the prebiotic and synbiotic formulations and in the DC with the synbiotic products. With repeated prebiotic or synbiotic administration, gas levels started to decrease, suggesting that continuous supplementation might reduce the potential of adverse side effects, such as bloating, caused by prebiotics (Marteau and Seksik Citation2004). Gas production was higher with synbiotic versus prebiotic supplementation, which may indicate that long-term supplementation of the synbiotic test product results in synergistic effects on microbial metabolism and composition.
All test products stimulated saccharolytic fermentation, as evidenced by increases in health-related SCFAs, which are main byproducts of these fermentative processes (Roberfroid Citation1997; Davani-Davari et al. Citation2019). Acetate levels increased significantly with the prebiotic and both doses of the synbiotic in the PC and DC, but were unaffected by probiotic supplementation. Increases in acetate production were more pronounced at TR3 than TR1, suggesting increased benefit for long-term, repeated administration. Acetate has been shown to have metabolic effects and to play a regulatory role in body weight control and insulin sensitivity (Hernández et al. Citation2019). Additionally, it has an anti-inflammatory effect and is considered beneficial to the host (Vieira et al. Citation2017; Olsson et al. Citation2021). All test products significantly increased butyrate levels; however, the effects were mainly observed toward the end of the treatment period (TR3), indicating that repeated administration was necessary to achieve this effect. Butyrate is important for intestinal epithelial cell health, acting as the main energy source for these cells (Martin-Gallausiaux et al. Citation2021). Additionally, butyrate supports the survival of intestinal epithelial cells under stress conditions by upregulating heat shock proteins (Arvans et al. Citation2005), and improves gut barrier function by regulating tight junction assembly (Peng et al. Citation2009). When looking specifically at whether synbiotic effects were observed with combined prebiotic and probiotic supplementation, significantly enhanced butyrate production was observed in the DC following synbiotic supplementation compared with the single prebiotic or probiotic treatments. This synbiotic effect tended to be most pronounced upon administering the high dose, though did not reach statistical significance. Markers of proteolytic fermentation, particularly ammonium, tended to increase with product supplementation with the effect being most pronounced following treatment with the probiotic, indicating that the synbiotic formulation may have a beneficial effect on reducing the ammonium production compared to probiotic only supplementation. Together, these findings support the synbiotic potential of the prebiotic/probiotic combination.
When assessing changes in the microbial community composition, several interesting observations were made. Test product supplementation resulted in changes in beta diversity over time relative to control. The greater shift in beta diversity during TR3 compared with TR1 suggests a cumulative effect for long-term repeated administration of the test products. Further, we observed a consistent increase in the abundance of Bacillaceae OTU68 at TR1 and TR3 with probiotic and synbiotic supplementation, indicating engraftment of the B. coagulans lactospore probiotic and supporting that engraftment was responsible, at least in part, for the overall changes observed in this study. In general, changes in the abundance of microbial community members were most pronounced after three weeks of treatment and tended to be more pronounced with the synbiotic products compared with the prebiotic or probiotic alone. The Megamonas genus was consistently increased in abundance with synbiotic treatment, showing highest LDA scores following supplementation with the highest dose of the synbiotic in most colonic areas (except the mucosal DC), suggesting the use of these higher doses in future studies. Interestingly, Megamonas species are associated with acetate and propionate production (Sakon et al. Citation2008). The increased abundance of this genus likely contributed, at least in part, to the increased levels of acetate with the test products, which tended to be more pronounced with the synbiotic formulations reaching significance compared to the probiotic formulation. Bifidobacterium abundance was increased in the luminal and mucosal compartments of the DC, again reaching strongest effects for the synbiotic formulations as shown by the synbiotic low dose and high dose being biomarkers for the highest LDA scores in the lumen and mucus, respectively. Members of this bacterial genus are regarded as beneficial saccharolytic bacteria with versatile fiber-degrading potential, known for their ability to produce acetate (Fukuda et al. Citation2012). Bifidobacterium species thus likely played a role in the increased acetate production following product supplementation. Furthermore, an increase in Faecalibacterium levels was observed in the luminal DC for all test products, which was most pronounced for the synbiotic formulation administered at the lowest dose. Faecalibacterium are major producers of butyrate (Zou et al. Citation2021) and their increased abundance is likely responsible for the increased production of butyrate, which was more pronounced in the DC. This bacterial group is known to exert strong anti-inflammatory activity in the intestinal environment (Sokol et al. Citation2008). An increased abundance of Faecalibacterium was also reported following 28 days of B. coagulans lactospore supplementation in healthy adults (Majeed et al. Citation2023).
The findings reported herein highlight the utility of the M-SHIME® model in that the beneficial effects of test product supplementation accumulated over time, reaching maximum effects following three weeks of daily product supplementation. This demonstrates the added value of the M-SHIME® system over short-term models which are not able to evaluate extended periods of repeated product administration. However, this study was also limited in that the in vitro observations reported herein cannot necessarily translate directly to a biologic response, so follow up in vivo studies are needed to confirm any observed effects. Indeed, Bacillus coagulans MTCC 5856, for instance, has been shown in a human clinical trial to reduce gastrointestinal symptoms related with abdominal gas and distension (Majeed et al. Citation2023), which could be interesting to further evaluate also for synbiotic combinations.
In conclusion, this study found that repeated supplementation with inulin, B. coagulans lactospore, or a combination of the two over a three-week period enhanced acetate and butyrate production in a M-SHIME® model. Additionally, there was an increase in the abundance of several bacterial groups that are reported to benefit host health and were likely responsible for the observed increases in acetate and butyrate. These findings indicate that the test products, particularly in combination, have the potential to promote gut health. In general, maximum benefit of test product supplementation was observed in the final week of the study, highlighting the importance of repeated product administration and of the advantages to the long-term capability of the M-SHIME® model. These findings support a synbiotic effect of the combination of inulin and B. coagulans lactospore and indicate that the higher synbiotic dose may be most appropriate for future studies.
Authors’ contributions
Conceptualization, C.D., D.V., V.G., J.C.W.Y., M.M.; methodology, C.D., M.M., validation, C.D., formal analysis, C.D., investigation, C.D.; data curation, C.D.; writing–original draft preparation, C.D.; writing–review and editing, C.D., D.V., V.G. J.C.W.Y., M.M. All authors have read and agreed to the published version of the manuscript.
P1564_Supplemental Materials_Final.docx
Download MS Word (2.1 MB)Acknowledgements
The authors thank Sarah Bubeck, PhD, of Bubeck Scientific Communications for providing medical writing support.
Disclosure statement
V.G. and J.C.W.Y. are employees of Haleon (GSK Consumer Healthcare Pte Ltd.) D.V., was the employees of Haleon (GSK Consumer Healthcare Pte Ltd.) when the study was conducted. C.D. and M.M. have no conflicts of interest to declare. The authors alone are responsible for the content and writing of the article.
Data availability statement
The data supporting the findings of this study are available from the corresponding author on reasonable request.
Additional information
Funding
Notes on contributors
Cindy Duysburgh
Cindy Duysburgh is a bio-science engineer from background and has over 12 years of expertise in the gut microbiome field. Currently, she is holding a position as Senior Project Manager at ProDigest, focusing on long-term repeated dosing SHIME studies, in which food ingredients, probiotics, and/or pharmaceutical compounds are being investigated for their effect on the gut microbiome.
Deepapriya Velumani
Deepapriya Velumani has huge research interest in Microbiome, Supplements and anti-aging arena. Have Masters in Food science and Nutrition and have been actively participating in Nutrition research through industry associations like ILSI, Food Industry Association, Singapore Nutrition and dietetics association.
Vandana Garg
Vandana Garg is a physician by training and is passionate about bringing more science backed healthcare innovations to consumers. Vandana has worked in the healthcare industry for more than 15 years with a vast experience in medical and scientific affairs across multiple markets and therapeutic areas, in both pharmaceuticals & consumer healthcare. In her current role at Haleon, Vandana provides medical leadership on innovation and evidence generation for brands such as Centrum and Caltrate; and leads the Medical and Scientific Affairs team for Southeast Asia & Taiwan.
Jacob Weng Yew Cheong
Jacob Weng Yew Cheong is an accomplished technical expert with more than 18 years of experience in traditional, complementary, and nutritional food industries. He currently in-charge of the product development at Haleon Consumer Healthcare in Wider Asia, focusing on renowned brands like Centrum, Caltrate and Scott. A certified TCM practitioner with a background as a food scientist specializing in quality control and a master’s degree in pharmaceutical sciences and technology, Jacob is passionate about natural healing and committed to sharing this knowledge through both product development and healthcare counselling.
Massimo Marzorati
Massimo Marzorati graduated in 2003 from University of Milan (Italy) in Biotechnology. In 2007 he obtained a PhD degree in the field of microbial ecology at the University of Milan (DISTAM). In 2007 he started as a post-doctoral researcher at CMET, Ghent University (Belgium). His main research interest is the interaction between intestinal bacteria and human health. He is currently Professor at Ghent University. In 2008, he founded ProDigest, a spin-off company from Ghent University, which provides customized services in the field of gastrointestinal transit, bioavailability and metabolism, to the operators in the food and pharmaceutical industry. He is currently CEO of the company.
References
- Arvans DL, Vavricka SR, Ren H, Musch MW, Kang L, Rocha FG, Lucioni A, Turner JR, Alverdy J, Chang EB. 2005. Luminal bacterial flora determines physiological expression of intestinal epithelial cytoprotective heat shock proteins 25 and 72. Am J Physiol Gastrointest Liver Physiol. 288(4):G696–704. doi: 10.1152/ajpgi.00206.2004.
- Bull MJ, Plummer NT. 2014. Part 1: the human gut microbiome in health and disease. Integr Med (Encinitas). 13(6):17–22.
- Davani-Davari D, Negahdaripour M, Karimzadeh I, Seifan M, Mohkam M, Masoumi SJ, Berenjian A, Ghasemi Y. 2019. Prebiotics: definition, types, sources, mechanisms, and clinical applications. Foods. 8(3):92. doi: 10.3390/foods8030092.
- De Weirdt R, Possemiers S, Vermeulen G, Moerdijk-Poortvliet TC, Boschker HT, Verstraete W, Van de Wiele T. 2010. Human faecal microbiota display variable patterns of glycerol metabolism. FEMS Microbiol Ecol. 74(3):601–611. doi: 10.1111/j.1574-6941.2010.00974.x.
- de Wiele TV, Boon N, Possemiers S, Jacobs H, Verstraete W. 2004. Prebiotic effects of chicory inulin in the simulator of the human intestinal microbial ecosystem. FEMS Microbiol Ecol. 51(1):143–153. doi: 10.1016/j.femsec.2004.07.014.
- Duysburgh C, Van den Abbeele P, Krishnan K, Bayne TF, Marzorati M. 2019. A synbiotic concept containing spore-forming Bacillus strains and a prebiotic fiber blend consistently enhanced metabolic activity by modulation of the gut microbiome in vitro. Int J Pharm X. 1:100021. doi: 10.1016/j.ijpx.2019.100021.
- Fukuda S, Toh H, Taylor TD, Ohno H, Hattori M. 2012. Acetate-producing bifidobacteria protect the host from enteropathogenic infection via carbohydrate transporters. Gut Microbes. 3(5):449–454. doi: 10.4161/gmic.21214.
- Gibson GR, Hutkins R, Sanders ME, Prescott SL, Reimer RA, Salminen SJ, Scott K, Stanton C, Swanson KS, Cani PD, et al. 2017. Expert consensus document: The International Scientific Association for Probiotics and Prebiotics (ISAPP) consensus statement on the definition and scope of prebiotics. Nat Rev Gastroenterol Hepatol. 14(8):491–502. doi: 10.1038/nrgastro.2017.75.
- Hernández MAG, Canfora EE, Jocken JWE, Blaak EE. 2019. The short-chain fatty acid acetate in body weight control and insulin sensitivity. Nutrients. 11(8):1943. doi: 10.3390/nu11081943.
- Hill C, Guarner F, Reid G, Gibson GR, Merenstein DJ, Pot B, Morelli L, Canani RB, Flint HJ, Salminen S, et al. 2014. Expert consensus document. The International Scientific Association for Probiotics and Prebiotics consensus statement on the scope and appropriate use of the term probiotic. Nat Rev Gastroenterol Hepatol. 11(8):506–514. doi: 10.1038/nrgastro.2014.66.
- Hoefman S, Pommerening-Röser A, Samyn E, De Vos P, Heylen K. 2013. Efficient cryopreservation protocol enables accessibility of a broad range of ammonia-oxidizing bacteria for the scientific community. Res Microbiol. 164(4):288–292. doi: 10.1016/j.resmic.2013.01.007.
- Hughes RL, Alvarado DA, Swanson KS, Holscher HD. 2022. The prebiotic potential of inulin-type fructans: a systematic review. Adv Nutr. 13(2):492–529. doi: 10.1093/advances/nmab119.
- Jombart T. 2008. adegenet: a R package for the multivariate analysis of genetic markers. Bioinformatics. 24(11):1403–1405. doi: 10.1093/bioinformatics/btn129.
- Jombart T, Devillard S, Balloux F. 2010. Discriminant analysis of principal components: a new method for the analysis of genetically structured populations. BMC Genet. 11(1):94. doi: 10.1186/1471-2156-11-94.
- Klindworth A, Pruesse E, Schweer T, Peplies J, Quast C, Horn M, Glöckner FO. 2013. Evaluation of general 16S ribosomal RNA gene PCR primers for classical and next-generation sequencing-based diversity studies. Nucleic Acids Res. 41(1):e1–e1. doi: 10.1093/nar/gks808.
- Kozich JJ, Westcott SL, Baxter NT, Highlander SK, Schloss PD. 2013. Development of a dual-index sequencing strategy and curation pipeline for analyzing amplicon sequence data on the MiSeq Illumina sequencing platform. Appl Environ Microbiol. 79(17):5112–5120. doi: 10.1128/AEM.01043-13.
- Love MI, Huber W, Anders S. 2014. Moderated estimation of fold change and dispersion for RNA-seq data with DESeq2. Genome Biol. 15(12):550. doi: 10.1186/s13059-014-0550-8.
- Majeed M, Nagabhushanam K, Mundkur L, Paulose S, Divakar H, Rao S, Arumugam S. 2023. Probiotic modulation of gut microbiota by Bacillus coagulans MTCC 5856 in healthy subjects: a randomized, double-blind, placebo-control study. Medicine (Baltimore). 102(20):e33751. doi: 10.1097/MD.0000000000033751.
- Majeed M, Nagabhushanam K, Paulose S, Arumugam S, Mundkur L. 2023. The effects of Bacillus coagulans MTCC 5856 on functional gas and bloating in adults: a randomized, double-blind, placebo-controlled study. Medicine (Baltimore). 102(9):e33109. doi: 10.1097/MD.0000000000033109.
- Markowiak P, Śliżewska K. 2017. Effects of probiotics, prebiotics, and synbiotics on human health. Nutrients. 9(9):1021. doi: 10.3390/nu9091021.
- Marteau P, Seksik P. 2004. Tolerance of probiotics and prebiotics. J Clin Gastroenterol. 38(6 Suppl):S67–S69. doi: 10.1097/01.mcg.0000128929.37156.a7.
- Martin-Gallausiaux C, Marinelli L, Blottière HM, Larraufie P, Lapaque N. 2021. SCFA: mechanisms and functional importance in the gut. Proc Nutr Soc. 80(1):37–49. doi: 10.1017/S0029665120006916.
- Marzorati M, Abbeele PVD, Bubeck SS, Bayne T, Krishnan K, Young A, Mehta D, DeSouza A. 2020. Bacillus subtilis HU58 and Bacillus coagulans SC208 probiotics reduced the effects of antibiotic-induced gut microbiome dysbiosis in an M-SHIME((R)) model. Microorganisms. 8(7):1028. doi: 10.3390/microorganisms8071028.
- Marzorati M, Van den Abbeele P, Bubeck S, Bayne T, Krishnan K, Young A. 2021. Treatment with a spore-based probiotic containing five strains of Bacillus induced changes in the metabolic activity and community composition of the gut microbiota in a SHIME(R) model of the human gastrointestinal system. Food Res Int. 149:110676. (doi: 10.1016/j.foodres.2021.110676.
- Miller JM, Cullingham CI, Peery RM. 2020. The influence of a priori grouping on inference of genetic clusters: simulation study and literature review of the DAPC method. Heredity (Edinb). 125(5):269–280.). doi: 10.1038/s41437-020-0348-2.
- Molly K, Vande Woestyne M, Verstraete W. 1993. Development of a 5-step multi-chamber reactor as a simulation of the human intestinal microbial ecosystem. Appl Microbiol Biotechnol. 39(2):254–258. doi: 10.1007/BF00228615.
- Olsson A, Gustavsen S, Nguyen TD, Nyman M, Langkilde AR, Hansen TH, Sellebjerg F, Oturai AB, Bach S. 2021. H. serum short-chain fatty acids and associations with inflammation in newly diagnosed patients with multiple sclerosis and healthy controls. Front Immunol. 12:661493. doi: 10.3389/fimmu.2021.661493.
- Pandey KR, Naik SR, Vakil BV. 2015. Probiotics, prebiotics and synbiotics – a review. J Food Sci Technol. 52(12):7577–7587. doi: 10.1007/s13197-015-1921-1.
- Peng L, Li ZR, Green RS, Holzman IR, Lin J. 2009. Butyrate enhances the intestinal barrier by facilitating tight junction assembly via activation of AMP-activated protein kinase in Caco-2 cell monolayers. J Nutr. 139(9):1619–1625. doi: 10.3945/jn.109.104638.
- Rauch CE, Mika AS, McCubbin AJ, Huschtscha Z, Costa RJS. 2022. Effect of prebiotics, probiotics, and synbiotics on gastrointestinal outcomes in healthy adults and active adults at rest and in response to exercise-a systematic literature review. Front Nutr. 9:1003620. doi: 10.3389/fnut.2022.1003620.
- Roberfroid MB. 1997. Health benefits of non-digestible oligosaccharides. Adv Exp Med Biol. 427:211–219. doi: 10.1007/978-1-4615-5967-2_22.
- Sakon H, Nagai F, Morotomi M, Tanaka R. 2008. Sutterella parvirubra sp. nov. and Megamonas funiformis sp. nov., isolated from human faeces. Int J Syst Evol Microbiol. 58(Pt 4):970–975. doi: 10.1099/ijs.0.65456-0.
- Sasaki K, Sasaki D, Inoue J, Hoshi N, Maeda T, Yamada R, Kondo A. 2020. Bacillus coagulans SANK 70258 suppresses Enterobacteriaceae in the microbiota of ulcerative colitis in vitro and enhances butyrogenesis in healthy microbiota. Appl Microbiol Biotechnol. 104(9):3859–3867. doi: 10.1007/s00253-020-10506-1.
- Schloss PD, Westcott SL. 2011. Assessing and improving methods used in operational taxonomic unit-based approaches for 16S rRNA gene sequence analysis. Appl Environ Microbiol. 77(10):3219–3226. doi: 10.1128/AEM.02810-10.
- Schrezenmeir J, de Vrese M. 2001. Probiotics, prebiotics, and synbiotics–approaching a definition. Am J Clin Nutr. 73(2 Suppl):361S–364S. doi: 10.1093/ajcn/73.2.361s.
- Segata N, Izard J, Waldron L, Gevers D, Miropolsky L, Garrett WS, Huttenhower C. 2011. Metagenomic biomarker discovery and explanation. Genome Biol. 12(6):R60. doi: 10.1186/gb-2011-12-6-r60.
- Sokol H, Pigneur B, Watterlot L, Lakhdari O, Bermúdez-Humarán LG, Gratadoux J-J, Blugeon S, Bridonneau C, Furet J-P, Corthier G, et al. 2008. Faecalibacterium prausnitzii is an anti-inflammatory commensal bacterium identified by gut microbiota analysis of Crohn disease patients. Proc Natl Acad Sci USA. 105(43):16731–16736. doi: 10.1073/pnas.0804812105.
- Van den Abbeele P, Belzer C, Goossens M, Kleerebezem M, De Vos WM, Thas O, De Weirdt R, Kerckhof FM, Van de Wiele T. 2013. Butyrate-producing Clostridium cluster XIVa species specifically colonize mucins in an in vitro gut model. ISME J. 7(5):949–961. doi: 10.1038/ismej.2012.158.
- Van den Abbeele P, Kamil A, Fleige L, Chung Y, De Chavez P, Marzorati M. 2018. Different oat ingredients stimulate specific microbial metabolites in the gut microbiome of three human individuals in vitro. ACS Omega. 3(10):12446–12456. doi: 10.1021/acsomega.8b01360.
- Van den Abbeele P, Roos S, Eeckhaut V, MacKenzie DA, Derde M, Verstraete W, Marzorati M, Possemiers S, Vanhoecke B, Van Immerseel F, et al. 2012. Incorporating a mucosal environment in a dynamic gut model results in a more representative colonization by lactobacilli. Microb Biotechnol. 5(1):106–115. doi: 10.1111/j.1751-7915.2011.00308.x.
- Vandeputte D, Falony G, Vieira-Silva S, Wang J, Sailer M, Theis S, Verbeke K, Raes J. 2017. Prebiotic inulin-type fructans induce specific changes in the human gut microbiota. Gut. 66(11):1968–1974. doi: 10.1136/gutjnl-2016-313271.
- Vandeputte D, Kathagen G, D’Hoe K, Vieira-Silva S, Valles-Colomer M, Sabino J, Wang J, Tito RY, De Commer L, Darzi Y, et al. 2017. Quantitative microbiome profiling links gut community variation to microbial load. Nature. 551(7681):507–511. doi: 10.1038/nature24460.
- Vieira AT, Galvão I, Macia LM, Sernaglia ÉM, Vinolo MAR, Garcia CC, Tavares LP, Amaral FA, Sousa LP, Martins FS, et al. 2017. Dietary fiber and the short-chain fatty acid acetate promote resolution of neutrophilic inflammation in a model of gout in mice. J Leukoc Biol. 101(1):275–284. doi: 10.1189/jlb.3A1015-453RRR.
- Wang Q, Garrity GM, Tiedje JM, Cole JR. 2007. Naive Bayesian classifier for rapid assignment of rRNA sequences into the new bacterial taxonomy. Appl Environ Microbiol. 73(16):5261–5267. doi: 10.1128/AEM.00062-07.
- Weiss GA, Hennet T. 2017. Mechanisms and consequences of intestinal dysbiosis. Cell Mol Life Sci. 74(16):2959–2977. doi: 10.1007/s00018-017-2509-x.
- Zou Y, Lin X, Xue W, Tuo L, Chen MS, Chen XH, Sun CH, Li F, Liu SW, Dai Y, et al. 2021. Characterization and description of Faecalibacterium butyricigenerans sp. nov. and F. longum sp. nov., isolated from human faeces. Sci Rep. 11(1):11340. doi: 10.1038/s41598-021-90786-3.