
 ?Mathematical formulae have been encoded as MathML and are displayed in this HTML version using MathJax in order to improve their display. Uncheck the box to turn MathJax off. This feature requires Javascript. Click on a formula to zoom.
ABSTRACT
Contemporary organizations often employ signature-based network intrusion detection systems to increase the security of their computer networks. The effectiveness of a signature-based system primarily depends on the quality of the rules used to associate system events to known malicious behavior. However, the variables that determine the quality of rulesets is relatively unknown. This paper empirically analyzes the detection probability in a test involving Snort for 1143 exploitation attempts and 12 Snort rulesets created by the Emerging Threats Labs and the Sourcefire Vulnerability Research Team. The default rulesets from Emerging Threats raised priority-1-alerts for 39% of the exploit attempts compared to 31% for rulesets from the Vulnerability Research Team. The following features predict detection probability: if the exploit is publicly known, if the ruleset references the exploited vulnerability, the payload, the type of software targeted, and the operating system of the targeted software. The importance of these variables depends on the ruleset used and whether default rules are used. A logistic regression model with these variables classifies 69–92% of the cases correctly for the different rulesets.
1. Introduction
Network-based intrusion detection systems (NIDSs) are commonly used in organizations. They can serve both as a real-time tool to prevent ongoing cyber-attacks and as a support to forensic analyses or incident handling performed after an intrusion has occurred.
Contemporary NIDS solutions are categorized as two types. The first type of NIDS holds a database describing the normal state of a network (assumed secure) and tries to identify when the network deviates from this normal state. This category is often called anomaly based detection (Khraisat et al., Citation2019) or occasionally behavior-based detection (Debar et al., Citation1999). The second type of NIDS builds on rules and raises alerts when events known to be associated with threats are observed in the network. This type of NIDS is often called signature-based detection (Khraisat et al., Citation2019) but has also been referred to as misuse detection (Kumar & Spafford, Citation1994) or knowledge-based detection (Debar et al., Citation1999).
Signature-based detection has important practical advantages. First, the more popular signature-based solutions, such as Snort (Roesch, Citation1999), have active communities and/or vendors that supply signature databases. These can often be directly applied to an organization’s own NIDS. Thus, unlike anomaly based solutions, which must be trained with data from the organization, it is easy to outsource the maintenance of the solution and base it on available threat intelligence. Second, many signature-based solutions describe rules with well-documented high-level domain-specific languages. It is therefore relatively straightforward to understand rules, write new rules, and adapt existing rules to the own organization when needed. Third, signature-based solutions do not only raise an alert when a threat has occurred but are also able to specify what the threat is. This makes it relatively straightforward to investigate the issue further and determine what to do about it.
Signature-based detection solutions also have weaknesses. Interviews with system administrators have revealed that considerable system expertise is required to tune the NIDS so that the number of false positives is reduced and the probability of detecting attacks is reasonable (Werlinger et al., Citation2008), (Goodall et al., Citation2009), (Sommestad et al., Citation2013). The problem with false positives is substantial. For example, Tjhai et al. (Citation2008) reported that 96% of the alerts were false positives in a test where Snort monitored a university’s web server, Sommestad and Franke (Citation2015) reported that greater than 98% of the alerts Snort produced during a cyber security exercise were false positives, and Cotroneo et al. (Citation2019) refers to analyses were 99% of the alerts are false positives. The problem of detecting attacks is also considerable and a frequent argument against signature-based NIDSs and for the use of anomaly based alternatives is that signature-based solutions are poor at detecting undisclosed (zero-day) exploits (Liao et al., Citation2013)(Patcha & Park, Citation2007)(Holm, Citation2014) (Khraisat et al., Citation2019). Because of this, a many scholars have focused on anomaly based intrusion detection (Khraisat et al., Citation2019). However, as will be described in below, it is not known when a signature-based NIDS will perform well and when it will not, and to what extent they are capable of detecting undisclosed exploits. Clearly, a system administrator making decisions concerning the use an NIDS would benefit from knowing what type of attacks it can be expected to detect.
This paper studies how the detection probability of the NIDS Snort is associated with variables associated with the exploit code, the targeted software, and the ruleset. The assessment was made by executing 267 exploits dated between 2008 and 2019 with different targets and payloads, producing 1143 tests cases. Snort rulesets released between 2011 and 2019 and developed by the Emerging Threats Lab (ET) and Sourcefire Vulnerability Research Team (VRT) were employed for the analyses.
The remainder of the paper is structured as follows. Section 2 describes existing ideas concerning detection capabilities of signature-based NIDS, previous work related to these ideas, and presents hypotheses that are tested in the current paper. This is followed by a description of materials and methods used to perform the test the hypotheses in section 3. Section 4 describes the results and section 5 discusses the results.
2. Related work and hypotheses
The body of research that addresses NIDS is considerable. For instance, the database Scopus contains more than 2000 records matching the phrase “network intrusion detection system” or the phrase “network-based intrusion detection system.” Few of these records present comprehensive models on describing variables that are associated with the efficacy or usefulness of signature-based NIDS. This section presents nine hypotheses related to detection probability drawn from previous tests, the use of threat intelligence in intrusion detection, and research the focus on specific software and protocols.
2.1. Previous tests of rules and rulesets
First, the design of signature-based NIDS and the presence of different rulesets makes it natural to expect that different rulesets will have different capabilities. Thus, detection probability ought to depend on the rule set used.
Detection probability is dependent on the ruleset used.(Hypothesis 1)
This hypothesis is well established and clearly holds true. However, no formal tests can be found of different rulesets. The literature contains a number of more or less realistic tests of signature-based NIDS that assess detection probability. These tests are limited to a few attacks and a few NIDS solutions. More importantly, they only investigate how attack type, hardware, and NIDS-software influence detection capabilities. For example, the test performed by Erlacher and Dressler (Citation2018) on Snort focus explicitly on HTTP traffic and the tests performed in Milenkoski et al. (Citation2015) are limited to attacks on a specific web server. Other research look at rulesets but do not focus on detection capability. For instance, Nyasore et al. (Citation2020) evaluate the overlap between different rules in two rulesets for the popular NIDS called Snort. Thus, differences between different rulesets have not been explicitly tested.
To the authors’ knowledge, the only previous works that explicitly evaluate how different variables influence detection probability are those by Holm (Citation2014), Raftopoulos and Dimitropoulos (Citation2013). Holm (Citation2014) tested how much lower the detection probability when the creators of a ruleset do not know about the vulnerability that is exploited. Raftopoulos and Dimitropoulos (Citation2013) tested how detection probability relates to characteristics of specific rules, such as fields that are checked.
On the other hand, a considerable number of ideas have been documented on how to automatically develop rules for NIDS, and thereby give hints of things that ought to predict a ruleset’s ability to detect different attacks. Ideas on automated rule generation can be traced back to early 2000 (Levine et al., Citation2003). Many papers on automated rule generation focus on the detection of activity performed after a vulnerability has been exploited (e.g., connecting to command-and-control networks (Zand et al., Citation2014)), performance improvements (e.g., using field programmable gate arrays (Hieu et al., Citation2013)), or the creation of new rules by aggregation of existing rules (e.g., by correlating alerts from different NIDSs (Vasilomanolakis et al., Citation2015)). These contributions are beyond the scope of the study described in this paper as they concern-specific solutions that are not (yet) used by most practitioners. Nevertheless, we were able to identify a number of contributions describing methods for constructing rules to detect actual exploits. These methods can be divided into two broad categories.
Solutions relying on knowledge or data on known or suspected attacks, i.e., threat intelligence.
Solutions built to generate signatures for a certain type of software or protocol, e.g., web applications.
These are described further below together with related hypotheses.
2.2. Variables related to threat intelligence
Many ideas have been presented on how to use information about known or suspected attacks, i.e., some form of threat intelligence, to improve intrusion detection. For instance, a number of proposals on the correlation of IDS alerts based on some model of the threat have been presented (Hofmann & Sick, Citation2011) (Shittu et al., Citation2015) (Ramaki et al., Citation2015)(Mahdavi et al., Citation2020). When it comes to specific signatures that generate IDS alerts, a number of factors related to threat intelligence are worth noting.
First, a number of research efforts have demonstrated how traffic traces with malicious code that contain actual exploit code in transit can be used to produce rules. For instance, Wuu et al. (Citation2007) used a dataset they had produced themselves, Portokalidis et al. (Citation2006) used data from a honeypots, Khamphakdee et al. (Citation2014) used the Darpa dataset and Lee et al. (Citation2018) used malware samples. These ideas involve a “ground truth” stating the part of the traffic that is benign and malicious. They thereby suggest that it is easier to generate signatures when the malicious traffic is known, i.e. when the exploit is readily available.
Detection probability is higher for disclosed exploits than for undisclosed (zero-day) exploits.(Hypothesis 2)
It should be noted that there might be cases where this notion is not the case. In particular, it is sufficient that future attacks can be predicted to create signatures that detect attacks. For instance, some solutions use knowledge about known vulnerabilities to identify potential exploit codes automatically (Chandrasekaran et al., Citation2006). The test described by Holm (Citation2014) confirms that knowledge about attacks is of relevance but not necessary. More specifically, previously unknown attacks were detected if they involved requests that concerned files or commands known to be sensitive, contained a sequence of no-operation-instructions, or interacted with an authentication mechanism (Holm, Citation2014).
Second, the amount of time that traffic traces and other information about attacks have been available can be expected to increase detection probability. Gascon et al. (Citation2011) refer to this as the “NIDS-Exploit update delay,” and found that the median delay was 146 days in a sample they analyzed.
Detection probability increases as the number of days an exploit has been known increases.(Hypothesis 3)
There are reasons to question this hypothesis, too. The number of attacks has been found to peak immediately after the public release of a vulnerability with little activity long before and after the “day zero” (Bilge & Dumitras, Citation2012). Thus, while traffic traces from the days immediately after the release of an exploit code ought to be useful, traffic traces years after the release may add little in terms of threat intelligence.
Third, NIDS rules occasionally have an explicit reference to the exploit or vulnerability target it covers. In this case, it should be more effective as the attack undoubtedly is known and considered relevant by the rule’s creator.
Detection probability is higher when the exploited vulnerability is referenced in the signatures.(Hypothesis 4)
Fourth, exploits typically carry a payload with instructions that are to be executed on the targeted machine, e.g., some piece of software to be executed. Attackers usually want certain functions in these payloads, and they are therefore reused between attacks. Some research addresses this and develops signatures searching for payloads in network traffic. For instance, Rubin et al. (Citation2004) present a method to thwart methods that attempt to split the payload in several TCP packets. Thus, knowledge about the payload carried by an exploit and the way it is transferred to the target is also relevant. In particular, payloads associated with maliciousness should raise alerts when benign nonsense payloads do not.
Detection probability is lower when payloads with nonsense content (e.g., a debug trap) are used.(Hypothesis 5)
In summary, various knowledge about exploits and payloads ought to increase the probability that an attack is detected by a NIDS.
2.3. Variables related of software and protocol
A number of ideas have been presented on the use of context information such as network topology in intrusion detection, e.g., the work by Mitchell and Chen (Citation2015) and Pan et al. (Citation2019). Similarly, solutions for generating rules are often limited to a certain type of software or a specific protocol. For instance, Nivethan and Papa (Nivethan & Papa, Citation2016) identified rules for SCADA-software, Nadler et al. (Citation2019)) focus on rules for the DNS protocol , and Garcia-Teodoro et al. (Citation2015) generate rules for the HTTP protocol. These proposals occasionally make use of knowledge related to the software and identify events that would be potential threats. For instance, a command sent to a server software prior to a login is considered suspicious in the research by Tran et al. (Citation2012).
It is not apparent which protocols and software producers of rules for NIDS focus on. However, it is reasonable to expect that they will focus on protocols and software that is frequently used by attackers in network-based attacks. Given their exposure to external traffic, web applications and web browsers are two examples of software that is expected to be prioritized. In line with this, Snort has special support for decoding and normalizing http traffic, suggesting that it should cope with such exploits better.
Detection probability is higher than average for attacks on web browsers.(Hypothesis 6)
Detection probability is higher than average for attacks on web applications.(Hypothesis 7)
The test performed by Holm (Citation2014) provides reasons to doubt these hypotheses. It reported a relatively low detection probability for http-based attacks compared to other types of protocols. A possible reason for this result is that those attacks were encrypted with https in the test of Holm (Citation2014), and therefore impossible to process for the NIDS.
The targeted software platform also may influence how well signatures detect attacks because the platform may require a particular code and other variables correlate with the software platform. In particular, software can vary in their popularity for both users and attackers. Signature developers are likely to prioritize the more popular, vulnerable, and critical software. The research on rule generation for SCADA-based systems is an example of this notion. Based on the widespread use of Windows-based operating systems, we theorize that signature producers will focus more on attacks targeting this platform.
Detection probability is higher than average for attacks targeting windows machine.(Hypothesis 8)
Based on the same reasoning, we expect that rules will focus on the more popular software versions. For instance, software versions for English users is expected to receive more attention from signature producers than software versions for Norwegian users. It is difficult and complex to quantify the popularity of different software versions over the period addressed in this study. However, we therefore settle with the claim that software versions will be associated with probability of detection.
Detection probability depends on the version of the software being exploited.(Hypothesis 9)
3. Materials and methods
This test launched exploits against virtual machines deployed in CRATE, a cyber range operated by the Swedish Defense Research Agency. Traffic recorded from this process was fed to different instances of Snort to obtain data on which cases were detected. The sections below describe the database of exploits, signature databases, test procedure, operationalization of variables, and statistical analysis.
3.1. Sample of exploits
The test used exploits modules that are part of the Metasploit Framework and provide privileges on the targeted machine when they are successful. The Metasploit Framework has since long been one of the most renowned platforms for managing cyber-attacks (Ramirez-Silva & Dacier, Citation2007) and offers a database of exploits that can be considered as representative for contemporary cyber threats. In fact, a clear link has been established between availability of exploits for the Metasploit Framework and their use in cyber-attacks (Ramirez-Silva & Dacier, Citation2007). The database used in this research, which is dated spring 2019, contains a total of 1867 exploit modules that provide privileges on the targeted machine.
The number of exploits required for this test was determined based on power calculations on the number of exploits from the years 2008–2019 needed to make statements on the relevance of exploits being publicly known (i.e., hypothesis 2). Exploits were selected to be representative of the exploits types in Metasploit (e.g., “linux/http”) and to be considered relevant for a network-based NIDS. The latter means that the exploit needs to be associated with a specific network communication pattern. Consequently, file format exploits, such as malicious PDF-files targeting a PDF-reader, which can be delivered to the vulnerable machine in many ways, were considered out of scope. Local exploits, typically elevating privileges on a machine, were also excluded since they are typically not associated with network communication.
Altogether, 267 exploit modules satisfying the abovementioned conditions were selected for inclusion using stratified randomization, with the years used as strata to ensure a good distribution over the 2008–2019. Most exploits can be set to target different types of software and use different payloads. Each exploit was executed against all available targets to enable assessments of whether software version matters. Three payloads were randomly selected for each exploit configuration to allow analysis of whether the payload matters.
3.2. Test control
The 267 exploits targeted a wide variety of ports and services. Instead of obtaining all the vulnerable products and installing them in a test environment, the exploits were changed such that they would behave properly when they interacted with a generic target responding with the right protocol on the right port. Some exploits contained checks that would abort execution if the target did not match a predefined pattern (e.g., responding with a certain web browser version), and some contained a nontrivial two way-interaction (e.g., involving the use of session-ID in a web request). Code was inserted to ensure that the exploits would execute if a vulnerable target machine were on the other side regardless of whether this was the case. For instance, if-statements requiring specific banners in the responses of the target machine were removed and a simple string was used as session ID if the exploit did not receive as proper session ID from the simulated server.
A few sampled exploits were too complicated to revise in a reliable manner. For instance, an SMB-implementation no longer available on the market required for the exploit windows/smb/timbuktu_plughntcommand_bof proved too difficult to simulate. For every abandoned exploit module, a new module from the same year was randomly selected.
In addition to these changes, code was added to the exploits that logged when the exploits sent nonmalicious traffic (e.g., connected to a server) and malicious traffic (e.g., overflowed a buffer). This process enabled verification of the execution and simplified the matching between exploits and alerts.
All exploits were executed against one of three types of machines that were chosen depending on the requirements by the exploit. The three machines were a Linux-based server, a Windows-based server, and Windows machine running a web browser. Twenty instances of each machine type were deployed in CRATE. For example, web server attacks targeted an apache web server running on the Linux machine type, and web browser attacks targeted Internet Explorer running in the Windows client machine type. Many server-side attacks only involved simple one-way interaction with the target machine. All such exploits targeted the Linux machine type, which was preconfigured to respond to TCP and UDP requests on all targeted ports.
3.3. NIDS and rulesets
This test used the NIDS Snort for the tests. Snort is one of the more popular NIDSs (Bhosale & Mane, Citation2015), is signature-based, has had an active community for more than a decade, and has used the same format for signatures for a long time. These features made it possible to compare rulesets produced at different points in time with each other and to compare rulesets produced by different parts of the community with each other.
Unfortunately, there is no publicly available repository of old rulesets. To facilitate the tests, this project collected rulesets available through old versions of security-related Linux distributions (e.g., Security Onion) and Internet repositories. Thus, the selected rulesets are considered a convenience sample of rules. Rulesets dated approximately 1 year in-between were included. It should be noted that the Snort Community rules were also retrieved and tested. However, these rulesets were excluded from further analysis as they only detected between 0% and 2% of the tested attacks.
describes the rulesets used in the tests. Each ruleset had a number of rules that were disabled potentially because they were no longer deemed as relevant to the typical user or caused too many false positives. Tests were performed both with and without these rules activated.
Table 1. Rulesets used in the tests.
The rulesets from VRT and ET were used with version 2.9.9.0 of Snort (dated 2016). A few ET rules (at most eight rules from a single ruleset) were removed to ensure compatibility with the Snort version used in the test. These removed rules concerned situations outside of the scope of this test (e.g., attacks from 2006) and their absence is not believed to influence the results or conclusions from the study in any significant manner. Furthermore, Snort is shipped with a set of preprocessing rules. As this study only is concerned with the rulesets in , preprocessor rules were disabled.
Two other Snort versions with and without the preprocessor rules were tested to ensure that the preprocessor and signature database were independent from each other with respect to producing alerts: versions 2.9.2.1 (dated 2012) and 2.9.12 (dated 2018). Our tests showed that the Snort versions produced the same results without the preprocessor rules enabled and that the influence of preprocessor rules was stable across the three tested versions. The preprocessor increased the probability of priority-1-alert by 1%, priority-2-alerts by 12%, and priority-3-alerts by 11%.
3.4. Test procedure
All tests were performed according to a standardized procedure implemented in the test platform SVED (Holm & Sommestad, Citation2016) in the cyber range CRATE. SVED allows automated execution and logging of graphs of connected actions, such as attacks, in CRATE.
Server-side exploits were triggered by simply sending the traffic to the server machine; client-side exploits (exclusively web browser exploits) were triggered by commanding the target machine to access a particular URL using the web browser. The target machine was reset into a known responsive state and traffic recordings were restarted before each exploit was executed.
The recorded traffic was replayed to the different versions of Snort and rulesets listed in . SVED’s logs enabled straightforward comparisons between the carried out attacks and the alerts produced by Snort. As a part of this comparison, IP addresses and timestamps were checked to ensure that alerts were generated for the attack in question and not for some background traffic, such as a network broadcast in the cyber range.
3.5. Variables and their operationalizations
The present study employed alerts produced by Snort as the dependent variable. More specifically, the priority level of an alert was used as a coarse and generic marker for its relevance.
Snort associates its alerts with three priority levels. In Snort, a priority-1-alert signifies “dangerous and harmful attacks”; a priority-2-alert signifies “suspicious signatures potentially preparing attacks”; a priority-3-alert signifies “unusual traffic not identified as dangerous.” Priority-1-alerts match the exploits executed in this test best because they will access privileges of some type (e.g., administrator) when they are successful. Consequently, they are used as the main dependent variable in this paper: the attack is classified as detected if the Snort raises a priority-1-alert. The independent variables believed to influence detection probability were operationalized as follows:
The attack was considered as disclosed (hypothesis 2) if the ruleset was dated after the release date of the exploit module.
The time the exploit had been public (hypothesis 3) was measured as the time difference between the ruleset’s release date and exploit module’s release date.
The attack was considered referenced by the ruleset (hypothesis 4) if the exploited vulnerability’s CVE code was mentioned in one of the active rules of the tested ruleset.
Payloads containing a debug trap or custom command (set as a file listing command in the test) were considered (benign) nonsense payloads (hypothesis 5).
If the target was a web browser, web application, or a windows machine (hypothesis 6–8) was determined based on the exploit module’s name.
Each target of an exploit module in the Metasploit Framework is considered an attack against a different software version (hypothesis 9).
All these operationalizations relate to the execution of one exploit module with certain settings and one ruleset configured in a certain manner.
3.6. Statistical analysis
The purpose of this paper is to test nine hypotheses related to NIDS. All these hypotheses concern two variables: detection probability and another variable believed to predict detection probability. Consequently, bivariate analysis was primarily used to test these hypotheses. The following statistical methods were used: Pearson correlations, paired difference tests, Wilcoxon signed-rank test, and mean differences between cases in different groups.
Bivariate analyses provide a straight answer the hypotheses. However, they do not reveal the relative importance of the variables or how well the whole set of variables explained in attacks are detected. In addition, they do not control for other variables. A multivariate analysis was performed to assess their relative importance and to assess whether the hypotheses hold when other variables are controlled for. The multivariate analysis was mainly conducted using a logistic regression model. A logistic regression model estimates how each of the predictor variables in variables influence probability of detection given the assumption that all other variables are kept constant. The outputs are variable weights in terms of odds-ratios, i.e., quotas between the odds that alerts are produced with and without the predictor variables as true. Thus, logistic regression both tests whether hypotheses hold when other variables are kept constant and estimate their effect size. Nevertheless, some aspects need to be considered in this analysis.
First, as with many statistical tests, logistic regression requires that the observations are independent from each other. In this test, one should expect that rulesets become better as they evolve and that producers rarely remove rules that work well. Logistic regression analyses were performed separately for each ruleset to mitigate this dependence.
Second, multicollinearity, i.e., associations between the predictor variables, is another issue to consider, as it could distort the relative importance of the predictors. For instance, hypotheses 2 and 4 both relate to how well the signature database can be expected cover an exploit code. In the data, these independent variables are clearly related to each other (r = −0.36). Fortunately, all inflation factors are less than 1.7, indicating that standard errors for coefficients are at max 30% larger than they would be with completely independent variables.
Third, the multinomial nature of the variable associated with the version of the software makes it difficult to fit into a regression model. For this reason, this variable was not included in the multivariate analysis.
The statistical software MedCalc was used for both bivariate tests and to test the logistic regression model. The logistic regression model’s fit with the data were measured as percent correct classified events, Nagelkerke’s R2 ), and the area under the ROC curve. A p-value of 0.05 is considered significant, and 0.5 was used as the cutoff value for classifications.
4. Results
This section first presents bivariate analyses testing each of the nine hypotheses. This is followed by the multivariate analysis testing whether the hypotheses hold when other variables are controlled for.
4.1. Ruleset
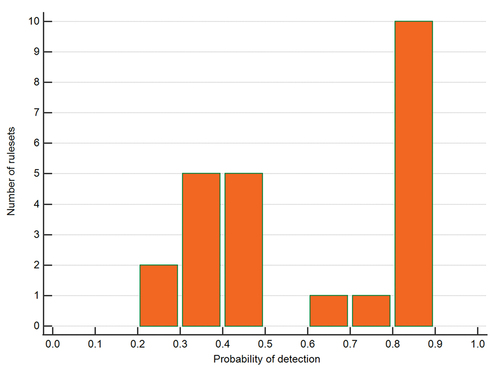
Hypothesis 1 makes the uncontroversial claim that different rulesets will have different detection capabilities. The detection probability for the included rulesets differs, as depicted in . The mean detection probability for ET is 39% with default rules and 87% with all rules activated. The mean detection probability for VRT is 31% with default rules and 74% with all rules activated. Thus, there are clearly differences, and hypothesis 1 is supported.
Figure 1. Number of rulesets associated with different probability of detection for the attacks.
4.2. Disclosed and undisclosed attacks
Overall, alerts for exploits codes dated before the ruleset are more likely. The dataset contains 20,064 cases where one ruleset is dated before the attack and one is dated after the attack. For instance, for each execution of the exploit “linux/http/symantec_web_gateway_restore” (dated December 2014), there are five default ET rulesets produced before the attack and 5 dated after the attack. details how the detection of the 20,064 cases depends on whether they are zero-days not.
Table 2. Number of cases detected given that the attack code pre-dates the signatures (i.e. is a zero-day) or not.
As the table illustrates, there are only 48 rules released before the attack’s disclosure raises alerts that are not raised by later rulesets, while the opposite is true in 2,405 cases. Overall, the probability of detection is 12% higher for publicly known attacks. A Wilcox test shows that this difference is significant. Thus, hypothesis 2 is supported.
4.3. Time since disclosure of the exploit
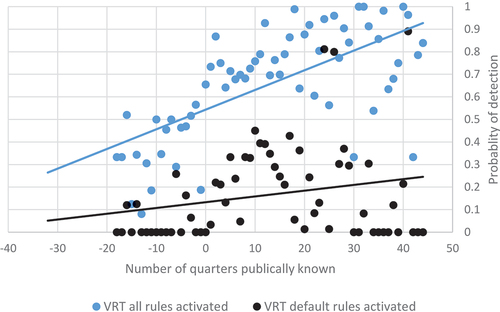
As it may take some time to produce rules for new attacks, hypothesis 3 states that the time a vulnerability has been publicly known increases the detection probability. and illustrate the relationship between time and the probability of detection. Overall, the correlation between probability of priority-1-alerts and the time an attack has been known is positive (r = 0.08) and significant. However, the observant reader may notice that the relationship to time appears to be nonlinear in the figures. In particular, suggests that VRT’s default rulesets have low detection probabilities before an exploit is released and that detection probability peak approximately ten quarters (2.5 years) after the exploit has been known. The reason may be that rules typically are deactivated when attack levels have reduced, and the rules become obsolete. The observant reader may also notice that the probability of detection appears to decrease slightly over time for ET when all rules are activated (cf. ). However, the correlation between days since disclosure in the ET with all rules activated is close to zero (<0.01) and insignificant. Furthermore, the correlation across all rulesets is close to zero (<0.01) when the binary variables disclosure and references to the exploited vulnerability are controlled for.
Figure 2. ET ruleset detection probability as a function of the number of quarters the vulnerability has been known.
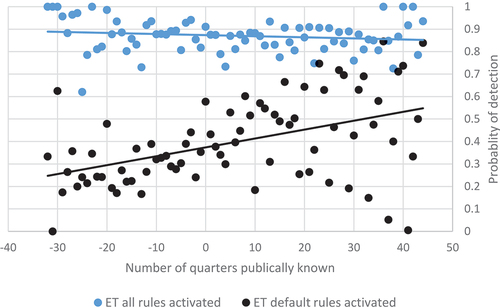
Figure 3. VRT ruleset detection probability as a function of the number of quarters the exploit has been known.
Thus, hypothesis 3 is only partially supported. The time since disclosure has a complicated relationship with detection probability.
4.4. Reference to the exploited vulnerability
Attacks that are referenced in the ruleset are more likely to raise a priority-1-alert. details how detection relates to references in the dataset. The 95% confidence interval for probability of detection is 0.55–0.57 for un-referenced attacks and 0.69–0.71 for referenced attacks. Thus, hypothesis 4 is supported in the data.
Table 3. Number of detected and un-detected cases when exploited vulnerabilities are referenced or not.
4.5. Nonsense payload
Paired comparisons where only the payload is varied reveal a difference in dection in 4% of the cases. In other words, the payload matters. However, hypothesis 5 is more specific and states that nonsense payloads should produce alerts less often than other payloads. illustrates how attacks executed with and without payloads representing nonsense are detected. These 1334 pairwise comparisons illustrate that attacks are detected more seldom when a nonsense payload is used. A paired-sample t-test shows that the difference is statistically significant, with 95% confidence intervals of 0.46–0.51 and 0.54–0.60.
Table 4. Number of cases detected with and without a nonsense payload.
shows four peculiar cases when the attack was detected with a nonsense payload but not with another (more malicious payload). This is explained by random flux in some attacks using the payload “debug_trap”: one of the attacks happens to generate a string with the sequence “QUFB” that raise alerts in VRT rulesets because this is a base64-encoding of “AAA” (a commonly used padding in attacks). Thus, in general, the use of “debug_trap” makes no difference to the probability of alerts.
Overall, the effect of payloads is limited. However, hypothesis 5 is supported in the data as they nonsense payloads associated with a lower probability of detection.
4.6. Web browser, web application and Windows
The cases in this experiment cover exploits targeting many different types of software (e.g., web browsers and web servers) and variants of the same software (e.g., on different operating systems). shows the detection probability for exploit modules containing different strings. Hypotheses 6–8 suggest that attacks associated with web browsers (“browser”), web applications (“webapp” and “http”), and windows (“windows”) should be associated with a higher probability of detection. This is definitely the case for web browsers (r = 0.20) and windows (r = 0.07). This is the case for web applications (r = 0.03) when the operating systems is controlled for but not otherwise (r = −0.02). Thus, hypotheses 6 and 8 are supported. Hypothesis 7 is only supported when other variables are controlled for.
Table 5. Detection probability for different software across all rulesets.
4.7. Software version
Hypothesis 9 states that different software versions, which are assessed as different targets in the exploit modules, should be associated with different detection probabilities. A difference in priority-1-alerts occurs in 7% of the paired samples in the test. gives some examples of when the target determine if an exploit is detected and or not for the module “windows/smb/ms08_067_netapi.” Thus, the version of a software is also of relevance, and hypothesis 9 is supported.
Table 6. Examples of detected and undetected targets for MS08-67.
4.8. Logistic regression models
As described above, the variables associated with the hypotheses have relationships to each other. Such issues can be untangled in a logistic regression model.
describe the regression models fitted to the data for each of the rulesets. The probability of probability when related variables are controlled for this variable. It is therefore excluded from the regression model. In addition, the regression model does not include software version given the multinomial nature of this variable.
Table 7. Prediction models for detection with default rules activated. Bold ORs are statistically significant.
Table 8. Prediction models for detection with all rules activated. Bold ORs are statistically significant.
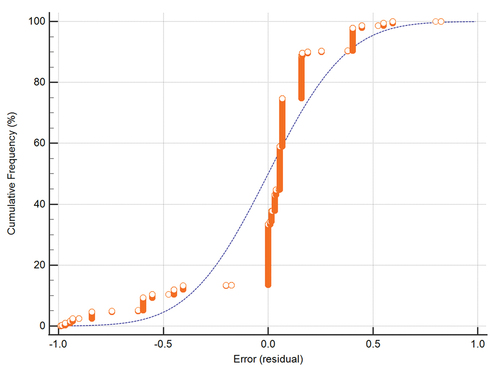
All models are statistically significant, i.e., they help to predict when priority-1-alerts occur. However, their goodness-of-fit varies. Nagelkerke’s R2 varies between 0.05 and 0.73. The portion of correctly classified cases varies between 0.65 and 0.92, and the area under curve varies between 0.62 and 0.93. An example of how the logistic regression model’s prediction match actual values is given in for the case when all ET rules are included. The model whose prediction errors are illustrated in has a Nagelkerke’s R2 of 0.36, classifies 88% of the cases correctly, and has an area under ROC curve of 0.84.
Figure 4. Prediction errors (residuals) for all ET rules with all rules activated. Negative error implies that the model predicted a detected attack but the attack was not detected. The line represents the normal distribution.
The relationship of variables to alerts is expressed as an odds-ratio (OR). An OR is not to be confused with probabilities or relative risks. In this model, they reflect the odds of a priority-1-alert given that the condition is met divided by the odds that an alert is produced when the condition is not met, i.e., Palert/(1-Palert).
Positive values imply that the variable increases the odds of an alert (and thus alert probability) given that other variables in the model remain unchanged. For instance, the OR of 2.5 for Windows in (VRT 2015–04-06) means that the odds of an alert for attacks on Window machines is more than twice as high as for attack on other machines. Conversely, negative values imply that the variable is associated with a reduced detection probability. For instance, the value of 0.51 for exploits that are not public in the same ruleset implies that alerts are produced less often if the attack is a zero-day.
As expected, most of the ORs suggest that zero-day attacks are detected less often, nonsense payloads generate fewer alerts, referenced attacks are detected more often, and attacks on windows machines are detected more often. The large differences between ORs in the regression models also provide further support for hypothesis 1, i.e. that the ruleset matters. However, some results are not as hypothesized.
First, cases with no reference to the exploited vulnerabilities are associated with an OR value less one for ET with default rules, contradicting hypothesis 4. This unexpected result of default rules is largely due to references to CVE-2008-4250 (the module “windows/smb/ms08_067_netapi”). This module has many targets, and the ET rules that reference this vulnerability are only able to detect two of all 172 tested target and payload combinations. With all rules activated, general rules for detecting shellcode also trigger alerts for other versions of these attacks.
Second, attacks on web browsers have lower probability of detection for one VRT ruleset with default rules, and attacks on web applications have lower probability of detection for two VRT with all rules activated. We find no simple explanation for these results. Thus, these hypotheses cannot be said to hold across rulesets when other variables are controlled for.
Third, not all ORs are statistically significant, and the ORs vary substantially between different rulesets. For instance, the presence of a reference to a vulnerability in VRT’s default ruleset () influences the odds of an alert much more than it does in the VRT rulesets with all rules activated (). It is difficult to see any trends in what producers focus on, and much of the variation appears to be stochastic. Specific rules often explain the fluctuations. For instance, the OR of 18.9 for web browser attacks in ET’s default rules from 2015–01-29 is partly because that version had a rule (sid 2019091) that alerts on patterns corresponding to random strings generated by the MSF. This rule was removed before the next ruleset was released, and the OR decreased to 5.85 until the rule was reintroduced. Another anomaly is the extreme ORs in the magnitude of 1010 for browser attacks in ET with all rules activated. These arise due to a set of generic rules that raise alerts in every single browser attack in the test. The reason is that ET has rules that raise alerts (sid 1:2010706:7) due to the user agent used in these tests.
Overall, it appears that producers of rulesets focus on different things. For instance, the ORs provide some support for the name ET (Emerging Threats): when all rules are activated, the detection probability of ET is less dependent on public information of the exploit (i.e., the OR is closer to one). On the other hand, zero days still reduce the detection probability in most of the tested ET ruleset.
5. Discussion
This section discusses first summary of the results of the statistical tests. Thereafter, the validity and reliability of this test are discussed along with the implications. Finally, implications to practice and research are discussed.
5.1. Overview
The nine hypotheses were tested through both bivariate and multivariate analyses. As summarized in , some hypotheses are only partially supported as they are supported under certain conditions. More specifically, the number of days between the release date of an exploit and a ruleset have no clear link to detection probability when references to the exploited vulnerability and disclosure of the vulnerability are already considered. References to the exploited vulnerability are related to detection probability in all rulesets but inversely related to detection probability when all ET rules are used. The main reason is that references to one exploit code are frequently used in the tests. Web browsers and web applications decrease the detection probability in some VRT rulesets but have a positive relationship to detection probability overall.
Table 9. Support for the hypotheses concerning probability of detection.
5.2. Validity and reliability
There are many possible objections to the tests described in this paper.
First, the selection of exploits, rulesets, and Snort version may be biased in several ways. The exploits were selected from the database of the Metasploit Framework. While this database represents relevant attacks, they are not necessarily representative of the attacks that system administrators should be concerned about. For instance, the selection resulted in no attacks on mobile phones, which may be a concern in today’s enterprises. In addition, the NIDS rulesets are a convenience sample. While they are evenly distributed over time, VRT rulesets cover a shorter period. The absence of VRT rulesets dated before 2014 also means that VRT was tested with fewer zero-day attacks (18% compared to 26% for ET). As discussed earlier, very small differences were obtained in tests involving three different Snort versions. However, software development occasionally leads to significant differences between versions, and it is possible that the selection of version (and thereby preprocessor) would influence detection rates.
Second, there are some issues with test procedure worth noting. One issue is the realism of the simulation. The tests seldom involved responses from the actual software targets to requests made by attacks that involved two-way interactions. Instead, responses were generally simulated by either 1) a different software that ran the same protocol stack as the target (e.g., an apache web server, vsftpd or openssh-server), 2) a general script that answered with dummy TCP/UDP data, 3) by altering the exploited source code to remove the need for correct network responses, or 4) a combination of 1 and 3 or 2 and 3. While this design was necessary from a cost-perspective and our manual reviews of the rulesets suggest alerts seldom are given from responses from targeted machines, it is possible that it suppressed alerts.
Third, each of the 267 unique exploits was tested with all available targets and (up to) three payloads per target. Thus, exploits with very few targets and few applicable payloads are undersampled. While this may be aligned with the exploit’s relative importance in security, it is important to recognize when results are interpreted. For instance, the large number of available targets and payloads available for the module “windows/smb/ms08_067_netapi” contributed to the peculiar result related to ET and referenced attacks (see section 4.2.2).
Fourth, there are conditions in the tests that make them relevant to a limited threat scenario. For instance, encryption was not used in communication with web servers, and attacks were performed from a network configured to be external of the target. In practice, however, encryption often pose an obstacle to NIDSs and attacks should be expected within a network “home”-network too, where the NIDS may not be configured to look for attacks. Furthermore, many rules in the rulesets (especially in ET) concern malicious code’s communication with command-and-control servers and trigger based on destination IPv4 addresses. Analyzing the quality of such IP-based rules is beyond the scope of this paper.
Fifth, the variables in these tests are high-level generalizations that aim to predict whether attacks will trigger alerts. In practice, a skilled NIDS operator is likely able to make qualified guesses based on many other variables. For instance, the references used vulnerabilities exploited in the attacks are based on CVE codes in our operationalization. However, an NIDS operator may be able to guess whether an attack is covered by general rules based on a vulnerability description or an attack description.
Sixth, some statistical results are peculiar, at least at first glance. For instance, the extreme odds-ratio for web browsers in the ET ruleset with all rules activated may be considered strange. Likewise, the probability of detection was surprisingly independent of the time a vulnerability has been known in the ET rulesets with all rules activated. The abovementioned explanations to these results demonstrate properties in the data: a few (generic) rules can make a significant difference in detection probability. This situation is not ideal for probabilistic models, such as logistic regression. Consequently, not all effect sizes reported here reflect general tendencies, and the reader should interpret individual effect sizes of the different models carefully.
5.3. Implications to practice
The tests described in this paper both confirm widely accepted ideas and report on less widely known relationships.
First, readers should be cautioned that this test only focuses on variables that improve alert probability. Unfortunately, generic rules tend to produce alerts for both benign and malicious traffic and may in fact decrease system administrators’ detection capability. To illustrate this problem, we exposed the NIDS solutions used in the tests to 544 benign traffic recordings (pcap files) obtained from Wirehark’s sample captures (Isaac Boukris, Citation2019). The ruleset detection probability and the number of false priority-1-alerts they produce for these data are strongly correlated (r = 0.81). For instance, when all rules are activated in the rulesets, 255% more alerts are produced for the benign sample captures. Thus, interpretations of the results from this study should recognize that false alerts are an important issue that often occurs together with increased probability of detection. The tests in this study do not take this into account.
Second, the result shows that ruleset producers focus on different things and think differently. VRT seems more accurate at covering the attacks that are referenced by rules, have more specific rules, and therefore detect fewer attacks. This notion is illustrated by the number of times the rulesets raise the same alert for different attacks. The alerts raised by VRT occur on average 37 times in the data; the alerts raised by ET are triggered on average 89 times. Some examples that illustrate the type of rules triggered include common alerts and are for shellcode detected in traffic (e.g., sid 2013273 and 2012258) or excessive use of the heap using no-operations (sid 2012111). With all rules active, ET also produces alerts for commonly benign things, such as when http-posts go to unusual ports and there is a tilde-sign after a URI. The deactivated rules in VRT triggered by the attacks are not as generic but seldom point to specific attack. For instance, alerts are raised due to a pattern used in suggesting obfuscated data are detected (sid 19884 and 21038). In practice, the specificity of rules can be important because a system administrator must interpret the alert and identify what action to take. This is not the focus of this paper. However, as stated above, our informal assessment is that rulesets by VRT are better in this regard.
Third, this study confirms the results of Holm (Citation2014): available signature databases can detect zero-day attacks, although odds-ratios show that the detection probability is lower for zero days. Furthermore, other variables are often more important for detection. For instance, in the ET default rulesets, the odds of detection are approximately nine times higher if a web application is attacked and only reduced by a factor of approximately two if the attack is a zero day.
Fourth, the detection rates show that Snort raises alerts for approximately 66–87% of known and unknown attacks with all provided rules activated. Many of the rules triggered by attacks could be described as generic detection rules not targeting a specific exploit or threat. For example, they raise alerts for http traffic that goes to unusual ports or when arbitrary shellcodes are seen in the traffic. While these provided rules come with the cost of many false alerts, they also illustrate that signature-based NIDSs can be used to detect attacks even if the specifics of the exploit are unknown. Many system administrators write similar rules that capture events they consider suspicious anomalies in their organization. With such site-specific rules, even higher detection rates can be expected.
5.4. Implications for research
The main contribution of this study is the assessment of how different variables influence the probability that alerts are produced in contemporary NIDS. We here describe four potential takeaways for researchers.
First, the prediction of the logistic regression model can be improved. While the variables included in the model are relevant, the model is far from perfect. The operationalizations of variables used in this paper are neither encompassing nor believed to be optimal. For instance, an attack can be referenced by other means than the CVE code it targets, and the perceived threat level at the time rules are written may be worth adding to the model.
Second, future research should use another more refined, dependent variable than the probability of priority-1-alerts. In particular, tests of specificity and usefulness of the alerts would be relevant. For instance, alerts should provide descriptions that would help a system administrator identify the threat.
Third, other types of predictions and models may illuminate other important relationships. For instance, as we illustrated in section 5.3, there is a very strong relationship between detection probability and the number of false alerts produced in the rulesets (r = 0.81). The number of false alerts produced by a ruleset are not attributes of the unit of analysis in this test (attacks) and therefore impossible to fit into the logistic regression model. However, further analysis of this relationship may be performed. For example, analyses could be performed to assess how rule specificity (e.g., defined as in the work by Raftopoulos and Dimitropoulos (Citation2013)) is related to utility. Such research may determine whether rules that generate alerts for zero-day attacks always are unspecific and prone to producing false alerts. Other alternatives include advanced methods for the generation of representative network traffic, e.g., as in the work by Shiravi et al. (Citation2012) or Ring et al. (Citation2019).
Fourth, the result of this study shows the limitations of signature-based solutions and were further research is warranted. As mentioned in section 2 of this paper, previous research has demonstrated solutions that automatically generate rules for known attacks and certain types of vulnerabilities, software, or protocols. However, as this study demonstrates, available rulesets do not even cover well-documented exploit codes, such as those in the Metasploit Framework, and few attacks are explicitly referenced in the rulesets. Thus, research improving existing rule-generation solutions or making them more accessible to practitioners ought to be welcome.
Disclosure statement
No potential conflict of interest was reported by the author(s).
References
- Bhosale, D. A., & Mane, V. M. (2015). Comparative study and analysis of network intrusion detection tools. In 2015 International Conference on Applied and Theoretical Computing and Communication Technology (iCATccT) (Vol.9, pp. 312–315). IEEE. Davangere, India. https://doi.org/10.1109/ICATCCT.2015.7456901
- Bilge, L., & Dumitras, T. (2012). Before we knew it: An empirical study of zero-day attacks in the real world. Proceedings of the 2012 ACM Conference on Computer and Communications Security – CCS’12, Raleigh, North Carolina, USA, 833–844. https://doi.org/10.1145/2382196.2382284
- Boukris, I. (2019). Wireshark - Sample Captures. The Wireshark Foundation. Retrieved July 15, 2019, from https://wiki.wireshark.org/SampleCaptures#Sample_Captures
- Chandrasekaran, M., Baig, M., & Upadhyaya, S. (2006). AVARE: Aggregated vulnerability assessment and response against zero-day exploits. In 2006 IEEE International Performance Computing and Communications Conference (Vol.2006, pp. 603–610). Phoenix, AZ: IEEE. https://doi.org/10.1109/.2006.1629458
- Cotroneo, D., Paudice, A., & Pecchia, A. (2019). Empirical analysis and validation of security alerts filtering techniques. IEEE Transactions on Dependable and Secure Computing, 16(5), 856–870. https://doi.org/10.1109/TDSC.2017.2714164
- Debar, H., Dacier, M., & Wespi, A. (1999). Towards a taxonomy of intrusion-detection systems. Computer Networks, 31(8), 805–822. https://doi.org/10.1016/S1389-1286(98)00017-6
- Erlacher, F., & Dressler, F. (2018). How to test an IDS? GENESIDS: An automated system for generating atack traffic. WTMC 2018 - Proceedings of the 2018 Workshop on Traffic Measurements for Cybersecurity, Part of SIGCOMM 2018, Budapest, Hungary: Association for Computing Machinery, New York, United States46–51. https://doi.org/10.1145/3229598.3229601
- Garcia-Teodoro, P., Diaz-Verdejo, J. E. E., Tapiador, J. E. E., & Salazar-Hernandez, R. (2015). Automatic generation of HTTP intrusion signatures by selective identification of anomalies. Computers and Security, 55, 159–174. https://doi.org/10.1016/j.cose.2015.09.007
- Gascon, H., Orfila, A., & Blasco, J. (2011). Analysis of update delays in signature-based network intrusion detection systems. Computers and Security, 30(8), 613–624. https://doi.org/10.1016/j.cose.2011.08.010
- Goodall, J. R., Lutters, W. G., & Komlodi, A. (2009). Developing expertise for network intrusion detection. Information Technology & People, 22(2), 92–108. https://doi.org/10.1108/09593840910962186
- Hieu, T. T., Thinh, T. N., & Tomiyama, S. (2013). ENREM: An efficient NFA-based regular expression matching engine on reconfigurable hardware for NIDS. Journal of Systems Architecture, 59(4–5), 202–212. https://doi.org/10.1016/j.sysarc.2013.03.013
- Hofmann, A., & Sick, B. (2011). Online intrusion alert aggregation with generative data stream modeling. IEEE Transactions on Dependable and Secure Computing, 8(2), 282–294. https://doi.org/10.1109/TDSC.2009.36
- Holm, H. (2014). Signature based intrusion detection for zero-day attacks: (Not) a closed chapter? In 2014 47th Hawaii International Conference on System Sciences (pp. 4895–4904). Big Island, HI, United states: IEEE. https://doi.org/10.1109/HICSS.2014.600
- Holm, H., & Sommestad, T. (2016). SVED: Scanning, Vulnerabilities, Exploits and Detection. In MILCOM 2016-2016 IEEE Military Communications Conference (pp. 976–981). Baltimore, MD: IEEE. https://doi.org/10.1109/MILCOM.2016.7795457
- Khamphakdee, N., Benjamas, N., & Saiyod, S. (2014). Network traffic data to ARFF converter for association rules technique of data mining. In 2014 IEEE Conference on Open Systems (ICOS) (pp. 89–93). IEEE. Subang, Malaysia. https://doi.org/10.1109/ICOS.2014.7042635
- Khraisat, A., Gondal, I., Vamplew, P., & Kamruzzaman, J. (2019). Survey of intrusion detection systems: Techniques, datasets and challenges. Cybersecurity, 2(1), 1. https://doi.org/10.1186/s42400-019-0038-7
- Kumar, S., & Spafford, E. H. (1994). A pattern matching model for misuse intrusion detection. In Proceedings of the 17th national computer security conference (pp. 11–21). Baltimore, MD
- Lee, S., Kim, S., Lee, S., Choi, J., Yoon, H., Lee, D., & Lee, J.-R. (2018). LARGen: Automatic signature generation for malwares using latent dirichlet allocation. IEEE Transactions on Dependable and Secure Computing, 15(5), 771–783. https://doi.org/10.1109/TDSC.2016.2609907
- Levine, J., LaBella, R., Owen, H., Contis, D., & Culver, B. (2003). The use of honeynets to detect exploited systems across large enterprise networks. IEEE Systems, Man and Cybernetics Society Information Assurance Workshop, West Point, NY, USA, (June), 92–99. https://doi.org/10.1109/SMCSIA.2003.1232406
- Liao, H.-J., Richard Lin, C.-H., Lin, Y.-C., & Tung, K.-Y. (2013). Intrusion detection system: A comprehensive review. Journal of Network and Computer Applications, 36(1), 16–24. https://doi.org/10.1016/j.jnca.2012.09.004
- Mahdavi, E., Fanian, A., & Amini, F. (2020). A real-time alert correlation method based on code-books for intrusion detection systems. Computers and Security, 89, 101661. https://doi.org/10.1016/j.cose.2019.101661
- Milenkoski, A., Vieira, M., Kounev, S., Avritzer, A., & Payne, B. D. (2015). Evaluating computer intrusion detection systems: A survey of common practices. ACM Computing Surveys, 48(1), 1. https://doi.org/10.1145/2808691
- Mitchell, R., & Chen, I.-R. (2015). Behavior rule specification-based intrusion detection for safety critical medical cyber physical systems. IEEE Transactions on Dependable and Secure Computing, 12(1), 16–30. https://doi.org/10.1109/TDSC.2014.2312327
- Nadler, A., Aminov, A., & Shabtai, A. (2019). Detection of malicious and low throughput data exfiltration over the DNS protocol. Computers and Security, 80, 36–53. https://doi.org/10.1016/j.cose.2018.09.006
- Nivethan, J., & Papa, M. (2016). Dynamic rule generation for SCADA intrusion detection. 2016 IEEE Symposium on Technologies for Homeland Security, HST 2016, Waltham, MA, USA, (May). https://doi.org/10.1109/THS.2016.7568964
- Nyasore, O. N., Zavarsky, P., Swar, B., Naiyeju, R., & Dabra, S. (2020). Deep packet inspection in industrial automation control system to mitigate attacks exploiting modbus/TCP vulnerabilities. Proceedings - 2020 IEEE 6th Intl Conference on Big Data Security on Cloud, BigDataSecurity 2020, 2020 IEEE Intl Conference on High Performance and Smart Computing, HPSC 2020 and 2020 IEEE Intl Conference on Intelligent Data and Security, IDS 2020, Baltimore, MD, 241–245. https://doi.org/10.1109/BigDataSecurity-HPSC-IDS49724.2020.00051
- Pan, Z., Hariri, S., & Pacheco, J. (2019). Context aware intrusion detection for building automation systems. Computers and Security, 85, 181–201. https://doi.org/10.1016/j.cose.2019.04.011
- Patcha, A., & Park, J.-M.-M. (2007). An overview of anomaly detection techniques: Existing solutions and latest technological trends. Computer Networks, 51(12), 3448–3470. https://doi.org/10.1016/j.comnet.2007.02.001
- Portokalidis, G., Slowinska, A., & Bos, H. (2006). Argos. ACM SIGOPS Operating Systems Review, 40(4), 15–27. https://doi.org/10.1145/1218063.1217938
- Raftopoulos, E., & Dimitropoulos, X. (2013). A quality metric for IDS signatures: In the wild the size matters. Eurasip Journal on Information Security, (2013(1), 7. https://doi.org/10.1186/1687-417X-2013-7
- Ramaki, A. A., Amini, M., & Ebrahimi Atani, R. (2015). RTECA: Real time episode correlation algorithm for multi-step attack scenarios detection. Computers and Security, 49, 206–219. https://doi.org/10.1016/j.cose.2014.10.006
- Ramirez-Silva, E., & Dacier, M. (2007). Empirical study of the impact of metasploit-related attacks in 4 years of attack traces In: Cervesato I. (eds) Advances in Computer Science – ASIAN 2007. Computer and Network Security. ASIAN 2007. Lecture Notes in Computer Science, vol 4846. Springer, Berlin, Heidelberg h ttps://d oi.org/d oi:1 0.1007/978-3-540-76929-3_19
- Ring, M., Schlör, D., Landes, D., & Hotho, A. (2019). Flow-based network traffic generation using generative adversarial networks. Computers and Security, 82, 156–172. https://doi.org/10.1016/j.cose.2018.12.012
- Roesch, M. (1999). Snort: Lightweight intrusion detection for networks. In LISA ’99: 13th Systems Administration Conference (pp. 229–238). Seattle, Washington: USENIX Association.
- Rubin, S., Jha, S., & Miller, B. P. (2004). Automatic generation and analysis of NIDS attacks. In Proceedings - Annual Computer Security Applications Conference, ACSAC (pp. 28–38). Tucson, AZ: IEEE. https://doi.org/10.1109/CSAC.2004.9
- Shiravi, A., Shiravi, H., Tavallaee, M., & Ghorbani, A. A. A. (2012). Toward developing a systematic approach to generate benchmark datasets for intrusion detection. Computers and Security, 31(3), 357–374. https://doi.org/10.1016/j.cose.2011.12.012
- Shittu, R., Healing, A., Ghanea-Hercock, R., Bloomfield, R., & Rajarajan, M. (2015). Intrusion alert prioritisation and attack detection using post-correlation analysis. Computers and Security, 50, 1–15. https://doi.org/10.1016/j.cose.2014.12.003
- Sommestad, T., & Franke, U. (2015). A test of intrusion alert filtering based on network information. Security and Communication Networks, 8(13), 2291–2301. https://doi.org/10.1002/sec.1173
- Sommestad, T., Hunstad, A., & Furnell, S. M. (2013). Intrusion detection and the role of the system administrator. Information Management & Computer Security, 21(1), 30–40. https://doi.org/10.1108/09685221311314400
- Tjhai, G., Papadaki, M., Furnell, S. M., & Clarke, N. L. (2008). Investigating the problem of IDS false alarms: An experimental study using snort. In Proceedings of The IFIP TC 11 23rd International Information Security Conference (pp. 253–267). Boston, MA: Springer US. https://doi.org/10.1007/978-0-387-09699-5_17
- Tran, T., Aib, I., Al-Shaer, E., & Boutaba, R. (2012). An evasive attack on SNORT flowbits. In Proceedings of the 2012 IEEE Network Operations and Management Symposium, NOMS 2012 (pp. 351–358). Maui, HI: IEEE. https://doi.org/10.1109/NOMS.2012.6211918
- Vasilomanolakis, E., Karuppayah, S., Muhlhauser, M., & Fischer, M. (2015). Taxonomy and survey of collaborative intrusion detection. ACM Computing Surveys, 47(4), 1–33. https://doi.org/10.1145/2716260
- Werlinger, R., Hawkey, K., Muldner, K., Jaferian, P., & Beznosov, K. (2008). The challenges of using an intrusion detection system. In Proceedings of the 4th symposium on Usable privacy and security - SOUPS ’08 (p. 107). New York, New York, USA: ACM Press. https://doi.org/10.1145/1408664.1408679
- Wuu, L.-C., Hung, C.-H., & Chen, S.-F. (2007). Building intrusion pattern miner for snort network intrusion detection system. Journal of Systems and Software, 80(10), 1699–1715. https://doi.org/10.1016/j.jss.2006.12.546
- Zand, A., Vigna, G., Yan, X., & Kruegel, C. (2014). Extracting probable command and control signatures for detecting botnets. In Proceedings of the ACM Symposium on Applied Computing (pp. 1657–1662). Gyeongju: Association for Computing Machinery. https://doi.org/10.1145/2554850.2554896