
ABSTRACT
Per- and polyfluoroalkyl substances (PFASs) represent a highly ubiquitous group of synthetic chemicals used in products ranging from water and oil repellents and lubricants to firefighting foam. These substances can enter and accumulate in multiple tissue matrices in up to 100% of people assessed. Though animal models strongly identify these compounds as male reproductive toxicants, with exposed rodents experiencing declines in sperm count, alterations in hormones, and DNA damage in spermatids, among other adverse outcomes, human studies report conflicting conclusions as to the reproductive toxicity of these chemicals. Using an innovative, human stem-cell-based model of spermatogenesis, we assessed the effects of the PFASs perfluorooctanesulfonic acid (PFOS), perfluorooctanoic acid (PFOA), perfluorononanoic acid (PFNA), and a mixture of PFOS, PFOA, and PFNA for their impacts on human spermatogenesis in vitro under conditions relevant to the general and occupationally exposed populations. Here, we show that PFOS, PFOA, PFNA, and a mixture of PFOS, PFOA, and PFNA do not decrease in vitro germ cell viability, consistent with reports from human studies. These compounds do not affect mitochondrial membrane potential or increase reactive oxygen species generation, and they do not decrease cell viability of spermatogonia, primary spermatocytes, secondary spermatocytes, or spermatids in vitro under the conditions examined. However, exposure to PFOS, PFOA, and PFNA reduces expression of markers for spermatogonia and primary spermatocytes. While not having direct effects on germ cell viability, these effects suggest the potential for long-term impacts on male fertility through the exhaustion of the spermatogonial stem cell pool and abnormalities in primary spermatocytes.
Abbreviations: CDC: Centers for Disease Control; DMSO: dimethyl sulfoxide; GHR: growth hormone receptor; hESCs: human embryonic stem cells; PFASs: per- and polyfluoroalkyl substances; PFCs: perfluorinated compounds; PFNA: perfluorononanoic acid; PFOS: perfluorooctanesulfonic acid; PFOA: perfluorooctanoic acid; PLZF: promyelocytic leukemia zinc finger; ROS: reactive oxygen species; HILI: RNA-mediated gene silencing 2; SSC: spermatogonial stem cell
Introduction
Per- and polyfluoroalkyl substances (PFASs), previously called perfluorinated compounds (PFCs), are a group of synthetic chemicals that have been used in products ranging from water and oil repellents, lubricants, detergent products, coatings for furniture and food packages, waxes, firefighting foam, and other products since the 1940s (Arvaniti and Stasinakis Citation2015; Hu et al. Citation2016; Lei et al. Citation2015; Louis et al. Citation2015). Perfluorooctanesulfonic acid (PFOS) and perfluorooctanoic acid (PFOA) are the two most widely produced and used PFASs in the United States, along with perfluorohexane sulfonic acid (PFHxS) and perfluorononanoic acid (PFNA) (Lei et al. Citation2015; Louis et al. Citation2015). PFASs enter the human body through ingestion, inhalation, and contact with commonly used consumer products, where they bind albumin in the blood stream and readily bioaccumulate within the body’s tissues (Louis et al. Citation2015; Wu et al. Citation2015). PFASs have been found in a wide range of matrices, including blood, urine, breast milk, and seminal plasma (Guruge et al. Citation2005; Jusko et al. Citation2016; Poothong et al. Citation2017; Worley et al. Citation2017). The American Red Cross and the Centers for Disease Control (CDC) report that the average exposure of Americans to PFASs ranges from 0.9 ng/mL to over 100 ng/mL, with PFASs being detected in 100% of people tested in some studies (Calafat et al. Citation2007; Kato et al. Citation2011; Louis et al. Citation2015; Olsen et al. Citation2011). However, populations such as Ronneby, Sweden, where up to one-third of households were exposed to drinking water contaminated with PFASs, have been reported to have PFOS and PFOA concentrations in their blood serum at concentrations as high as 1,500 ng/mL (3.00 µM) and 92 ng/mL (0.22 µM), respectively (Li et al. Citation2018). In the United States, widespread environmental contamination of PFOA from DuPont’s Washington Works plant in West Virginia spurred epidemiological investigations of the exposure on the health of the surrounding community, where exposed workers had average serum concentrations of PFOA of 350 ng/mL (0.65 µM) (Steenland et al. Citation2009; Steenland and Woskie Citation2012). Similarly, individuals who have been occupationally exposed to PFASs have been found to have PFOS and PFOA concentrations of up to 118,000 ng/mL (235.94 µM) and 32,000 ng/mL (77.28 µM), respectfully, values that are over 1,000 times higher than the highest concentrations reported by the American Red Cross and the CDC for the general population of Americans (Fu et al. Citation2016).
The perfluoroalkyl acids PFOS and PFOA have been found in the seminal plasma of 100% and over 70% of men in a Sri Lankan population, respectively, indicating that these chemicals may accumulate in the testis (Guruge et al. Citation2005). However, it is still uncertain whether these chemicals have detrimental impacts on human spermatogenesis and fertility. In studies analyzing the associations between PFOS, PFOA, and PFNA concentrations in the blood serum of adult men and semen parameters, most studies do not report declines in semen volume or sperm number, though one study reports a trend of lower sperm concentration and counts in response to PFOA exposure (Governini et al. Citation2015; Joensen et al. Citation2013; Kvist et al. Citation2012; Louis et al. Citation2015; Raymer et al. Citation2012; Specht et al. Citation2012; Toft et al. Citation2012; Vested et al. Citation2013). However, this association was found for men exposed to PFOA in utero; whereas, all other studies involve participation of men from the general population. Exposure to PFOS, PFOA, and PFNA has been associated with changes in male hormones, sperm morphology, DNA fragmentation, and X:Y ratio and chromosomal abnormalities in adult men from the general population (Governini et al. Citation2015; Joensen et al. Citation2013; Kvist et al. Citation2012; Louis et al. Citation2015; Raymer et al. Citation2012; Toft et al. Citation2012; Vested et al. Citation2013). However, among studies, exact results have varied. These results are in stark contrast to studies in rodent models, which report significant declines in sperm counts upon exposure to PFASs (Fan et al. Citation2005; Kato et al. Citation2015; Liu et al. Citation2015). To date, no studies on occupationally exposed workers and semen parameters or pregnancy outcomes have been conducted, further contributing to the knowledge gap of whether PFASs impact male fertility.
Our lab has developed a model of in vitro human spermatogenesis to close these knowledge gaps (CAt et al. Citation2012). In this model, male human embryonic stem cells (hESCs) can be directly differentiated into spermatogonial stem cells/differentiating spermatogonia, pre-meiotic and post-meiotic spermatocytes, and post-meiotic spermatids (CAt et al. Citation2012). Using this model, we have successfully recapitulated the clinical phenotypes of known human male reproductive toxicants 1,2-dibromo-3-chloropropane and 2-bromopropane under acute, occupationally exposed conditions (CAt et al. Citation2015). The purpose of this study was to assess whether PFOS, PFOA, PFNA, and a mixture of PFOS, PFOA, and PFNA directly affect the viability of spermatogenic cells in our human in vitro model under chronic conditions relevant to both the general and occupationally exposed populations. Here, we identify spermatogonia and primary spermatocytes as the main targets of in vitro PFOS, PFOA, and PFNA. Exposure to PFOS, PFOA, and PFNA does not decrease cell viability, impact the cell cycle, or cause toxicity through reactive oxygen species (ROS) production or mitochondrial dysfunction; however, it reduces the expression of spermatogonia and primary spermatocyte markers.
Results
PFOS, PFOA, and PFNA do not impact in vitro spermatogenic cell viability
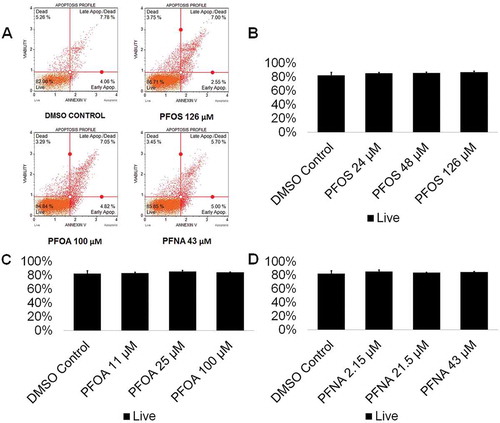
Various chemical toxicants have been shown to induce apoptosis in spermatogenic cells, a process that can have detrimental consequences to male fertility (Aitken and Baker Citation2013; Aly Citation2013; Bloom et al. Citation2015). In rodents, PFOS exposure has been shown to upregulate p53 and BAX expression in the testis while downregulating BCL-2 expression, indicative of apoptosis (Liu et al. Citation2015; Qu et al. Citation2016). Similarly, PFNA exposure has been shown to induce apoptosis in germ cells in rat testis (Feng et al. Citation2009). In a study assessing apoptosis in semen samples of a human cohort, no associations between PFAS exposure, including PFOS, PFOA, and PFNA, and apoptosis in sperm were found (Specht et al. Citation2012). However, in a study assessing the effects of PFAS exposure on Xenopus laevis A6 kidney cell numbers, PFOS and PFOA decreased cell numbers; whereas, PFNA had no effect on A6 cell numbers (Gorrochategui et al. Citation2016). To determine if PFAS exposure impacts the viability of in vitro spermatogenic cell lineages, male hESCs were differentiated as described (CAt et al. Citation2012). This differentiation protocol produces a mixed population of spermatogonial stem cells/differentiating spermatogonia, primary spermatocytes, secondary spermatocytes, and haploid spermatids. In vitro differentiations were treated with PFOS at concentrations of 24 µM, 48 µM, or 126 µM; PFOA with concentrations of 11 µM, 25 µM, or 100 µM; PFNA at concentrations of 2.15 µM, 21.5 µM, or 43 µM, or 0.25% dimethyl sulfoxide (DMSO) beginning on day 1 of the differentiation. Chemical concentrations are physiologically relevant to populations exposed to high concentrations of PFASs in their environment and those who are occupationally exposed based on published data (Calafat et al. Citation2007; Fu et al. Citation2016; Li et al. Citation2018; Louis et al. Citation2015; Kato et al. Citation2011; Olsen et al. Citation2011). PFOS, PFOA, and PFNA treatment groups were analyzed in comparison to a 0.25% DMSO-only treated negative control for cell viability/apoptosis. This assay has been utilized by our lab in previous studies to assess spermatogenic cell viability status (CAt et al. Citation2015; Steves et al. Citation2018). As a positive control, cells were treated with a 200-µM hydrogen peroxide (H2O2) for a period of 6 h to confirm that our system responds to known toxicants (Supplemental Figure S1A-C). Flow cytometry analyses reported the percentage of live, early apoptotic, late apoptotic/dead, and dead cells in our in vitro cultures (; Supplemental Figure S2). The results of these analyses did not reveal any significant increases in apoptosis in cells treated with PFOS, PFOA, or PFNA at the concentrations used in this study (; Supplemental Figure S2). As such, our data support the reports in human cohort studies that PFASs do not induce cell death in germ cells. However, it is important to note that studies have shown that PFASs can cause cytotoxicity without utilizing an apoptotic mechanism (Buhrke et al. Citation2013). In cytotoxicity assays examining the effects of PFASs on the viability of the human hepatoma line HepG2, treatment with PFOA concentrations as low as 50 µM decreased cell viability (Buhrke et al. Citation2013), Similarly, this study calculated the IC50s of PFOA and PFNA to be 47 µM and 23 µM, respectively, after analysis with a Neural Red assay (Buhrke et al. Citation2013). Notably, the EC50s of PFOS, PFOA, and PFNA were calculated to be 107 µM, 594 µM, and 213 µM, respectively, using Alamar Blue in the human placental carcinoma cells JEG-3 (Gorrochategui et al. Citation2014). Though the sensitivity of various cell lines to PFAS exposure is highly variable, it is possible that our in vitro spermatogenic cells are not susceptible at the concentrations tested as we do not observe any appreciable cell death in our cultures after prolonged exposure (data not shown).
Figure 1. PFOS, PFOA, and PFNA do not induce apoptosis in spermatogenic cells derived from hESCs. (A) Flow cytometry analyses for indicating percent viable cells, percent early apoptotic cells, percent late apoptotic cells, and percent dead/necrotic cells for the highest concentrations of PFOS, PFOA, and PFNA assessed plus a negative control. Lower left quadrant represents viable cells, lower right quadrant represents early apoptotic cells, upper right quadrant is late apoptotic/dead cells, and the upper right quadrant is dead/necrotic cells. (B–D) Graphical representation showing that exposure to PFOS, PFOA, and PFNA did not impact cell viability in hESCs differentiated in in vitro spermatogenic conditions. 5,000 events were analyzed, with four (n = 4) replications performed for each condition. Significant changes in cell viability were determined using a 1-way analysis of variance (1-way ANOVA) and validated via a Student’s t-test, where * is p < 0.05, ** is p < 0.01, and *** is p < 0.001.
PFOS, PFOA, and PFNA do not increase the production of ROS in in vitro spermatogenic cells
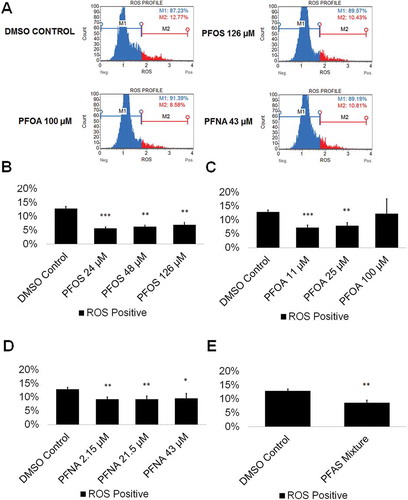
The mammalian testis is susceptible to toxic assault by ROS (Agarwal et al. Citation2014), with ROS causing cell death through necrotic and apoptotic pathways (Ryter et al. Citation2007). Certain environmental toxicants have shown to be inducing oxidative stress (Aly Citation2013; Erkekoglu and Kocer-Gumusel Citation2014; Maiorino and Ursini Citation2002) even in our in vitro model (CAt et al. Citation2015). However, ROS production does not always induce cell death (Matic Citation2018). ROS are extremely volatile genotoxic agents capable of damaging DNA and oxidizing proteins (Matic Citation2018). An increase in ROS could lead to DNA mutations capable of being transmitted to future generations. PFASs, including PFOS, PFOA, and PFNA have been shown to increase ROS in a dose-dependent manner (Wielsoe et al. Citation2015). Specifically, PFOS has been shown to increase production of ROS in the C. elegans germline, while PFOA has been shown to induce testicular damage in male mice, with exposure resulting in a significant increase of oxidative stress (Guo et al. Citation2016; Liu et al. Citation2015). While the generation of ROS in the germline due to PFNA exposure has not been examined, PFNA exposure has been connected to the formation of ROS in the spleen cells of rats, resulting in cell-mediated death through apoptotic pathways (Fang et al. Citation2010). We examined whether PFOS, PFOA, PFNA, and a mixture of 48-µM PFOS, 25-µM PFOA, and 21.5-µM PFNA could increase ROS levels in comparison to a 0.25% DMSO-only negative control. This oxidative stress analysis has been utilized by our lab in previous studies to assess oxidative stress status (CAt et al. Citation2015; Steves et al. Citation2018). As a positive control, cells were treated with 200-µM hydrogen peroxide (H2O2) to confirm that this system responds to a known ROS inducer (Supplemental Figure S3). Flow cytometry profiles were generated showing the percentage of ROS positive (ROS+; red) and ROS negative (ROS-; blue) cells in our cultures (; Supplemental Figure S4). While PFOA exposure resulted in no significant changes to ROS production at any concentration tested, PFOS and PFNA both showed significantly less ROS levels compared to the 0.25% DMSO-only control by as much as 55% and 28% at the lowest concentrations tested, respectively (; Supplemental Figure S4). The complex PFAS mixture similarly showed a 33% reduction in ROS (; Supplemental Figure S4). Interestingly, PFOS and PFOA both increased ROS in a dose-wise manner (although not statistically significant), with an 18% and 41% difference between the lowest and highest concentrations of PFOS and PFOA tested, respectively (; Supplemental Figure S4). Consistent with our viability results, it is unlikely that ROS is influencing the viability of in vitro spermatogenic cells. These results indicate that PFAS exposure may be protective against ROS in our in vitro cultures at lower concentrations; however, higher concentrations may increase the production of ROS.
Figure 2. PFOS, PFOA, PFNA, and a mixture of PFASs decrease ROS generation in spermatogenic cells derived from hESCs. (A) Flow-cytometry-based analysis of DHE labeling reporting percent ROS- and percent ROS+ cells for the highest concentrations tested plus a negative control. Blue indicates ROS-. Red indicates ROS+. (B–E) Graphical representation showing that PFOS, PFOA, PFNA, and a mixture of the PFASs PFOS, PFOA, and PFNA (PFAS mixture) decrease ROS generation in hESCs differentiated in in vitro spermatogenic conditions. 5,000 events were analyzed, with five (n = 5) replications performed for each condition. Significant changes in ROS generation were determined using a 1-way analysis of variance (1-way ANOVA) and validated via a Student’s t-test, where * is p < 0.05, ** is p < 0.01, and *** is p < 0.001.
Exposure to PFOS, PFOA, and PFNA does not impact mitochondrial function
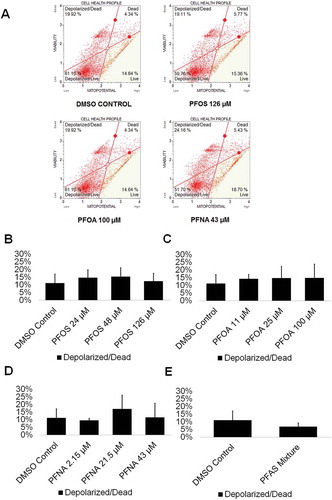
The mitochondria are one of the most essential organelles in a cell, with functions including the generation of cellular energy in the form of ATP, cell signaling, calcium homeostasis, and cell cycle regulation, among other functions (Attene-Ramos et al., Citation2013). As such, the inhibition of mitochondrial function is detrimental. Mitochondria have been shown to be susceptible to early-stage effects of chemical toxicity, and multiple chemicals have been shown to cause mitochondrial dysfunction (Schmidt Citation2010). Therefore, mitochondria could serve as a highly sensitive early-warning system for cell health. PFOS has been shown to decrease the mitochondrial membrane potential of mouse Leydig cells, ultimately leading to apoptosis through mitochondrially mediated pathways (Zhang et al. Citation2015). PFOS was found to impact mitochondrial membrane potential at concentrations below those associated with other adverse outcomes, indicating that the mitochondria may be particularly sensitive to PFOS exposure (Hu et al. Citation2003). Similarly, in a study assessing the effects of PFNA on rat Sertoli cells, PFNA exposure was associated with a decline in mitochondrial integrity and an increase in cell death (Feng et al. Citation2010). While no studies of the effects of PFOA on the mitochondria of testicular tissue exist, PFOA has been shown to induce mitochondrial dysfunction in mouse-derived osteoblast cells, with the introduction of PFOA resulting in a collapse of mitochondrial membrane potential (Choi et al. Citation2017). No studies on PFAS exposure and the mitochondria of germ cells have been conducted. We assessed whether exposure to the PFASs PFOS, PFOA, and PFNA in comparison to a DMSO-only control results in decreases in mitochondrial membrane potential. This assay has been utilized by our lab in a previous study to assess cell viability status and mitochondrial potential (Steves et al. Citation2018). Flow cytometry plots were created showing percentages of live, depolarized/live, depolarized/dead, and dead cells in our in vitro cell cultures (; Supplemental Figure S5). Exposure neither to PFOS, PFOA, nor PFNA significantly decreased mitochondrial membrane potential or increased cell death, consistent with the cell viability results (; Supplemental Figure S5). Similarly, exposure to a mixture of 48-µM PFOS, 25-µM PFOA, and 21.5-µM PFNA did not decrease mitochondrial membrane potential or increase cell death in our cell cultures (; Supplemental Figure S5). As such, these results, combined with the our other data, provide firm evidence that PFOS, PFOA, and PFNA do not affect the viability of spermatogenic cells in our human in vitro cultures.
Figure 3. PFOS, PFOA, PFNA, and a mixture of PFASs do not impact mitochondrial membrane potential in spermatogenic cells derived from hESCs. (A) Flow cytometry analyses for the highest concentrations tested plus a negative control indicating percent live cells, percent a depolarized/live cells, percent depolarized/dead cells, and percent dead cells. Lower right quadrant represents viable cells, lower left quadrant represents depolarized/live cells, upper right quadrant is depolarized/dead cells, and the upper right quadrant is dead cells. (B–E) Graphical representation showing that PFOS, PFOA, PFNA, and a mixture of the PFASs PFOS, PFOA, and PFNA (PFAS mixture) do not impact mitochondrial membrane potential in hESCS differentiated in in vitro spermatogenic conditions. 5,000 events were analyzed, with four (n = 4) replications performed for each condition. Significant changes in mitochondrial membrane potential were determined using a 1-way analysis of variance (1-way ANOVA) and validated via a Student’s t-test, where * is p < 0.05, ** is p < 0.01, and *** is p < 0.001.
PFOS, PFOA, and PFNA do not impact the production of haploid spermatids
Spermatogenic cells work to guarantee genome integrity through cell cycle checkpoints, as infidelity in DNA replication, mistakes in chromosome segregation, and other forms of DNA mutations can occur. Therefore, toxicants that disturb these processes may impact the cell cycle, making cell cycle profiles vital indicators of germ cell health (Shackelford et al. Citation1999). Reports on the impacts of PFASs on the cell cycle of germ cells are limited, though C. elegans exposed to PFOS have experienced mitotic cell arrest in germ cells (Guo et al. Citation2016). Similarly, one study that examined the impacts of various PFASs found that PFOA was able to disrupt the cell cycle of human hepatoblastoma HepG2 cells, and another study reported cell cycle arrest in the spleen and thymus of BALB/c mice upon exposure to PFNA (Fang et al. Citation2008) (Mulkiewicz et al. Citation2007). To determine how these toxicants can impact in vitro spermatogenesis, cell cycle profiles of PFAS-exposed cells and DMSO-only treated cells were generated. This assay has been utilized by our lab in previous studies to assess haploid cell production and cell cycle status (CAt et al. Citation2015; Steves et al. Citation2018). Flow cytometry plots were generated showing the percentage of haploid cells and cells in G0/G1, S phase, and G2 in our cultures (; Supplemental Figure S6). Neither PFOS, PFOA, nor PFNA displayed a significant ability to alter the percentages of haploid, G0/G1, S, or G2 cells undergoing spermatogenesis at any of the concentrations tested (; Supplemental Figure S6). Notably, PFOA exposure resulted in an increasing number of germ cells in G2 phase upon increasing concentration, with a roughly 15% increase in cells in G2 at 100 µM, but this trend was not statistically significant (; Supplemental Figure S6).
Figure 4. PFOS, PFOA, and PFNA do not affect the cell cycle or haploid cell viability in spermatogenic cells derived from hESCs. (A) Flow cytometry analyses of cell cycle profiles following treatment with the highest concentrations of PFOS, PFOA, and PFNA plus a negative control. Green, blue, purple, and beige populations on flow cytometry correspond to haploid, G0/G1, S, and G2 phases, respectively. (B–D) Graphical representation showing that PFOS, PFOA, and PFNA do not affect the cell cycle of actively dividing hESCS differentiated in in vitro spermatogenic conditions. (E–G) Graphical representation showing that exposure to PFOS, PFOA, and PFNA does not impact the percentage of haploid cells in spermatogenic cells derived from hESCs. 5,000 events were analyzed, with three (n = 3) replications performed for each condition. Significant changes in percentages of haploid cells and cells in G0/G1, S phase, and G2 were determined using a 1-way analysis of variance (1-way ANOVA) and validated via a Student’s t-test, where * is p < 0.05, ** is p < 0.01, and *** is p < 0.001.
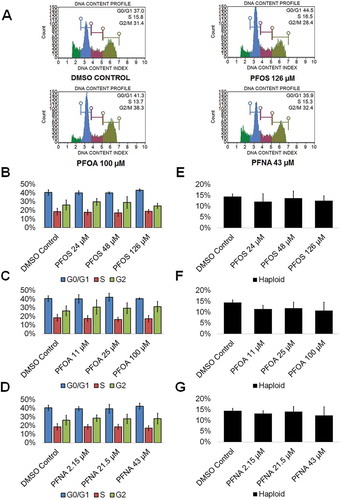
However, the end product of spermatogenesis is haploid spermatids and ultimately sperm. Numerous environmental factors have detrimental impacts on sperm counts (Wong and Cheng Citation2011). Remarkably, exposure to PFOS, PFOA, and PFNA did not impact haploid cell production in our model at any concentration tested () consistent with human studies. PFOA exposure did result in a decreasing percentage of haploid cells with increasing concentration of PFOA, with a roughly 25% decline at 100 µM, though this decline was not statistically significant (; Supplemental Figure S6). These results indicate that these chemicals are not toxic to even the most sensitive of our mixed population of germ cells.
Exposure to PFOS, PFOA, and PFNA impacts the expression of promyelocytic leukemia zinc finger (PLZF) in spermatogonia
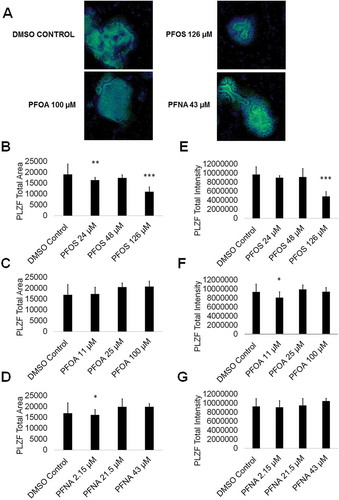
While germ cell viability was not affected, we next examined whether PFAS exposure impacted expression of critical markers of spermatogenesis. Spermatogonia are undifferentiated male germ cells that give rise to mature sperm cells capable of fertilizing an oocyte through the generation of primary spermatocytes followed by secondary spermatocytes and spermatozoa via meiosis (Phillips et al. Citation2010). Any perturbation to spermatogonia could impact fertility. To determine if PFAS exposure impacts spermatogonia, we analyzed the expression of the consensus marker of stem and progenitor spermatogonia, PLZF. We have previously identified PLZF as a reliable marker for spermatogonia in our in vitro model (CAt et al. Citation2012, Citation2015; Steves et al. Citation2018). Using high content imaging, we determined that 24-µM and 126-µM PFOS significantly decreased the area of PLZF+ cells by 14% and 42%, respectively, in comparison to a 0.25% DMSO negative control (, and ; Supplemental Figure S7). Interestingly, 48-µM PFOS shows a 9% decline in PLZF+ area although this result is not statistically significant (; Supplemental Figure S7). Additionally, 2.15-µM PFNA significantly decreased the area of PLZF+ cells by 15% (; Supplemental Figure S7). However, PFOA exposure had no impact on PLZF+ area (; Supplemental Figure S7). Expression levels of PLZF, represented by the total intensity of PLZF+ staining, significantly declined in cells exposed to 126-µM PFOS and 11-µM PFOA by 50% and 17%, respectively (; Supplemental Figure S7). Exposure to PFNA did not impact PLZF intensity in our in vitro cultures (; Supplemental Figure S7). The results from the Annexin V, cell cycle, oxidative stress, and MitoPotential assays all support the con-clusion that PFAS exposure does not impact cell viability during human in vitro spermatogenesis. Therefore, it is unlikely that the decline in PLZF area and expression is the result of spermatogonia undergoing apoptosis in response to PFAS exposure. Decreases in PLZF intensity may be the result of the downregulation of PLZF expression that could block the differentiation of spermatogonia to primary spermatocytes, or alternatively, the ability of spermatogonia to self-renew their own population. The results from the cell cycle assay indicate that haploid spermatid production is not perturbed, as would be expected if differentiation is being blocked by PFAS exposure. However, 100-µM PFOA exposure did result in a roughly 25% decline in haploid spermatid production in the cell cycle assay (; Supplemental Figure S7). Because human spermatogenesis takes approximately 70 days in vivo, and our in vitro differentiation occurs in 10 days, it is possible that a decline in sperm production would be seen upon a longer exposure. Nonetheless, under the conditions examined, certain PFASs do affect PLZF expression and could contribute to fertility issues with further, persistent exposure.
Figure 5. PFOS, PFOA, and PFNA impact PLZF area and intensity in spermatogonia derived under in vitro spermatogenic conditions. (A) Representative 5× images obtained by the Cellomics ArrayScan VT1 of PLZF + (green) and DAPI (blue)-stained colonies treated with the highest concentrations of PFOS, PFOA, and PFNA plus a negative control. All images are taken under the same imaging conditions and parameters. (B–D) Graphical representation showing that PFOS and PFNA reduce average total PLZF+ area in spermatogonia derived under in vitro spermatogenic conditions. (E–G) Graphical representation showing that PFOS and PFOA reduce average total PLZF+ intensity in spermatogonia. Three (n = 3) replications were performed for each condition. Significant changes in PLZF+ area and intensity were determined using a 1-way analysis of variance (1-way ANOVA) and validated via a Student’s t-test, where * is p < 0.05, ** is p < 0.01, and *** is p < 0.001.
Exposure to PFOS, PFOA, and PFNA impacts HILI expression in primary spermatocytes
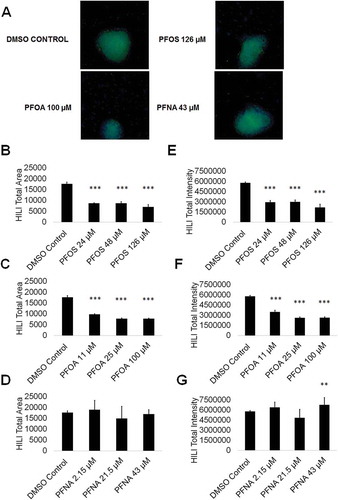
Primary spermatocytes express piwi like RNA-mediated gene silencing 2 (HILI), which functions in the male germline to repress transposons and regulate gene expression, among other processes (Juliano et al. Citation2011). As such, any perturbations in HILI expression in primary spermatocytes could result in mutations and aberrant gene expression in resulting spermatids should the cells fail to undergo apoptosis. To assess if PFAS exposure impacts primary spermatocytes by altering HILI expression, we analyzed for HILI using high content imaging. We have previously identified HILI as a reliable marker for primary spermatocytes in our in vitro model (CAt et al. Citation2012, Citation2015; Steves et al. Citation2018). We determined that the area of HILI+ primary spermatocytes significantly decreased at all concentrations of PFOS and PFOA, with HILI+ area declining by as much as 60% and 56% at 126-µM PFOS and 100-µM PFOA, respectively (; Supplemental Figure S8). HILI+ area was not significantly affected by PFNA exposure (; Supplemental Figure S8). HILI intensity was similarly affected at all concentrations of PFOS and PFOA, with HILI intensity declining by as much as 63% and 55% at 126-µM PFOS and 100-µM PFOA, respectively (; Supplemental Figure S8). Studies have shown that decreases in HILI expression lead to apoptosis arising from elevated transposition and increased double-stranded breaks (Juliano et al. Citation2011). While decreases in HILI expression for PFOS and PFOA are not matched by cell death, it is possible that this downregulation of HILI will ultimately lead to mutations and defects in haploid spermatids. Interestingly, HILI intensity significantly increases at 43-µM PFNA by 14% (; Supplemental Figure S8). Upregulation in HILI could be in response to increased activity of transposons. Increases in HILI could also be the result of increased crossing-over events during meiosis, a process that could introduce mutations, translocations, and other chromosome abnormalities (Louis and Borts Citation2003).
Figure 6. PFOS, PFOA, and PFNA influence HILI area and intensity in primary spermatocytes derived under in vitro spermatogenic conditions. (A) Representative 5× images obtained by the Cellomics ArrayScan VT1 of HILI + (green) and DAPI (blue)-stained colonies treated with the highest concentrations of PFOS, PFOA, and PFNA plus a negative control. All images are taken under the same imaging conditions and parameters. (B–D) Graphical representation showing that PFOS and PFOA exposure impacts average total HILI+ area in primary spermatocytes derived under in vitro spermatogenic conditions. (E–G) Graphical representation showing that exposure to PFOS, PFOA, and PFNA impacts average total HILI+ intensity in primary spermatocytes. Three (n = 3) replications were performed for each condition. Significant changes in HILI+ area and intensity were determined using a 1-way analysis of variance (1-way ANOVA) and validated via a Student’s t-test, where * is p < 0.05, ** is p < 0.01, and *** is p < 0.001.
Discussion
Despite the existence of PFASs in the environment for decades, it remains uncertain how these chemicals may be impacting human reproductive health. Human and animal model data conflict as to whether or not these chemicals affect germ cell viability, and ultimately, male fertility. Most studies examining the impacts PFOS, PFOA, and PFNA on semen parameters do not report declines in semen volume or sperm number (Governini et al. Citation2015; Joensen et al. Citation2013; Kvist et al. Citation2012; Liu et al. Citation2015; Raymer et al. Citation2012; Specht et al. Citation2012; Toft et al. Citation2012; Vested et al. Citation2013). Studies in rodents assessing the impact PFASs have on spermatogenesis have shown significant declines in sperm count, in stark contrast to the results found in human studies (Fan et al. Citation2005; Kato et al. Citation2015; Liu et al. Citation2015) highlighting the disconnect between rodent and human studies. Rodent studies have identified Sertoli cells, seminiferous tubules, and the epididymis as targets of PFASs (Kato et al. Citation2015; Liu et al. Citation2015; Lu et al. Citation2016; Qiu et al. Citation2016; Wan et al. Citation2014; Zhang et al. Citation2014). Specifically, PFOS exposure in male CD-1 mice led to decreases in testicular gonadotropin receptors and decreased expression of growth hormone receptor (GHR), insulin-like growth factor 1 receptor precursor (IGF1R), inhibins, and activins (Wan et al. Citation2011). These impacts were associated with impairment of testicular steroidogenesis resulting in less testosterone and less sperm in the epididymis (Wan et al. Citation2011). PFAS exposure has similarly been shown to inhibit aromatase in a human placental cell line, further suggesting that they interfere with steroidogenesis (Gorrochategui et al. Citation2014). While effects of PFAS exposure on steroidogenesis and somatic support cell viability were not tested in this study, our study provides information on the impacts of exposure to PFOS, PFOA, and PFNA directly on spermatogenic cells.
Here, we report that exposure to PFOS, PFOA, PFNA, and a mixture of PFOS, PFOA, and PFNA do not increase ROS production or cause mitochondrial dysfunction that may lead to germ cell death. Additionally, exposure to PFOS, PFOA, and PFNA does not induce apoptosis of spermatogenic cells or have impacts on the cell cycle or haploid spermatid production. Therefore, our in vitro human spermatogenesis model recapitulates the results reported in human cohort studies. This is an important result that further validates our model as a high throughput system for examining direct impacts on human male germ cells. Exposure to PFOS, PFOA, and PFNA did have impacts on spermatogonia in our in vitro model by decreasing PLZF area and intensity at certain concentrations. Though further studies are needed, it is possible that exposure to PFASs inhibits the ability of spermatogonia to maintain their own population. The results of our cell cycle analyses indicate that, in such a case, spermatogonia are still capable of differentiation, but these cells do not continue to self-renew, suggesting terminal differentiation and a potential exhaustion of the spermatogonial stem cell pool. Due to limitations in our current model, we are unable to assess whether PFASs disrupt spermatogonia self-renewal. Enhancements to our model or additional models will need to be developed to answer this important question.
Additionally, HILI area and intensity decreased upon exposure to PFOS and PFOA, though this decrease is likely not due to death of primary spermatocytes or cell cycle arrest. Specific transcription factors for HILI expression in male germ cells have not been identified, and it is unclear how exposure to PFASs could impact HILI expression. Importantly, HILI maintains germline integrity by repressing transposable elements during meiosis, regulating gene expression at the epigenetic, post-transcriptional, and translational levels in primary spermatocytes, and through involvement in chromosome synapsis during meiosis (Juliano et al. Citation2011). A decrease in HILI expression could result in activated retrotransposons, aberrant gene expression, and failure of cells to undergo meiosis properly.
This study highlights the ability of our in vitro model to assess chemical exposure under persistent conditions relevant to populations exposed to high levels of PFASs in the environment and those who are occupationally exposed. This study also uniquely attempts to mimic real-world exposures by investigating the effects of PFAS mixtures on spermatogenesis. While we are not able in our model to assess impacts of chemical exposure on the somatic environment, the results of this study indicate that our model is suitable as a reliable, high-throughput screening system for assessing direct effects of chemical exposure on human spermatogenic cells.
Materials and methods
Cell culture and PFAS treatment
NIH-approved WA01 (H1, WiCell, Madison, WI) male hESCs were cultured and maintained in mTeSR1 (STEMCELL Technologies, Vancouver, Canada) on matrigel (Corning Life Sciences, Tewksbury, MA) as previously described (CAt et al. Citation2012). All experimental approaches and human stem cell use are approved by the University of Georgia Institutional Biosafety Committee. Direct differentiation into spermatogenic lineages was performed as described (CAt et al. Citation2012, Citation2015). Differentiating cells were maintained in mouse spermatogonial stem cell (SSC) medium containing the following (all from MilliporeSigma, St. Louis, MO, unless noted): MEMalpha (Invitrogen, Waltham, MA), 0.2% Bovine Serum Albumin, 5 µg/mL insulin, 10 µg/mL transferrin, 60-µM putrescine, 2-mM L-glutamine (Invitrogen, Waltham, MA), 50-µM β-mercaptoethanol, 1 ng/mL hbFGF (human basic fibroblast growth factor, PeproTech, Rocky Hill, NJ), 20 ng/mL glial-derived neurotrophic factor (PeproTech, Rocky Hill, NJ), 30-nM sodium selenite, 2.36-µM palmitic acid, 0.21-µM palmitoleic acid, 0.88-µM stearic acid, 1.02-µM oleic acid, 2.71-µM linoleic acid, 0.43-µM linolenic acid, 10-mM HEPES, and 0.5× penicillin/streptomycin (Invitrogen, Waltham, MA) for 10 days. Cells were continuously treated with PFOS (INDOFINE Chemical Company, Inc., Hillsborough, NJ) at concentrations of 24 µM, 48 µM, or 126 µM; PFOA (MilliporeSigma, St. Louis, MO) at concentrations of 11 µM, 25 µM, or 100 µM; and PFNA (MilliporeSigma, St. Louis, MO) at concentrations of 2.15 µM, 21.5 µM, or 43 µM beginning on day 1 of the differentiation. Cells were maintained in SSC media with PFASs dissolved in DMSO or DMSO-only negative control for the entire 10-day differentiation process, with media changes occurring every other day, or treated with a 200-µM hydrogen peroxide positive control for 6 h.
Cell viability and apoptosis
Cell viability was assessed by measuring the percent of apoptotic cells in our cultures using the Muse® Annexin V and Dead Cell Assay Kit (MilliporeSigma, Billerica, MA) by staining unfixed cells with Annexin V and 7-AAD as per manufacturer’s instructions to prepare samples for flow cytometry. Samples were run on the Muse® benchtop flow cytometer (MilliporeSigma, Billerica, MA). For each flow cytometry-based experiment, 5,000 events were analyzed for four replications (n = 4) per chemical concentration and DMSO-only control.
Mitochondrial membrane potential
Mitochondrial membrane potential was assessed using the Muse® MitoPotential Kit (MilliporeSigma, Billerica, MA) by staining unfixed cells with a supplied cationic, lipophilic dye and 7-AAD as per manufacturer’s instructions to prepare samples for flow cytometry. Samples were run on the Muse® benchtop flow cytometer (MilliporeSigma, Billerica, MA). For each flow cytometry-based experiment, 5,000 events were analyzed for four replications (n = 4) per chemical concentration and DMSO-only control.
ROS generation
ROS generation was assessed by the Muse® Oxidative Stress Kit (MilliporeSigma, Billerica, MA) by staining unfixed cells with dihydroethidium as per manufacturer’s instructions to prepare samples for flow cytometry. Samples were run on the Muse® benchtop flow cytometer (MilliporeSigma, Billerica, MA). For each flow cytometry-based experiment, 5,000 events were analyzed for five replications (n = 5) per chemical concentration and DMSO-only control.
Haploid cell production and cell cycle progression
Haploid cell production and cell cycle progression were assessed by generating cell cycle plots revealing haploid cell, G0/G1, S phase, and G2 peaks using the Muse® Cell Cycle Assay Kit (MilliporeSigma, Billerica, MA) by staining fixed cells with propidium iodide as per manufacturer’s instructions to prepare samples for flow cytometry. Samples were run on the Muse® benchtop flow cytometer (MilliporeSigma, Billerica, MA). For each flow cytometry-based experiment, 5,000 events were analyzed for three replications (n = 3) per chemical concentration and DMSO-only control. Haploid peaks were analyzed using guavaSoft™ 3.1.1 (MilliporeSigma, Billerica, MA).
Spermatogonial cell lineage markers
High content imaging of differentiated hESCs was performed on the ThermoFisher Cellomics ArrayScan® VTI (Thermofisher, Waltham, MA). Quantitative analyses for average PLZF+ (promyelocytic leukemia zinc finger, R&D System, Minneapolis, MN) and HILI+ (piwi like RNA-mediated gene silencing 2, Abcam, Cambridge, MA) total colony area and average total intensity of PLZF+ and HILI+ staining per colony were determined using HCS Studio™ 2.0 Cell Analysis Software included with the ArrayScan® suite. PLZF and HILI immunostaining was performed as previously described (CAt et al. Citation2012). Briefly, cells were fixed with 4% paraformaldehyde, blocked in a 5% BSA blocking buffer in 0.1% Triton X, and stained with PLZF at a concentration of 1.25 µg/mL and HILI at a concentration of 2.25 µg/mL. Three replications (n = 3 wells, >50 colonies/well) were performed per condition and DMSO-only control.
Statistical analysis
Significant differences in samples in comparison to DMSO-only control were determined using a 1-way analysis of variance (1-way ANOVA) and validated via a Student’s t-test, where * is p < 0.05, ** is p < 0.01, and *** is p < 0.001.
Supplemental Material
Download Zip (2 MB)Acknowledgments
This work was supported by the National Science Foundation under Grant DGE-1444932; the National Institutes of Health under Grant 1K22 ES025418-01; Emory University’s Atlanta Clinical & Translational Science Institute and University Research Committee (ACTSI/URC) award; and the National Institutes of Health under Grant P30 ES019776-01-A1.
Disclosure statement
No potential conflict of interest was reported by the authors.
Supplemental Material
Supplemental data for this article can be accessed here.
Additional information
Funding
Notes on contributors
Charles A. Easley
Designed and conducted experiments and wrote the paper: AS; Conducted experiments and wrote the paper: AT, BG; Designed and conducted experiments: DC; Conducted experiments: JB, IB; Designed experiments: GM, WMC; Designed experiments and served as the primary mentors to AS: AC, CE.
Related Research Data
References
- Agarwal A, Virk G, Ong C, du Plessis SS. 2014. Effect of oxidative stress on male reproduction. World J Mens Health. 32(1):1–17.
- Aitken RJ, Baker MA. 2013. Causes and consequences of apoptosis in spermatozoa; contributions to infertility and impacts on development. Int J Dev Biol. 57(2–4):265–272.
- Aly HA. 2013. Aroclor 1254 induced oxidative stress and mitochondria mediated apoptosis in adult rat sperm in vitro. Environ Toxicol Pharmacol. 36(2):274–283.
- Arvaniti OS, Stasinakis AS. 2015. Review on the occurrence, fate and removal of perfluorinated compounds during wastewater treatment. Sci Total Environ. 524-525:81–92.
- Attene-Ramos MS, Huang R, Sakamuru S, Witt KL, Beeson GC, Shou L, Schnellmann RG, Beeson CC, Tice RR, Austin CP, et al. 2013. Systematic study of mitochondrial toxicity of environmental chemicals using quantitative high throughput screening. Chem Res Toxicol. 26(9):1323–1332.
- Bloom MS, Whitcomb BW, Chen Z, Ye A, Kannan K, Buck Louis GM. 2015. Associations between urinary phthalate concentrations and semen quality parameters in a general population. Hum Reprod. 30(11):2645–2657.
- Buhrke T, Kibellus A, Lampen A. 2013. In vitro toxicological characterization of perfluorinated carboxylic acids with different carbon chain lengths. Toxicol Lett. 218(2):97–104.
- Calafat AM, Wong LY, Kuklenyik Z, Reidy JA, Needham LL. 2007. Polyfluoroalkyl chemicals in the U.S. population: data from the National Health and Nutrition Examination Survey (NHANES) 2003–2004 and comparisons with NHANES 1999–2000. Environ Health Perspect. 115(11):1596–1602.
- CAt E, Bradner JM, Moser A, Rickman CA, McEachin ZT, Merritt MM, Hansen JM, Caudle WM. 2015. Assessing reproductive toxicity of two environmental toxicants with a novel in vitro human spermatogenic model. Stem Cell Res. 14(3):347–355.
- CAt E, Phillips BT, McGuire MM, Barringer JM, Valli H, Hermann BP, Simerly CR, Rajkovic A, Miki T, Orwig KE, et al. 2012. Direct differentiation of human pluripotent stem cells into haploid spermatogenic cells. Cell Rep. 2(3):440–446.
- Choi EM, Suh KS, Rhee SY, Oh S, Woo JT, Kim SW, Kim YS, Pak YK, Chon S. 2017. Perfluorooctanoic acid induces mitochondrial dysfunction in MC3T3-E1 osteoblast cells. J Environ Sci Health A Tox Hazard Subst Environ Eng. 52(3):281–289.
- Erkekoglu P, Kocer-Gumusel B. 2014. Genotoxicity of phthalates. Toxicol Mech Methods. 24(9):616–626.
- Fan YO, Jin YH, Ma YX, Zhang YH. 2005. Effects of perfluorooctane sulfonate on spermiogenesis function of male rats. Wei Sheng Yan Jiu. 34(1):37–39.
- Fang X, Feng Y, Wang J, Dai J. 2010. Perfluorononanoic acid-induced apoptosis in rat spleen involves oxidative stress and the activation of caspase-independent death pathway. Toxicology. 267(1–3):54–59.
- Fang X, Zhang L, Feng Y, Zhao Y, Dai J. 2008. Immunotoxic effects of perfluorononanoic acid on BALB/c mice. Toxicol Sci. 105(2):312–321.
- Feng Y, Fang X, Shi Z, Xu M, Dai J. 2010. Effects of PFNA exposure on expression of junction-associated molecules and secretory function in rat Sertoli cells. Reprod Toxicol. 30(3):429–437.
- Feng Y, Shi Z, Fang X, Xu M, Dai J. 2009. Perfluorononanoic acid induces apoptosis involving the Fas death receptor signaling pathway in rat testis. Toxicol Lett. 190(2):224–230.
- Fu J, Gao Y, Cui L, Wang T, Liang Y, Qu G, Yuan B, Wang Y, Zhang A, Jiang G. 2016. Occurrence, temporal trends, and half-lives of perfluoroalkyl acids (PFAAs) in occupational workers in China. Sci Rep. 6:38039.
- Gorrochategui E, Lacorte S, Tauler R, Martin FL. 2016. Perfluoroalkylated substance effects in xenopus laevis A6 kidney epithelial cells determined by ATR-FTIR spectroscopy and chemometric analysis. Chem Res Toxicol. 29(5):924–932.
- Gorrochategui E, Perez-Albaladejo E, Casas J, Lacorte S, Porte C. 2014. Perfluorinated chemicals: differential toxicity, inhibition of aromatase activity and alteration of cellular lipids in human placental cells. Toxicol Appl Pharmacol. 277(2):124–130.
- Governini L, Guerranti C, De Leo V, Boschi L, Luddi A, Gori M, Orvieto R, Piomboni P. 2015. Chromosomal aneuploidies and DNA fragmentation of human spermatozoa from patients exposed to perfluorinated compounds. Andrologia. 47(9):1012–1019.
- Guo X, Li Q, Shi J, Shi L, Li B, Xu A, Zhao G, Wu L. 2016. Perfluorooctane sulfonate exposure causes gonadal developmental toxicity in Caenorhabditis elegans through ROS-induced DNA damage. Chemosphere. 155:115–126.
- Guruge KS, Taniyasu S, Yamashita N, Wijeratna S, Mohotti KM, Seneviratne HR, Kannan K, Yamanaka N, Miyazaki S. 2005. Perfluorinated organic compounds in human blood serum and seminal plasma: a study of urban and rural tea worker populations in Sri Lanka. J Environ Monit. 7(4):371–377.
- Hu W, Jones PD, DeCoen W, King L, Fraker P, Newsted J, Giesy JP. 2003. Alterations in cell membrane properties caused by perfluorinated compounds. Comp Biochem Physiol C Toxicol Pharmacol. 135(1):77–88.
- Hu XC, Andrews DQ, Lindstrom AB, Bruton TA, Schaider LA, Grandjean P, Lohmann R, Carignan CC, Blum A, Balan SA, et al. 2016. Detection of poly- and perfluoroalkyl substances (PFASs) in U.S. drinking water linked to industrial sites, military fire training areas, and wastewater treatment plants. Environ Sci Technol Lett. 3(10):344–350.
- Joensen UN, Veyrand B, Antignac JP, Blomberg Jensen M, Petersen JH, Marchand P, Skakkebaek NE, Andersson AM, Le Bizec B, Jorgensen N. 2013. PFOS (perfluorooctanesulfonate) in serum is negatively associated with testosterone levels, but not with semen quality, in healthy men. Hum Reprod. 28(3):599–608.
- Juliano C, Wang J, Lin H. 2011. Uniting germline and stem cells: the function of Piwi proteins and the piRNA pathway in diverse organisms. Annu Rev Genet. 45:447–469.
- Jusko TA, Oktapodas M, Palkovicova Murinova L, Babinska K, Babjakova J, Verner MA, DeWitt JC, Thevenet-Morrison K, Conka K, Drobna B, et al. 2016. Demographic, reproductive, and dietary determinants of perfluorooctane sulfonic (PFOS) and perfluorooctanoic acid (PFOA) concentrations in human colostrum. Environ Sci Technol. 50(13):7152–7162.
- Kato H, Fujii S, Takahashi M, Matsumoto M, Hirata-Koizumi M, Ono A, Hirose A. 2015. Repeated dose and reproductive/developmental toxicity of perfluorododecanoic acid in rats. Environ Toxicol. 30(11):1244–1263.
- Kato K, Wong LY, Jia LT, Kuklenyik Z, Calafat AM. 2011. Trends in exposure to polyfluoroalkyl chemicals in the U.S. Population: 1999–2008. Environ Sci Technol. 45(19):8037–8045.
- Kvist L, Giwercman YL, Jonsson BA, Lindh CH, Bonde JP, Toft G, Strucinski P, Pedersen HS, Zvyezday V, Giwercman A. 2012. Serum levels of perfluorinated compounds and sperm Y:X chromosome ratio in two European populations and in Inuit from Greenland. Reprod Toxicol. 34(4):644–650.
- Lei M, Zhang L, Lei J, Zong L, Li J, Wu Z, Wang Z. 2015. Overview of emerging contaminants and associated human health effects. Biomed Res Int. 2015:404796.
- Li Y, Fletcher T, Mucs D, Scott K, Lindh CH, Tallving P, Jakobsson K. 2018. Half-lives of PFOS, PFHxS and PFOA after end of exposure to contaminated drinking water. Occup Environ Med. 75(1):46–51.
- Liu W, Yang B, Wu L, Zou W, Pan X, Zou T, Liu F, Xia L, Wang X, Zhang D. 2015. Involvement of NRF2 in perfluorooctanoic acid-induced testicular damage in male mice. Biol Reprod. 93(2):41.
- Louis EJ, Borts RH. 2003. Meiotic recombination: too much of a good thing? Curr Biol. 13(24):R953–R955.
- Louis GM, Chen Z, Schisterman EF, Kim S, Sweeney AM, Sundaram R, Lynch CD, Gore-Langton RE, Barr DB. 2015. Perfluorochemicals and human semen quality: the LIFE study. Environ Health Perspect. 123(1):57–63.
- Lu Y, Pan Y, Sheng N, Zhao AZ, Dai J. 2016. Perfluorooctanoic acid exposure alters polyunsaturated fatty acid composition, induces oxidative stress and activates the AKT/AMPK pathway in mouse epididymis. Chemosphere. 158:143–153.
- Maiorino M, Ursini F. 2002. Oxidative stress, spermatogenesis and fertility. Biol Chem. 383(3–4):591–597.
- Matic I. 2018. The major contribution of the DNA damage-triggered reactive oxygen species production to cell death: implications for antimicrobial and cancer therapy. Curr Genet. 64(3):567–569.
- Mulkiewicz E, Jastorff B, Skladanowski AC, Kleszczynski K, Stepnowski P. 2007. Evaluation of the acute toxicity of perfluorinated carboxylic acids using eukaryotic cell lines, bacteria and enzymatic assays. Environ Toxicol Pharmacol. 23(3):279–285.
- Olsen GW, Ellefson ME, Mair DC, Church TR, Goldberg CL, Herron RM, Medhdizadehkashi Z, Nobiletti JB, Rios JA, Reagen WK, et al. 2011. Analysis of a homologous series of perfluorocarboxylates from American Red Cross adult blood donors, 2000–2001 and 2006. Environ Sci Technol. 45(19):8022–8029.
- Phillips BT, Gassei K, Orwig KE. 2010. Spermatogonial stem cell regulation and spermatogenesis. Philos Trans R Soc Lond B Biol Sci. 365(1546):1663–1678.
- Poothong S, Thomsen C, Padilla-Sanchez JA, Papadopoulou E, Haug LS. 2017. Distribution of novel and well-known poly- and perfluoroalkyl substances (PFASs) in human serum, plasma, and whole blood. Environ Sci Technol. 51(22):13388–13396.
- Qiu L, Qian Y, Liu Z, Wang C, Qu J, Wang X, Wang S. 2016. Perfluorooctane sulfonate (PFOS) disrupts blood-testis barrier by down-regulating junction proteins via p38 MAPK/ATF2/MMP9 signaling pathway. Toxicology. 373:1–12.
- Qu JH, Lu CC, Xu C, Chen G, Qiu LL, Jiang JK, Ben S, Wang YB, Gu AH, Wang XR. 2016. Perfluorooctane sulfonate-induced testicular toxicity and differential testicular expression of estrogen receptor in male mice. Environ Toxicol Pharmacol. 45:150–157.
- Raymer JH, Michael LC, Studabaker WB, Olsen GW, Sloan CS, Wilcosky T, Walmer DK. 2012. Concentrations of perfluorooctane sulfonate (PFOS) and perfluorooctanoate (PFOA) and their associations with human semen quality measurements. Reprod Toxicol. 33(4):419–427.
- Ryter SW, Kim HP, Hoetzel A, Park JW, Nakahira K, Wang X, Choi AM. 2007. Mechanisms of cell death in oxidative stress. Antioxid Redox Signal. 9(1):49–89.
- Schmidt CW. 2010. Unraveling environmental effects on mitochondria. Environ Health Perspect. 118(7):A292–A297.
- Shackelford RE, Kaufmann WK, Paules RS. 1999. Cell cycle control, checkpoint mechanisms, and genotoxic stress. Environ Health Perspect. 107(Suppl 1):5–24.
- Specht IO, Hougaard KS, Spano M, Bizzaro D, Manicardi GC, Lindh CH, Toft G, Jonsson BA, Giwercman A, Bonde JP. 2012. Sperm DNA integrity in relation to exposure to environmental perfluoroalkyl substances - a study of spouses of pregnant women in three geographical regions. Reprod Toxicol. 33(4):577–583.
- Steenland K, Tinker S, Frisbee S, Ducatman A, Vaccarino V. 2009. Association of perfluorooctanoic acid and perfluorooctane sulfonate with serum lipids among adults living near a chemical plant. Am J Epidemiol. 170(10):1268–1278.
- Steenland K, Woskie S. 2012. Cohort mortality study of workers exposed to perfluorooctanoic acid. Am J Epidemiol. 176(10):909–917.
- Steves AN, Bradner JM, Fowler KL, Clarkson-Townsend D, Gill B, Turry A, Caudle WM, Miller GW, Chan AWS, Easley CA. 2018. Ubiquitous flame-retardant toxicants impair spermatogenesis in a human stem cell model. iScience. 3:161–176.
- Toft G, Jonsson BA, Lindh CH, Giwercman A, Spano M, Heederik D, Lenters V, Vermeulen R, Rylander L, Pedersen HS, et al. 2012. Exposure to perfluorinated compounds and human semen quality in Arctic and European populations. Hum Reprod. 27(8):2532–2540.
- Vested A, Ramlau-Hansen CH, Olsen SF, Bonde JP, Kristensen SL, Halldorsson TI, Becher G, Haug LS, Ernst EH, Toft G. 2013. Associations of in utero exposure to perfluorinated alkyl acids with human semen quality and reproductive hormones in adult men. Environ Health Perspect. 121(4):453–458.
- Wan HT, Mruk DD, Wong CK, Cheng CY. 2014. Perfluorooctanesulfonate (PFOS) perturbs male rat Sertoli cell blood-testis barrier function by affecting F-actin organization via p-FAK-Tyr(407): an in vitro study. Endocrinology. 155(1):249–262.
- Wan HT, Zhao YG, Wong MH, Lee KF, Yeung WS, Giesy JP, Wong CK. 2011. Testicular signaling is the potential target of perfluorooctanesulfonate-mediated subfertility in male mice. Biol Reprod. 84(5):1016–1023.
- Wielsoe M, Long M, Ghisari M, Bonefeld-Jorgensen EC. 2015. Perfluoroalkylated substances (PFAS) affect oxidative stress biomarkers in vitro. Chemosphere. 129:239–245.
- Wong EW, Cheng CY. 2011. Impacts of environmental toxicants on male reproductive dysfunction. Trends Pharmacol Sci. 32(5):290–299.
- Worley RR, Moore SM, Tierney BC, Ye X, Calafat AM, Campbell S, Woudneh MB, Fisher J. 2017. Per- and polyfluoroalkyl substances in human serum and urine samples from a residentially exposed community. Environ Int. 106:135–143.
- Wu XM, Bennett DH, Calafat AM, Kato K, Strynar M, Andersen E, Moran RE, Tancredi DJ, Tulve NS, Hertz-Picciotto I. 2015. Serum concentrations of perfluorinated compounds (PFC) among selected populations of children and adults in California. Environ Res. 136:264–273.
- Zhang DY, Xu XL, Shen XY, Ruan Q, Hu WL. 2015. Analysis of apoptosis induced by perfluorooctane sulfonates (PFOS) in mouse Leydig cells in vitro. Toxicol Mech Methods. 25(1):21–25.
- Zhang H, Lu Y, Luo B, Yan S, Guo X, Dai J. 2014. Proteomic analysis of mouse testis reveals perfluorooctanoic acid-induced reproductive dysfunction via direct disturbance of testicular steroidogenic machinery. J Proteome Res. 13(7):3370–3385.