
ABSTRACT
FSH in infertile patients may be measured in the normal range and abnormal semen analysis findings may be observed in patients with normal FSH values. A recent study predicts that the sperm morphology and concentration may be impaired if the FSH value is above 4.5 IU/L. Therefore, this study aimed to define a clinically more useful upper limit for FSH as an indicator for male infertility. In this study 1,893 infertile male patients were evaluated retrospectively. Physical examination, hormone analysis (total testosterone (TT), FSH, luteinizing hormone (LH), estradiol (E2), sex hormone binding globulin (SHBG) and prolactin (PRL)), semen analyzes were recorded and analyzed retrospectively. Logistic regression analysis, 95% confidence intervals and probability ratios were calculated to show the relationship between categorical hormone levels (quarters) and semen parameters. Hormone levels were categorized using the distribution quarters in the study population. FSH values of 62% of the cases with sperm concentration <15 million/ml were greater than 4.8 IU/L. 59.7% of patients with sperm count <39 million had FSH values greater than 4.8 IU/L. In conclusion, FSH values above 4.8 IU/L were found to be abnormal when the male factor was investigated for infertility.
Abbreviations
FSH: Follicular Stimulating Hormone; GnRH: Gonadotropin-releasing Hormone; HPGA: Hypothalamic-Pituitary-Gonadal Axis; TT: Total Testosterone; LH: Luteinizing Hormone; E2: Estradiol; SHBG: Sex Hormone Binding Globulin; PRL: Prolactin; WHO: World Health Organization; AUC: Area Under the Curve
Introduction
Follicular Stimulating Hormone (FSH) which is released with the stimulation of Gonadotropin-releasing Hormone (GnRH) and other factors, and whose secretion is modulated by glycoproteins such as Activin and Inhibin, is a peptide-structured hormone. It is secreted from the anterior part of the pituitary gland. FSH indicates the ability to produce sperm as a result of the feedback mechanism in the hypothalamic-pituitary-gonadal axis (HPGA) (Nieschlag et al. Citation1999; Tsutsui et al. Citation2010). Though the diurnal variability of FSH, a single serum FSH measurement shows the expected FSH value with great reliability. Hormonal assessment is also recommended as a part of the full evaluation in infertility. A high FSH level is an indicator of abnormal spermatogenesis and testicular insufficiency (Jarow et al. Citation2010).
Although the normal range FSH value varies according to the hormone kits used, this range is indicated as 1.4–18.1 IU/L based on FSH kit used in our clinic (SiemensHealthcare Diagnostics I Citation2008). This wide range is not very useful in clinical evaluation. In the past studies on infertility, the relationship between semen quality and FSH levels has been investigated and a significant inverse relationship has been described between FSH levels and sperm concentration and sperm morphology (Sina et al. Citation1975; Morrow et al. Citation1986; Jensen et al. Citation1997; Uhler et al. Citation2003; Meeker et al. Citation2007). Some of these studies have suggested that FSH values above 10 IU/L may be determinant for abnormal sperm concentration (Jensen et al. Citation1997; Uhler et al. Citation2003).
The level of serum FSH indicates seminiferous epithelial status in an infertile man. FSH levels are generally high in azoospermic men due to severe damage to the germ cells. However, a normal FSH level measured with existing laboratory kits may not mean that spermatogenesis is normal. The presence of a well working hormonal system for male fertility assessment is needed. The endocrine assessment in infertile men aims to examine whether there is any hormonal disorder that may adversely affect spermatogenesis. Endocrine causes of male infertility constitute 10–16% of all infertile cases (Nieschlag et al. Citation2010).
FSH in infertile patients may be measured in the normal range and abnormal semen analysis findings may be observed in patients with normal FSH values. Although it was accepted that the serum FSH value should be 1.4–18.1 IU/L in men, a recent study predicts that the sperm morphology and concentration may be impaired if the FSH value is above 4.5 IU/L (Gordetsky et al. Citation2012). In the evaluation of serum FSH levels in male infertility, it is stated that there is a need for a new determination of the upper reference range, and it is suggested that levels above 4.5 IU/L should be considered abnormal (Ozkaya et al. Citation2013).
Therefore, this study aimed to define a clinically more useful upper reference range for FSH as an indicator for male infertility and to use this hormone as an indicator that may be more useful in predicting fertility potential in men.
Results
The data of 1,893 patients who met the inclusion criteria were evaluated. The mean age of these cases was 30.7 ± 5.2 (18–50) years. The mean BMI was 26.0 ± 3.8 kg/m2. 601 (31.7%) of the cases were azoospermic, 756 (39.9%) were oligozoospermic and the remaining 536 (28.3%) were normozoospermic. The cases were divided into subgroups according to their sperm count and semen analysis parameters which are shown in .
Table 1. Demographic data and semen analysis parameters of groups.
We evaluated the relationship between sperm counts and hormonal parameters (Follicular Stimulating Hormone: FSH, Total Testosterone: TT, total testosterone/Follicular Stimulating Hormone: TT/FSH). With the exclusion of azoospermic patients, the rest with sperm in their ejaculate (n = 1,292) were categorized as having a normal (≥15 million) (n = 536) and an abnormal (<15 million) (n = 756) sperm count or as normal (≥39 million) (n = 520) and abnormal (<39 million) (772) in terms of total sperm count in the whole ejaculate.
When azoospermic patients were excluded, it was seen that 62% of the patients whose sperm concentrations were <15 million/ml had >4.8 IU/L FSH levels (p < 0.001). Similarly, 59.7% of the patients whose sperm counts were <39 million/ml had >4.8 IU/L FSH levels (p < 0.001). It was determined that the semen parameters were abnormal when FSH levels were >4.8 IU/L (p < 0.05) (). By the same grouping, sperm concentration of 60.7% of the patients had a TT/FSH value <89.68 (p < 0.001). Only 61 of the patients whose TT/FSH value <49.11 had normal sperm concentrations, on the other hand, 262 of them had abnormal parameters. ().
Table 2. Patient counts and percentages due to FSH quartiles and sperm concentrations.
Table 3. Patient counts and percentages due to TT/FSH quartiles and sperm concentrations.
FSH values in 62% of the cases with a sperm concentration <15 million/ml were greater than 4.8 IU/L and it was significant when compared to the same quartile of >15 million/ml group (p < 0.001). A total of 60.7% had a TT/FSH value less than 89.68 (p < 0.001) and a TT value of 48.6% were found to be < 426 ng/dl (p = 0.402). There was no statistically significant correlation between sperm count and TT levels. Only 43 of the patients with an FSH value of ≥8 IU/L (n: 323) had normal sperm concentration while 280 were abnormal. Only 60 of the cases with TT/FSH value <49.11 (n: 322) had a normal sperm concentration while 262 were abnormal. When the FSH value was ≥8 IU/L in any patient, the risk of abnormal sperm concentration increased by 10-fold compared to the samples with FSH level <2.95 IU/L (95% CI, 7.05–15.44). When the TT/FSH <49.11 in any patient, the risk of abnormal sperm concentration was 6 times higher compared to the ones with TT/FSH >153.52 (95% CI, 4.23–8.63) (–).
Table 4. Patient counts and percentage due to FSH quartiles and total sperm counts.
Table 5. Patient counts and percentage due to TT/FSH quartiles and total sperm counts.
A total of 59.7% of patients with a sperm count <39 million had FSH values greater than 4.8 IU/L and it was significant when compared to the same quartile of >39 million/ml group (p < 0.001), 59.4% had TT/FSH values less than 89.68 (p < 0.001) and 49.5% had TT value <426 ng/dl (p = 0.391). There was no statistically significant relationship between total sperm count and TT levels. Only 48 (14.9%) patients with an FSH value of ≥8 IU/L (n: 323) had a normal sperm concentration while 275 of them were abnormal. When the FSH value was ≥8 IU/L, the risk of abnormal sperm concentration was increased 7.5-fold compared to FSH <2.95 IU/L (95% CI, 5.18–11.03). Only 60 cases with TT/FSH value <49.11 (n: 322) had a normal sperm concentration while 262 were abnormal. When the TT/FSH value was <49.11, the risk of abnormal sperm count was increased 5-fold compared to TT/FSH >153.52 (95% CI, 3.78–7.70) (–).
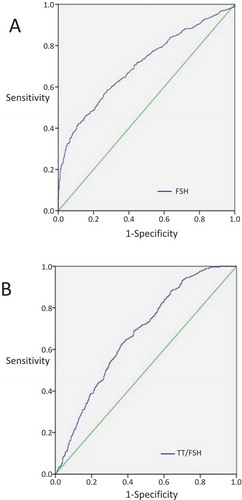
After selecting sperm concentration as a state variable, receiver-operating characteristic (ROC) curves were created by using the data summarized in –. The sensitivity was 58.5% −64.5%, the specificity was 72.4–61.4%, respectively for the cutoff values as FSH was 5.18 IU/L and TT/FSH was 91.66, and the area under the curve (AUC) value was 0.704–0.673. (p < 0.001) (). The discriminative power of the test for FSH was fulfilling and it was enough for the TT/FSH ratio as well as these values were statistically significant.
Figure 1. ROC curves; the relationship between sperm concentration and FSH (A) and TT/FSH (B). State variable was sperm concentration in the both curves. When FSH’s cutoff value was 5.18 IU/L, sensitivity 58.5% and specificity was 72.4% (A). When TT/FSH’s cutoff value was 91.66, sensitivity 64.5% and specificity was 61.4% (B).
When all patients, including the azoospermic patients, were included according to the number of sperm per milliliter, FSH value of 34.6% of the cases with a sperm concentration of <15 million/ml was greater than 16.35 IU/L was significant when compared to the same quartile of >15 million/ml group (p < 0.001) and in 61.8% TT/FSH value was 61.9 (p < 0.001), and in 51.7% TT was found to be <399 ng/dl (p < 0.003). Only 3 of the patients with FSH values of ≥16.35 IU/L (n: 473) were of normal sperm concentration while 470 were abnormal. When FSH was 6.62–16.35 IU/L, the risk of abnormal sperm concentration was found to be 6 times higher compared to FSH <3.56 IU/L (95% CI, 4.74–8.68), and it was 198 times higher when FSH ≥16.35 IU/L (95% CI, 62.69–624.74). Only 2 of the cases with a TT/FSH value of <23.99 (n: 472) were of normal sperm concentration, while 470 were abnormal. When the TT/FSH ratio was less than 23.99, the risk of abnormal sperm concentration increased by 249-fold when compared to TT/FSH ratio is 123.33 (95% CI, 61.46–1011.77) (,).
Table 6. Patient counts and percentages due to FSH quartiles and sperm concentrations in the whole study population.
Table 7. Patient counts and percentages due to TT/FSH quartiles and sperm concentrations in the whole study population.
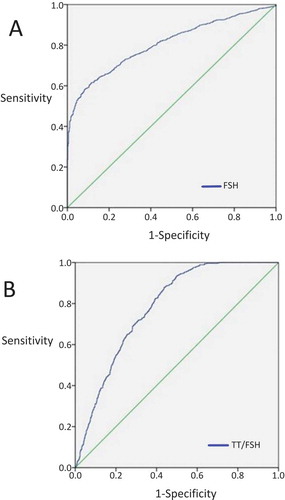
After selecting normal/abnormal sperm count as the state variable, ROC curves were created by using the data summarized in and . The sensitivity was 61.5% −87.9%, the specificity was 88.4–56.2%, respectively for the cutoff values as FSH was 7.085 IU/L and TT/FSH was 51.1, and AUC was 0.805–0.780 (p < 0.001) (). The discriminative power of the test for FSH was fulfilling and was enough for the TT/FSH ratio as well as these values were statistically significant.
Figure 2. ROC curves; the relationship between patients with normal/abnormal sperm count and FSH (A) and TT/FSH (B). State variable was normal/abnormal sperm count in the both curves. When FSH’s cutoff value was 7.085 IU/L, sensitivity 61.5% and specificity was 88.4% (A). When TT/FSH’s cutoff value was 51.1, sensitivity 87.9% and specificity was 56.2% (B).
Discussion
Infertility is defined as the failure to conceive despite one year of regular and unprotected intercourse. Male infertility associated factors are encountered in 50% of infertility cases. Idiopathic male infertility is found to be 30–40% of male infertility cases. Eighty percent of idiopathic infertility and 30–40% of known causes claimed to be related with oxidative stress. (Jungwirth et al. Citation2012; Agarwal et al. Citation2019).
Testosterone and FSH are required to stimulate Sertoli cells to produce maturation factors for germ cells as they differentiate to spermatozoa. FSH provides a spermatogenesis-related feedback mechanism between the testis and the HPGA (Nieschlag et al. Citation1999; Hayes et al. Citation2000).
In this clinical study, cases were divided into subgroups according to sperm counts. This division was first made only among those who had sperm in their ejaculate and then in all cases. There was a statistically significant relationship between abnormal sperm concentration and increased FSH and decreased TT/FSH ratio. This relationship was statistically more significant in groups in which azoospermic cases were included. The relationship with TT was not statistically significant in both groups.
The reason for this grouping of azoospermic cases is the number in our study was usually higher than expected in the population. Only 28.3% of the 1,893 cases were normozoospermic, 31.7% were azoospermic (except for pellet positive cases), whilst 10% to 15% of normal infertile male population has azoospermia. This high rate may be related to the clinic reference center in their region and to the reference of the selected patients. Also, the number of patients with normal sperm counts is less than the rate of hormonal evaluation. Considering that the probability of reflecting the population could be lower when all the cases were included, the data were evaluated in two steps: with azoospermia excluded (n = 12,92) and with included (n = 1,893).
As a result of the study, it was seen that semen parameters were abnormal when FSH values were higher than 4.8 IU/L which was estimated as the cutoff value for FSH (p < 0.05). When FSH level and sperm motility were evaluated, it was found that the percentage of total motile sperm was the most significant. It was also found that there was no significant relationship between the volume of semen and hormones (TT and FSH) (p > 0.05).
In a study of 349 men aged 20–35 years, Jensen et al. evaluated men with unknown fertility status in two different centers. Two separate median values of 3.42 and 3.21 IU/L were found for FSH. When FSH was >10 IU/L, the predictive power of oligospermia (<20 million/ml) was reported as 85.7% (Jensen et al. Citation1997).
Uhler et al. investigated the relationship between hormone profile, semen analysis and fertility in 145 men who were considered normal. Although the fertility of the men in the study was not proven, 82% of the couples achieved a pregnancy within 12 months. In the study, 17 of 22 oligozoospermic men had FSH value> 10 IU/L. According to the study focusing on male reproductive health in the general population, it was stated that a FSH value more than 10 IU/L would be considered abnormal and would suggest male factor infertility (Uhler et al. Citation2003). Meeker et al. reported that FSH level among 388 men from an infertility clinic was inversely related to sperm concentration, morphology and motility. When ranked according to the level of FSH, the probability of oligozoospermia was increased 5-fold and the probability of abnormal morphology increased 2-fold in the highest third group compared to the lowest third group. FSH levels above 10 IU/L predicted oligozoospermia with a sensitivity of 0.55 (Meeker et al. Citation2007). In a study of 1,479 infertile men from a single clinic, Morrow et al. showed that the mean sperm concentration in the range of FSH 6–9 IU/L was 22 million/ml and when FSH levels were >9 IU/L sperm concentration was below 1 million/ml. They concluded that there was an inverse relationship between sperm concentration and FSH level (Morrow et al. Citation1986). Schoor et al. retrospectively analyzed 153 azoospermic men with non-obstructive azoospermia. In 96% of men with obstructive azoospermia, the FSH value was found to be ≤7.6 IU/L, and 89% of men with non-obstructive azoospermia had FSH value> 7.6 IU/L. It was emphasized that men with FSH values > 7.6 IU/L may be non-obstructive azoospermic. However, the rate of patients with non-obstructive azoospermia was low and oligospermic patients were not evaluated (Schoor et al. Citation2002).
Although there are many similar studies in the literature, Gordetsky’s study might be the most similar with our study; regarding aim, preparation and results (Gordetsky et al. Citation2012). They aimed to redefine abnormal FSH value in the infertile male population. A total of 610 infertile men were evaluated in a single urology clinic and 457 of them were included in the study. An inverse ratio between FSH level and the measurements of sperm concentration and morphology was observed. Also, TT/FSH ratio was found to be directly proportional with the measurements of sperm concentration and morphology. When FSH values> 7.5 IU/L, the probability of an abnormality in semen parameters were found to be 5–13 times higher than in cases with FSH<2.8 IU/L. They concluded the risk of abnormality of semen analysis was significantly increased in patients with FSH level> 4.5 IU/L with a decreased TT/FSH ratio. Therefore, it has been argued that normal FSH level had to be re-estimated in infertile men.
Our study demonstrated the relationship between increased FSH values and abnormal sperm parameters, consistent with previous studies. Although many studies are investigating the relationship between semen parameters and hormone levels, this study is among the unique studies that are aiming to re-determine the abnormal level of FSH. In this study, FSH values above 4.8 IU/L were statistically associated with abnormal sperm concentration and motility. This suggests that the normal reference range of FSH should be narrower and the upper reference range should be lower than in the previous studies in the literature.
In this study, although there was no statistically significant relationship between semen parameters and testosterone level, a significant relationship between semen parameters and TT/FSH ratio was shown. Especially in cases with low testosterone levels accompanied by borderline high FSH levels (4.8 IU/L in our study), TT/FSH ratio may be more valuable than the patients with normal testosterone levels accompanied by borderline high FSH levels. In addition, semen parameters had a greater probability of being abnormal with decreasing TT/FSH ratios. This could be helpful in patients with a borderline high FSH level (≈4.5 IU/L) and a low testosterone level compared to someone with borderline a high FSH level and a normal testosterone level (Gordetsky et al. Citation2012). With the decrease in TT/FSH ratio, the probability of abnormal semen parameters increases. On one hand, If we accept the minimum TT value given in European Association of Urology (EAU) guidelines (12.1 nmol/L = 349 ng/dl), then, the minimum level of TT/FSH should be accepted as 72.7 (349/4.8) (18). On the other hand, if we accept the upper reference range of TT which mentioned in the instruction manual of our clinic’s hormone testing kit, then, the maximum level of TT/FSH should be 210.83 (1012/4.8). So, we can say that the range of TT/FSH ratio for this laboratory kit should be between 72.7–210.8 in 18–50 ages. More studies are needed to estimate the value of TT/FSH ratio in evaluating male infertility.
Since our study was designed retrospectively, the limitation of our study was that age ranges were not evaluated separately in terms of medical history and sexual function. Another missing point in this study is that it does not include a fertile control group which may be useful for comparing FSH and semen analysis. As another limitation, the patients were not evaluated regarding the other hormones (thyroid and adrenal hormones) which has the potential of affecting fertility. Also, including testicular volumes in this study and presenting their correlation with hormonal parameters might give an idea about whether there is a threshold at which testicular volume starts to decrease.
To sum up, FSH values above 4.8 IU/L were found to be abnormal when the male factor was investigated in infertility. We found a significant level for TT/FSH of 89.68. Several abnormalities in semen parameters might be detected below this level. However, more studies are needed to conclude. In the future, the TT/FSH ratio may become a more useful marker rather than a single hormone in predicting semen parameters in infertility.
It has been established that if there is an abnormal increase in FSH, it indicates an abnormality in spermatogenesis. However, the upper limits of FSH which were suggested by the manufacturers of modern hormone analyzers, are not compatible with the clinical status of infertile males. There have been several studies which investigated this issue and the researchers suggested new threshold levels of FSH for determining spermatogenetic abnormalities. In this study, this threshold was found as 4.8 4.8 IU/L. Further low TT/FSH levels might be marker for seminal abnormalities.
Materials and methods
In this study, data of 2802 infertile male patients who were admitted to our clinic within four years were included. The study was designed retrospectively in a single center. Demographic data of each case and pathological findings on physical examination were recorded in follow-up forms. Regular hormone tests for these patients were total testosterone (TT), FSH, luteinizing hormone (LH), estradiol (E2), sex hormone binding globulin (SHBG) and prolactin (PRL).
Exclusion criteria were hypogonadotropic hypogonadism (45 cases), unilateral or bilateral vasal agenesis (89 cases), obstructive azoospermia (63 cases), incomplete patient records (222 cases), palpable varicocele or varicocele cases which diagnosed with Doppler ultrasound (478 cases), chemo and/or radiotherapy due to a malignancy, chronic disease which may affect spermatogenesis or hormonal parameters (12 cases). Hypogonadotropic patients, oncologic cases and chronic diseases were excluded because of their potential of affecting spermatogenesis or hormonal parameters. Vasal agenesis and obstructive azoospermia cases were excluded because they might be confusing for the evaluation of semen analyzes (Diagnosis of all obstructive cases were corroborated by normal hormone levels accompany with low seminal volume, after performing a meticulous physical examination of ductus deferens). Also, varicocele cases would be confusing for both the evaluation of semen parameters and hormonal parameters. So, data of eligible 1893 cases were included in the study.
Semen analysis
Semen samples were given at least once after three to five days of sexual abstinence. The analyzes were performed manually. The samples were collected by masturbation into sample cups, if the patient’s sexual abstinence was appropriate. The samples were waited to be liquefied at 37°C in an incubator approximately for an hour. After this process the samples were analyzed regarding semen volume, semen pH, sperm concentration, normal/abnormal sperm count and sperm motility. The same laboratory assistant evaluated the analysis following World Health Organization (WHO) 2010 criteria (WHO Citation2010).
Hormone analysis
Many patients gave semen analysis and fasting blood samples at the same day. However, the patients without suitable sexual abstinence were only allowed to give fasting blood samples and their semen samples were collected within 30 days. Serum FSH levels were measured using ADVIA Centaur FSH assay (Siemens®, ADVIA Centaur and ADVIA Centaur XP Systems, Germany) (SiemensHealthcare Diagnostics I Citation2008). The reference range of FSH for this test had been determined as 1.4–18.1 IU/L. Serum testosterone level was measured using DIAsource TESTO-RIA-CT assay (DIAsource ImmunoAssays S.A.) (DIAsource ImmunoAssays SA Citation2011). The reference range of testosterone for this test had been determined as 267–1012 ng/dl. TT/FSH ratio was calculated dividing total testosterone (ng/dl) by FSH (IU/L).
Statistical analysis
Univariate analyzes were performed to identify the present study population consisting of 1893 cases. Then, two-variable analyzes were performed using the Mann-Whitney U Test to compare the ratio between patient groups with different FSH levels and TT/FSH ratios and, also, patient groups with abnormal semen parameters. Probability ratios and 95% confidence intervals were calculated by using logistic regression analysis in order to show the relationship between categorical hormone levels (quarters) and semen parameters. Hormone levels were categorized using the distribution quarters in the study population; besides, semen parameters were categorized based on the reference values published by WHO.
Using logistic regression analysis with continuous hormone level variables, ROC curves were created to reveal the ideal threshold hormone levels that can best predict the abnormality in semen parameters. FSH and TT/FSH thresholds were selected to maximize sensitivity and specificity to classify semen parameters accurately.
All statistical tests were performed with SPSS® 20.0 statistical program. p < 0.05 was considered significant.
Ethics approval
An ethics committee approval was obtained from the local ethics committee (2013/640). An informed consent was taken from each patient.
Author contributions
Provided the concept, designed the technique of the study: OE, MO; collected and analyzed the data: MO; wrote the manuscript: UO; drafted and revised the manuscript: OE, MC.
Disclosure statement
The authors declare that there is no conflict of interest.
References
- Agarwal A, Parekh N, Kumar M, Selvam P, Henkel R, Shah R, Homa ST, Ramasamy R, Ko E, Tremellen K, et al. 2019. Male Oxidative Stress Infertility (MOSI): proposed terminology and clinical practice guidelines for management of idiopathic male infertility. World J Mens Heal [Internet]. 37(3);296–312. [accessed 2020 Mar 30]. https://doi.org/10.5534/wjmh.190055.
- DIAsource ImmunoAssays SA. 2011. DIAsource TESTO-RIA-CT assay manual: testosterone. Paris: Rue du Bosquet.
- Gordetsky J, van Wijngaarden E, O’Brien J. 2012. Redefining abnormal follicle-stimulating hormone in the male infertility population. BJU Int [Internet]. 110(4):568–572. https://www.ncbi.nlm.nih.gov/pubmed/22177092.
- Hayes F, Dwyer A, Pitteloud N 2000. Hypogonadotropic Hypogonadism (HH) and Gonadotropin Therapy. [place unknown]. [accessed 2020 Jan 30]. http://www.ncbi.nlm.nih.gov/pubmed/25905304.
- Jarow J, Sigman M, Kolettis PN, eds. 2010. AUA –Clinical guidelines: the optimal evaluation of the infertile male: best practice statement. [place unknown]: American Urology Association.
- Jensen TK, Andersson AM, Hjollund NH, Scheike T, Kolstad H, Giwercman A, Henriksen TB, Ernst E, Bonde JP, Olsen J, et al. 1997. Inhibin B as a serum marker of spermatogenesis: correlation to differences in sperm concentration and follicle-stimulating hormone levels. A study of 349 Danish men. J Clin Endocrinol Metab [Internet]. 82:4059–4063. https://www.ncbi.nlm.nih.gov/pubmed/9398713.
- Jungwirth A, Giwercman A, Tournaye H, Diemer T, Kopa Z, Dohle G, Krausz C. 2012. European association of urology guidelines on male infertility: the 2012 update. Eur Urol [Internet]. 62:324–332. http://uroweb.org/wp-content/uploads/Guidelines_WebVersion_Complete-1.pdf.
- Meeker JD, Godfrey-Bailey L, Hauser R. 2007. Relationships between serum hormone levels and semen quality among men from an infertility clinic. J Androl [Internet]. 28:397–406. https://www.ncbi.nlm.nih.gov/pubmed/17135633.
- Morrow AF, Baker HW, Burger HG. 1986. Different testosterone and LH relationships in infertile men. J Androl [Internet]. 7:310–315. https://www.ncbi.nlm.nih.gov/pubmed/3095293.
- Tüttelmann F, Nieschlag E. 2010. Classification of Andrological Disorders. In: Nieschlag E, Behre HM, Nieschlag S, editors. Andrology: Male Reproductive Health and Dysfunction [Internet]. 3rd ed. Berlin, Heidelberg: Springer Berlin Heidelberg; p. 87–92. http://link.springer.com/10.1007/978-3-540-78355-8_4.
- Nieschlag E, Simoni M, Gromoll J, Weinbauer GF. 1999. Role of FSH in the regulation of spermatogenesis: clinical aspects. Clin Endocrinol [Internet]. 51:139–146. https://www.ncbi.nlm.nih.gov/pubmed/10468980.
- Ozkaya M, Demirtas A, Ekmekcioglu O. 2013. Endocrinological evaluation in male infertility. In: Asci R, Cayan S, Erdemir F, editors. Male Reprod Syst Dis Treat [Internet]. İstanbul: İstanbul Tıp Kitabevi; p. 227–239. https://docplayer.biz.tr/39889839-Erkek-ureme-sistemi-hastaliklari-ve-tedavisi.html.
- Schoor RA, Elhanbly S, Niederberger CS, Ross LS. 2002. The role of testicular biopsy in the modern management of male infertility. J Urol [Internet]. 167:197–200. https://www.ncbi.nlm.nih.gov/pubmed/11743304.
- SiemensHealthcare Diagnostics I. 2008. ADVIA centaur assay manual. NY, Tarrytown: FSH.
- Sina D, Schuhmann R, Abraham R, Taubert HD, Dericks-Tan JS. 1975. Increased serum FSH levels correlated with low and high sperm counts in male infertile patients. Andrologia [Internet]. 7:31–37. https://www.ncbi.nlm.nih.gov/pubmed/1163822.
- Tsutsui K, Bentley GE, Bedecarrats G, Osugi T, Ubuka T, Kriegsfeld LJ. 2010. Gonadotropin-inhibitory hormone (GnIH) and its control of central and peripheral reproductive function. Front Neuroendocrinol. 31(3):284–295. doi:10.1016/j.yfrne.2010.03.001.
- Uhler ML, Zinaman MJ, Brown CC, Clegg ED. 2003. Relationship between sperm characteristics and hormonal parameters in normal couples. Fertil Steril [Internet]. 79(Suppl 3):1535–1542. https://www.ncbi.nlm.nih.gov/pubmed/12801556.
- WHO. 2010. Laboratory manual for the examination and processing of human semen. 5th ed. Geneva: WHO Press.