
ABSTRACT
Ovarian cancer is the leading cause of death from gynecologic malignancies. Cancer stem cells (CSC) seem to play a crucial role in tumor metastasis, recurrence, and chemoresistance. Therefore, CSCs offer significant potential for developing therapeutic targets and to understand tumor recurrence and chemoresistance mechanisms. In the present study, our aim was the identification of the gene group in ovarian CSCs (O-CSCs) and the potential of the resultant gene group in ovarian cancer prognosis. Two different microarray data sets were analyzed by comparing gene expression levels between O-CSCs and cancer samples. The O-CSC co-expression network was reconstructed and its modules were identified. According to the analysis results, 74 mutual DEGs were identified. The O-CSC-specific co-expression network included 32 nodes and 95 edges (network density: 19%), while the co-expression network in cancer samples was reconstructed with 74 nodes and 1066 edges (network density: 39%). Understanding of the molecular mechanism and signatures of O-CSCs should provide valuable insight into chemotherapy resistance and recurrence of ovarian tumors. A highly connected 12 gene module in O-CSC samples of BAMB1, NFKB12, EZR, TNFAIP3, C1orf86, PMAIP1, GEM, KHDRBS3, FILIP1, FGFR2, TGFBR3 and PEG10, (network density: 67%) was identified. Prognostic performance of these genes was evaluated independently using six ovarian cancer datasets (n = 1933 patient samples) via survival analysis. These co-expressed genes were determined as prognostic targets in ovarian cancer. Through literature search validation, five genes (C1orf86, PMAIP1, FILIP1, NFKB12 and PEG10) suggested as novel molecular targets in ovarian cancer. The presented prognostic biomarkers here provide a resource for the understanding of tumor recurrence and chemoresistance and may facilitate critical research directions and development of new prognostic and therapeutic strategies for ovarian cancer.
Abbreviations
CSCs: cancer stem cells; O-CSCs: ovarian CSCs; FACS: fluorescence-activated cell sorting; SP: side population; MP: main population; TFs: transcription factors.
Introduction
Ovarian cancer is the leading cause of death from a gynecologic tumor, and diagnosis and treatment of this disease is more difficult than other types of female reproductive malignancies (Siegel et al. Citation2016). Ovarian cancer five-year survival rate is below 45% and the number of cases are increasing (Ferlay et al. 2014; Siegel et al. Citation2016). Early diagnosis offers higher survival rates and can prevent 10% of deaths (Hippisley-Cox and Coupland Citation2012). Additionally, understanding the main mechanisms of tumorogenesis may have valuable clinical significance.
Cancer stem cells (CSCs), are variable and present in low quantities , have been reported in many cancer types and are suggested to drive tumor initiation, progression, and relapse (Clevers Citation2011). The CSC theory states that tumor growth is similarly fueled by small numbers of tumor stem cells hidden in cancers (Batlle and Clevers Citation2017) and CSCs seem to play a major role in tumor metastasis, recurrence and drug resistance. Despite their potential clinical importance, the regulation of CSCs at the molecular level is not well-understood. A great number of studies have been reported that the role of subpopulations of CSCs are involved in chemoradiation therapy resistance and tumor metastasis. Cell-surface markers of CSCs have been used including CD15, CD24, CD34, CD44, CD117, CD133, CD139, CD166, ESA, and EpCAM for immunolabeling and cell sorting in fluorescence-activated cell sorting (FACS) analysis to isolate CSCs from the solid tumors (Osaki et al. Citation2015). Ovarian cancer stem cells (O-CSCs) ‘side population’ (SP) that have the capacity of self-renewal and differentiation in comparison with the main population (MP) can be isolated via a DNA binding dye (Szotek et al. Citation2006). Another research group has isolated SP cells from the ovarian cancer cell line (OVCAR-3) (Gao et al. Citation2009). In another study, ALDH1A1 positive cell populations from the ovarian cancer cell line (A2780) were isolated as a CSC which represents partial resistance to platinum, a chemotherapy agent (Zeimet et al. Citation2012). Nevertheless, there are no universal biomarkers for isolation of O-CSCs and they may contain various cell fractions and stem-like markers. These CSCs may be escaping chemotherapy (Hu et al. Citation2010). Therefore the understanding of the molecular mechanism of O-CSCs should provide valuable insight into chemotherapy resistance and recurrence of ovarian tumors. High-throughput technologies that offer functional genomic datasets provide the opportunity for a holistic perspective on ovarian cancer research through integrative bioinformatics analyses (Gov et al. Citation2017b). In recent years, a few studies have utilized biological network concepts to present context-specific network models in human ovarian cancer and some of the studies are achieved by our research group. Differential co-expression networks that form a biological network and their topological analyses provide crucial information about gene expression based biological alterations by comparison of two different context specific states such as diseased tissues and healthy tissues (Ideker and Krogan Citation2012; Hsu et al. Citation2015). Gov and Arga reconstructed an ovarian cancer-specific transcriptional regulatory network using gene expression datasets (Gov and Arga Citation2016). In another study, a novel methodology was developed to construct a differential co-expression network, and prognostic gene sets identifying their transcriptional regulatory elements (Gov and Arga Citation2017). Ayyildiz and coworkers (Citation2017) used ovarian cancer-related gene expression data and an entropy formulation to define uncertainty to identify the cellular alterations at the protein interactome level. In the network based on the other study, epithelial, stroma and tumor-specific potential biological signatures and therapeutic targets were identified by integrating ovarian cancer gene expression profiles with biomolecular networks (Gov et al. 2017). When O-CSC related systems medicine studies were investigated, limited research is available. For example, Zhou et al. investigated the prognostic value of CD133 that is CSC marker in ovarian cancer. A high level of CD133 expression was correlated with a worse prognosis in patients with ovarian cancer according to meta-analysis (Zhou et al. Citation2015). Jung and coworkers reported that silencing PBX1 in platinum-resistant cells that have stem-like properties rendered sensitive to platinum treatment exhibit reduced stem-like behavior (Jung et al. Citation2016). CA125-negative enriched cells obtained from high-grade serous ovarian cancer samples were identified as carboplatin-resistant cancer-initiating cells. This suggested that therapeutic target CA125-negative cells may be useful in the treatment of ovarian cancer (Janzen et al. Citation2015). In another study, by integrating the gene expression and TF-target interaction they proposed that the activated transcription factors (TFs) in O-CSCs identify signaling pathways regulating the activated TFs (Zhang et al. Citation2018).
Understanding the molecular mechanisms behind the cancer stem cell hypothesis is a great challenge, and requires integration of biological information from different levels; thereby high-throughput functional genomics data and a network-based approach is needed. Despite several experimental efforts, findings have been unable to test the central biological mechanisms of the CSC hypothesis and map the interconnectivity of O-CSCs and ovarian cancer. The present study, was aimed to identify O-CSC related biological signatures through an expression based correlation approach and investigate prognostic potentials of these signatures in ovarian cancer. Therefore, transcriptomic datasets were analyzed and interpreted from an integrated and comparative perspective. Through advanced statistical analyses of the reported transcriptome datasets, differentially expressed genes (DEGs) were identified. Co-expression networks were reconstructed in O-CSC and cancer samples by using mutual DEGs. Gene modules related O-CSCs were identified and prognostic performance of these genes was evaluated in independent ovarian cancer datasets via survival analysis. The benefits of integrative multi-omics approaches of O-CSCs are also provided to diagnosis, treatment, and when possible prevention of ovarian cancer in the future.
Results
Differential gene expression profiles of ovarian cancer stem cells
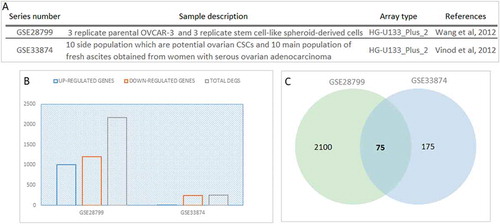
Transcriptome datasets from two independent studies associated with ovarian carcinoma stem cell-like samples were analyzed. In the first dataset, gene expression levels between stem cell-like spheroid-derived cells and OVCAR-3 cell lines were compared. In the second dataset gene expression levels between SP having CSC like behavior and the MP with high-grade advanced-stage papillary serous ovarian adenocarcinoma ()) were compared. For identification of differentially expressed genes (DEGs) in each dataset, statistical analyses were performed. Statistically significant (p-value < 0.05 and fold-change >2.0 or <0.5) alterations in 0.83% and 7.25% of the genome between O-CSCs and cancer samples are summarized in ). A total of 2174 genes, 1203 down- and 1001 up-regulated genes in GSE28799 and a total of 249 genes, 243 down- and 6 up-regulated genes in GSE33874 were identified as DEGs for cell line based O-CSC and SP cancer samples, respectively. Between the two datasets, 74 mutual DEGs were identified (); (Supplemental Table 1). Functional enrichment analysis of proteins encoded by the mutual DEGs indicated that enriched pathways were mainly related to signaling such as signal transduction, MAPK signaling pathway, proteoglycans in cancer (data not shown).
Figure 1. Differentially expressed genes (DEGs) in ovarian cancer stem cells. (A) Datasets descriptions used in the present study (B) The distribution of total differentially expressed genes (DEGs), down-regulated and up-regulated DEGs in each dataset (p-value <0.05). For each dataset, DEGs which had statistically significant alterations in their expression profiles among ovarian cancer stem cells and cancer samples were identified independently. (C) Venn diagram represents the comparison of DEGs across the two datasets. The gene symbols representing the 74 mutual DEGs were given below the diagram.
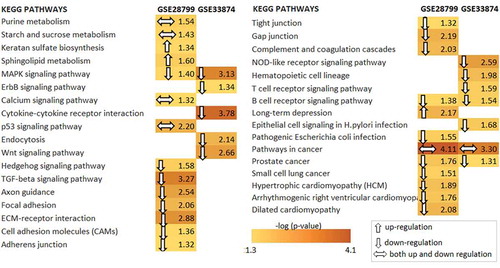
Main biological pathways for the ovarian cancer stem cells
DEGs enrichment analyses indicated significant results for four pathways in both datasets: MAPK signaling, B cell signaling, pathway in cancer and prostate cancer pathway (). With the exception of ketaran sulfate, sphingolipid metabolism, and long-term depression pathway, the majority of pathways were down-regulated (76%) while a small portion were both up and down-regulated (14.7%) in O-CSCs. It was suggested that most of the pathways were down-regulated in O-CSCs samples. Enriched pathways might be classified as metabolism-related such as purine, starch, and sucrose metabolism pathways, where as signaling related pathways such as MAPK, ErbB, p53, Wnt, Hedgehog, TGF-beta, T-cell receptor, B- cell receptor were identified. The remaining enriched pathways were associated with adhesion and cardiomyopathy. It was concluded that the DEGs of O-CSCs were enriched in cancer signaling, cellular organization, and metabolism associated pathways.
Figure 2. Statistically significant main biological pathways in ovarian cancer stem cells. Resultant differentially expressed genes of both datasets according to enrichment analysis results (p value <0.05) were identified via the Database for Annotation, Visualization and Integrated Discovery (DAVID) functional annotation tool based on the information on gene-reaction-pathway associations from Kyoto Encyclopedia of Genes and Genomes (KEGG) database for Homo sapiens. Down and up-regulated gene list was used to obtain down and up-regulated pathways. Regulation pattern of pathways represented by arrow directions.
Co-expression network of ovarian cancer stem cells
To reconstruct the co-expression network of O-CSCs, Pearson correlation coefficients (PCC) of mean expression values of 74 mutual DEGs were calculated in O-CSC and control samples, separately. To determine the statistical significance of the pairwise gene correlations, the PCCs obtained were normally distributed and cutoffs of >0.81 (positive correlation) and <−0.81 (negative correlation), which correspond to p-value < 0.05, were employed. The O-CSC specific co-expression network that was reconstructed included 32 nodes and 95 edges (network density: 19%), while the co-expression network in control samples was reconstructed with 74 nodes and 1066 edges (network density: 39%) by using significant pairwise gene correlations. The number of genes exhibiting co-expression patterns was almost two-fold higher in the control state compared to the O-CSC state. In other words, while co-expressed genes in cancer samples were more connected than in O-CSCs samples, co-expression patterns of the genes in O-CSCs samples were decreased.
Co-expressed module in ovarian cancer stem cells
Network modules of both co-expression networks were identified. Modules with at least 5 nodes (genes) and network density ≥0.50 were considered for further analyses. Topological parameters (i.e., the number of nodes and the network density) of the modules in O-CSC samples were considered selecting a module that represented 12 nodes and 44 edges. BAMB1, NFKB12, EZR, TNFAIP3, C1orf86, PMAIP1, GEM, KHDRBS3, FILIP1, FGFR2, TGFBR3, and PEG10, were determined as highly connected with each other in O-CSC samples (network density: 67%) (). Microarray analysis results of module-related genes in tabulated in . The gene with the most and least interactions are EZR (11 edges) and FILIP1 (4 edges) in the module, respectively. Interestingly, FGFR2, EZR, and FILIP1 have positive correlations amongst themselves, while they have negative correlations with most of the other genes.
Table 1. Gene expression analysis results of module-related genes.
Figure 3. Co-expressed module in ovarian cancer stem cells. To identify network modules of the ovarian cancer stem cell specific co-expression network, the MCODE plugin of the Cytoscape was used. Topological parameters, modules with at least 5 nodes (genes) and network density ≥0.5 were considered to determine the co-expressed network module. Significantly correlated mutual differentially expressed genes (DEGs) were represented as nodes and statistically significant correlations between the DEGs were represented as edges. Black and red color edges represent positive and negative correlations, respectively.
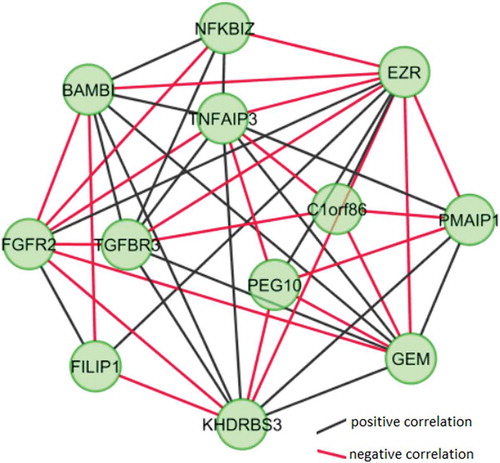
We performed enrichment analysis on the O-CSC specific module-related genes from KEGG and Reactome pathway databases. A single statistically significant enrichment result (p value <0.05) was obtained, regulation of the actin cytoskeleton pathway (EZR and FGFR2). Therefore, to determine the biological pathway annotations of the module-related genes, we manually searched Gene Cards Human Gene Database (). Six genes (50%) are membrane proteins, receptor or signal transduction related functions such as BAMBI (transmembrane glycoprotein), EZR (cytoplasmic peripheral membrane protein), FGFR2 (fibroblast growth factor, receptor), GEM (regulatory protein in receptor-mediated signal transduction), KHDRBS3 (signal transduction associated 3) and TGFBR3 (membrane glycoprotein, receptor). Three of the remaining genes have a role in apoptosis-related functions such as NFKBIZ (promote apoptosis), PEG10 (inhibit apoptosis in hepatocellular carcinoma) and PMAIP10 (promote activation of caspases and apoptosis). Moreover, FILIP1 and TNFAIP3 have tumor formation associated functions.
Table 2. The biological meaning and descriptions of module-related genes proposed in the present study.
Prognostic performance of module-related genes in ovarian cancer
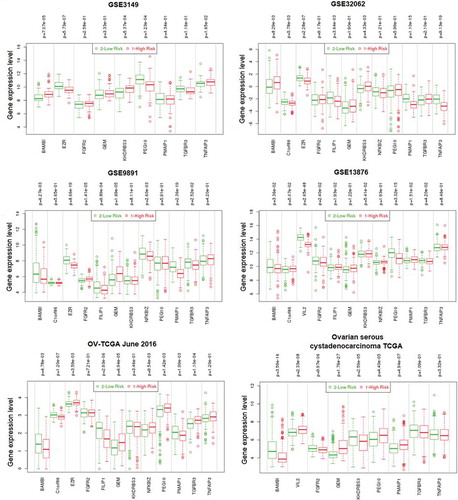
Cox survival analysis was performed to determine the prognostic performance of the module-related genes using six independent ovarian cancer datasets. In these analyses, comprehensive microarray and RNA-Seq datasets (n = 1933) were employed and samples were partitioned into low and high-risk groups according to their prognostic index. Kaplan-Meier plots and the log-rank test were used (). According to the analysis, statistically significant results could be obtained for all datasets. Furthermore, gene expression profiles in low and high- risk groups were represented via box-plot (). It was found that two co-expressed genes (BAMBI and EZR (VIL2)) have significantly different expression compared to high and low-risk assessments in all datasets. With one exception (GSE3149) PMAIP1 is also significantly differentially expressed when the high and low-risk assessments in 5 datasets are compared.
Figure 4. Prognostic performance of the module-related genes. Cox survival analysis was performed to determine the prognostic performance of the module-related genes using an independent six ovarian microarray and RNA-Seq datasets (n = 1933). Tumor samples were partitioned into low and high-risk groups according to their prognostic index. Kaplan-Meier Plot of co-expressed 12 genes was drawn for each ovarian cancer datasets. The p values are computed via the long-rank test (p < 0.05).
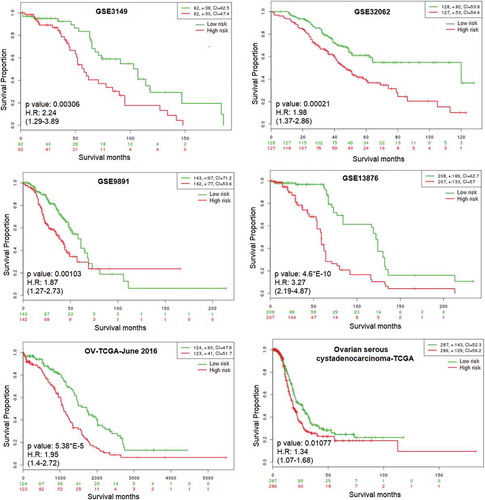
Figure 5. Comparison of the gene expression level of prognostic targets independent datasets. Box- plots show the overall range and distribution of the gene expression level of prognostic molecular targets in high and low-risk groups of each dataset. It was used independent six ovarian cancer microarray and RNA-Seq datasets (n = 1933). The p values were computed the mean difference of module-related gene expression between low and high- risk group samples via the t-test (p < 0.05).
Discussion
One of the major bottlenecks in ovarian cancer treatment is to overcome tumor relapse and chemotherapy resistance. It is largely accepted CSC, a small subset of tumor population, maintain tumor initiation, progression, and relapse (Zhan et al. Citation2013).
Co-expression analysis via comparative and integrative analysis by using gene expression between different conditions (i.e: O-CSCs and ovarian cancer tissues) can identify correlated molecular targets that could reflect disease pathogenesis. . In this study, two different microarray datasets were analyzed by comparing gene expression levels between O- CSCs and cancer samples. Expression values of mutual DEGs from both datasets were obtained and PCC calculated for each gene pair. O-CSC specific co-expression network was reconstructed and its modules were identified. It was presented that the novel co-expressed gene module of O-CSCs might be considered as molecular signatures and therapeutic targets offereing potential therapeutic opportunities and prognostic strategies for ovarian cancer.
Statistical data analysis and dataset selection are crucial in terms of identifying similar sample properties. Therefore stem-like ovarian cancer cells were selected. In a dataset, stem cell-like spheroid-derived cells were obtained from the OVCAR-3 cell line and OVCAR-3 parental cell lines as controls. The other datasets consisted of SP and MP isolated from fresh ascites obtained from patients with high-grade advanced-stage papillary serous ovarian adenocarcinoma. It was identified that SP cells have CSC like behavior (Vathipadiekal et al. Citation2012). Despite inconsistent alterations of the genome statistical analysis of the gene expression data revealed that, mutual DEGs mostly take a role in signaling events. The reason for the low number of common DEGs may reflect individual differences, tissue heterogeneity and differences between cancer cell lines and tumor tissues. Moreover, O-CSC isolated from epithelial carcinoma and malignant ascites in the selected datasets are consistent with the low number of DEGs. Malignant ascites consist of a complex mixture of soluble factors and cellular components that ensure an inflammatory and tumor-promoting microenvironment for the tumor cells (Ahmed and Stenvers Citation2013).
The number of genes exhibiting a correlated cancer cell pattern was almost two-fold higher in O-CSCs state. It was suggested that communication among DEGs decreases in O-CSCs samples. This situation has been found in many of our other studies (Gov and Arga Citation2017; Kori et al. Citation2019). To identify a prognostic gene module that may represent molecular signatures in ovarian cancer pathogenesis, we focused on the modules in O-CSC samples. In addition, we expected that the putative prognostic module would include multiple interactive genes compared to control samples in order to maintain high precision in their predictive capability. Module-related genes refer to groups of genes acting together or give information about level of the expression. Hence it would not be surprising if these genes were known pluripotency or CSC markers.Therefore topological parameters (i.e., the number of nodes and the network density) of the modules were considered, to select a highly connected gene group in O-CSC state. The highly connected gene group module, BAMB1, NFKB12, EZR, TNFAIP3, C1orf86, PMAIP1, GEM, KHDRBS3, FILIP1, FGFR2, TGFBR3 and PEG10, was identified. According to survival analysis results, the 12 correlated genes represent high potential as prognostic molecular targets in ovarian cancer. It may be suggested that the co-expression pattern among the resultant genes was activated in response to the high-risk group patients with ovarian cancer (i.e.: worse condition), and this set of genes may be considered as ‘prognostic biomarkers’ to predict the development of ovarian cancer. In comparison the TCGA datasets are comprised from 57 patient samples () that have a larger p- value compared to other datasets.
Prognostic co-expressed module-related genes were subject to literature datamining in terms of association with ovarian cancer (). BAMBI has a pseudoreceptor antagonizing transforming growth factor (TGF-ß) receptor activation. Pils and coworkers (Citation2010) showed that the overexpression of the BAMBI gene in vitro model using the ovarian cancer cell line, SKOV3, affects the increase in migration, proliferation, and resistance to TGF-ß-mediated apoptosis. Moreover, the significantly higher overexpression of this gene has been shown in ovarian tumor tissues. It was reported that BAMBI is a novel modulator of TGF-ß signaling. In another study, it was determined that increasing of BAMBI expression levels in ovarian cancer cell line, NCI-RES, when the cells were treated with a combination of DMH1 and cisplatin. However, BAMBI expression decreased in another ovarian cancer cell line, OVCAR8, when it was treated with only cisplatin (Hover et al. Citation2015). Marchini et al. (Citation2013) reported that a resistance signature occurred in the activation of epithelial to mesenchymal transition (EMT) which also includes BAMBI, by TGF-ß pathway in epithelial ovarian cancer (EOC). The other module-related gene C1orf8 has limited information with regard to its association with ovarian cancer. In one study, this gene was found among the overlapping genes that take place in BRCA1-unique copy number variations regions in ovarian cancer patients (Yoshihara et al. Citation2011).
Table 3. Prognostic biomarkers and relevance with ovarian cancer.
Overexpression and activation of ezrin were reported being related to ovarian cancer metastatic behavior (Chen et al. Citation2001). Estrogen induced the overexpression of EZR in EOC (Song et al. Citation2005). The EZR protein could also be used as an autoantibody marker in various stages of ovarian cancer with low and normal CA-125 levels (Karabudak et al. Citation2013). FGFR2 has also been reported in several cancer-related studies. Reductions in FGFR2 expression were shown by using FGFR-specific shRNAi to enhance cisplatin sensitivity increasing G2/M arrest with a resultant increase in apoptosis (Cole et al. Citation2010). Moreover, FGFR2 mutations were determined at low frequency in certain histological subtypes of ovarian cancer such as serous and endometrioid ovarian cancer (Byron et al. Citation2010). In a recent study, ovarian cancer cells were treated with an FGFR inhibitor, or mTOR inhibitor, or their combination. Cell cycle arrest, apoptosis, with stronger inhibitory effects on the growth and motility of ovarian cancer cells were observed via the combined treatment (Cai et al. Citation2019).
It was reported that overexpression of SOX2 which regulates stem and pluripotency in embryonic stem cells, has been shown to reduce pro-apoptotic protein NOXA/PMAIP1 expression in ovarian cancer (Bareiss et al. Citation2013). It has been shown in various types of cancer that down-regulation of PMAIP1 known to induce apoptosis, results in the proliferation of tumor cells (Zhao et al. Citation2014; Cui et al. Citation2015). Bioinformatics identified FILIP1 as significantly related to ovarian cancer, involved in multidrug resistance (Zou et al. Citation2015). Interestingly, tumor suppressor or tumor-promoting effect of GEM and NFKBIZ genes in ovarian cancer, like PEG10, which is expressed as an oncogene in various cancer studies (Liu et al. Citation2011, Citation2014), have not be found in association with ovarian cancer. In comparison the downregulation of KHDRBS3,a prognostic target, could be modulated to significantly reduced cell proliferation in ovarian cancer cell line, CAOV-3, (Ma et al. Citation2017). In comparison, downregulation of TGFBR3 reduces cell migration and invasion in ovarian cancer (Hempel et al. Citation2007; Mythreye and Blobe Citation2009; Bilandzic et al. Citation2009). In only one study, were carboplatin-induced gene expression changes in EOC investigated as time series. It was found that TNFAIP3 was upregulated cisplatin-treated ovarian cancer cell line compared to control (Konstantinopoulos et al. Citation2008). This suggested that resultant prognostic genes can activate or suppress chemotherapy resistance and apoptosis in ovarian cancer studies which this situation suitable for CSC behavior. However, each gene should be investigated with low-throughput experimental studies to determine the prognostic and therapeutic potential for ovarian cancer The tissue- specific co-expression network represents significant potential to identify gene modules affected by state transition (i.e., CSC and tumor tissues).
This study has identifed candicate prognostic biomarkers in ovarian cancer by using O-CSC gene expression data through co-expression network reconstruction. It presented a module of novel highly connected genes, BAMB1, NFKB12, EZR, TNFAIP3, C1orf86, PMAIP1, GEM, KHDRBS3, FILIP1, FGFR2, TGFBR3, and PEG10 that might be considered as systems putative biomarkers and drug targets that could enhance therapeutic strategies. They also might be used as early prognostic indicators in ovarian cancer progression. Based on our observations and the literature, we propose that C1orf86, PMAIP1, FILIP1, NFKB12 and PEG10 are as novel prognostic targets in ovarian cancer. Together they may act in concert to seed of tumorigenesis including chemoresistance, cell cycle arrest, and apoptosis. Future experimental and clinical studies of this module might provide novel insights to design the early prognostic indicators and improve treatment strategies.
Materials and methods
Gene expression datasets of ovarian cancer stem cells
The raw data of high throughput transcriptome datasets associated with O-CSCs from a total of 2 studies (GSE28799 (Wang et al. Citation2012) and GSE33874 (Vathipadiekal et al. Citation2012) have been obtained from Gene Expression Omnibus (GEO) (Barrett et al. Citation2013) and analyzed to identify gene expression profiles of O-CSC. The samples in the GSE28799 dataset were taken from stem cell-like spheroid-derived cells and OVCAR-3 parental cell lines as controls. The other dataset consists of SP and MP isolated from fresh ascites obtained from patients with high-grade advanced-stage papillary serous ovarian adenocarcinoma. It was identified that SP cells have CSC like behave (Vathipadiekal et al. Citation2012). A total of 26 samples were explored, including 13 O-CSCs and 13 cancer samples including cancerous tissues and ovarian cancer cell lines.
The independent datasets, GSE9891 (Tothill et al. Citation2008), GSE32062 (Yoshihara et al. Citation2012), GSE13876 (Crijns et al. Citation2009), GSE3149 (Bild et al. Citation2006) and two datasets ovarian serous cystadenocarcinoma obtained from The Cancer Genome Atlas (TGCA), were used in survival analyses. These datasets include clinical information about 1933 patients.
Identification of differentially expressed genes and enrichment analyses
To identify differentially expressed genes (DEGs), an affy package of R/Bioconductor platform (version 3.6) (Gentleman et al. Citation2004) was used. Each dataset was normalized via Robust Multi Array (RMA) techniques (Bolstad et al. Citation2003) and linear models for microarray data (LIMMA) method (Smyth et al. Citation2005) was used in the statistical analysis of both dataset by compared with O-CSC vs control samples. To identify statistically significant DEGs, p-value threshold (<0.05) was used and fold changes (>2.0 and <0.5) were taken into consideration to determine up or down-regulated DEGs.
Enrichment analyses were carried out through the DAVID bioinformatics tool (Huang et al. Citation2009) to find out statistically significant biological pathways associated with resultant DEGs. Kyoto Encyclopedia of Genes and Genomes (KEGG) (Kanehisa et al. Citation2014) were employed as annotation sources and enrichment results with p-value <0.05 were considered as statistically significant.
Co-expression network reconstruction in ovarian cancer stem cells
Expression profiles of mutual DEGs of both datasets were separated as O-CSC and cancer samples, and two new data lists (consisting of 13 CSCs and 13 control samples) were formed. The co-expression network analysis methodology (Gov and Arga Citation2017) was applied to the transcriptome datasets to identify differential co-expressed networks in O-CSCs and control samples. The mean level of expression of each individual DEGs was calculated and Z score normalization applied. Thereafter, Pearson correlation coefficients (PCC) of mean expression values of mutual DEGs were calculated in both type tissues, separately. The obtained PCCs were approximately normally distributed in both cases. A PCC cutoff was determined (p-value < 0.05) and the statistically significant pairwise correlations of mutual DEGs were identified. It was established co-expression networks in O-CSCs and control samples.
Identification of modules of ovarian cancer stem cells
To identify network modules of the O-CSC specific co-expression network, the MCODE plugin (Saito et al. Citation2012) of the Cytoscape (Cline et al. Citation2007) was used. Modules with significantly altered topological metrics (i.e., network density) and the number of nodes were considered to determine the significantly altered modules. Therefore, modules with at least 5 nodes (genes) and network density ≥0.50 were considered for further analyses.
Prognostic performance analysis
The prognostic performance of module-related genes was evaluated using an independent six ovarian cancer datasets from GEO and TCGA (GSE9891, GSE32062, GSE13876, GSE3149, OV-TCGA June Jung et al. Citation2016 and ovarian serous cystadenocarcinoma – TCGA). Survival times of a total of 1933 patients were used in these analyses. Cox proportional hazards regression analysis was performed via the SurvExpress validation tool (Aguirre-Gamboa et al. Citation2013). In SurvExpress, the ovarian cancer samples were grouped into low- and high-risk groups according to their prognostic index calculated by using patient survival times. The prognostic capabilities of the module-related genes were identified via Kaplan-Meier plots and the log-rank test. Furthermore, box-plot representation was used to the gene expression pattern of each module-related genes according to low- and high-risk groups and the p-value was obtained from the student t-test.
Author contribution
Analyzed the data, evaluated the results, and wrote the paper: EG.
Supplemental Material
Download Zip (14.3 KB)Disclosure statement
The authors declare no conflicts of interest.
Supplementary material
Supplemental data for this article can be accessed here.
References
- Aguirre-Gamboa R, Gomez-Rueda H, Martı´nez-Ledesma E. 2013. SurvExpress: an online biomarker validation tool and database for cancer gene expression data using survival analysis. PLoS One. 8:e74250. doi:10.1371/journal.pone.0074250.
- Ahmed N, Stenvers K. 2013. Getting to know ovarian cancer ascites: opportunities for targeted therapy-based translational research. Front Oncol. 3:256. doi:10.3389/fonc.2013.00256.
- Ayyildiz D, Gov E, Sinha R, Arga KY. 2017. Ovarian cancer differential interactome and network entropy analysis reveal new candidate biomarkers. OMICS. 21(5):285–294. doi:10.1089/omi.2017.0010.
- Bareiss PM, Paczulla A, Wang H, Schairer R, Wiehr S, Kohlhofer U, Rothfuss OC, Fischer A, Perner S, Staebler A, et al. 2013. SOX2 expression associates with stem cell state in human ovarian carcinoma. Cancer Res. 73(17):5544–5555. doi:10.1158/0008-5472.CAN-12-4177.
- Barrett T, Wilhite SE, Ledoux P, Evangelista C, Kim IF, Tomashevsky M, Marshall KA, Phillippy KH, Sherman PM, Holko M, et al. 2013. NCBI GEO: archive for functional genomics data sets—update. Nucleic Acids Res. 41:D991–D995. doi:10.1093/nar/gks1193.
- Batlle E, Clevers H. 2017. Cancer stem cells revisited. Nat Med. 23:1124. doi:10.1038/nm.4409.
- Bilandzic M, Chu S, Farnworth PG, Harrison C, Nicholls P, Wang Y, Escalona RM, Fuller PJ, Findlay JK, Stenvers KL. 2009. Loss of betaglycan contributes to the malignant properties of human granulosa tumor cells. Mol Endocrinol. 23(4):539–548. doi:10.1210/me.2008-0300.
- Bild AH, Yao G, Chang JT, Wang Q, Potti A, Chasse D, Joshi M-B, Harpole D, Lancaster JM, Berchuck A, et al. 2006. Oncogenic pathway signatures in human cancers as a guide to targeted therapies. Nature. 439(7074):353. doi:10.1038/nature04296.
- Bolstad BM, Irizarry RA, Åstrand M, Speed TP. 2003. A comparison of normalization methods for high density oligonucleotide array data based on variance and bias. Bioinformatics. 19:185–193. doi:10.1093/bioinformatics/19.2.185.
- Byron SA, Gartside MG, Wellens CL, Goodfellow PJ, Birrer MJ, Campbell IG, Pollock PM. 2010. FGFR2 mutations are rare across histologic subtypes of ovarian cancer. Gynecol Oncol. 117(1):125–129. doi:10.1016/j.ygyno.2009.12.002.
- Cai W, Song B, Ai H. 2019. Combined inhibition of FGFR and mTOR pathways is effective in suppressing ovarian cancer. Am J Transl Res. 11(3):1616.
- Chen Z, Fadiel A, Feng Y, Ohtani K, Rutherford T, Naftolin F. 2001. Ovarian epithelial carcinoma tyrosine phosphorylation, cell proliferation, and ezrin translocation are stimulated by interleukin 1α and epidermal growth factor. Cancer. 92(12):3068–3075. doi:10.1002/1097-0142(20011215)92:12<3068::AID-CNCR10149>3.0.CO;2-5.
- Clevers H. 2011. The cancer stem cell: premises, promises and challenges. Nat Med. 17:313. doi:10.1038/nm.2304.
- Cline MS, Smoot M, Cerami E. 2007. Integration of biological networks and gene expression data using Cytoscape. Nat Protoc. 2:2366–2382. doi:10.1038/nprot.2007.324.
- Cole C, Lau S, Backen A, Clamp A, Rushton G, Dive C, Hodgkinson C, McVey R, Kitchener H, Jayson GC 2010. Inhibition of FGFR2 and FGFR1 increases cisplatin sensitivity in ovarian cancer. Cancer Biol Ther. 10(5):495–504. doi:10.4161/cbt.10.5.12585.
- Crijns AP, Fehrmann RS, de Jong S, Gerbens F, Meersma GJ, Klip HG, Hollema H, Hofstra RM, te Meerman GJ, de Vries EG, van der Zee AG. 2009. Survival-related profile. Pathways, and transcription factors in ovarian cancer PloS Medicine. 6(2):e1000024.
- Cui J, Sun W, Hao X, Wei M, Su X, Zhang Y, Su L, Liu X. 2015. EHMT2 inhibitor BIX01294 induces apoptosis through PMAIP1-USP9X-MCL1 axis in human bladder cancer cells. Cancer Cell Int. 15(1):4. doi:10.1186/s12935-014-0149-x.
- Gao Q, Geng L, Kvalheim G, Gaudernack G, Suo Z. 2009. Identification of cancer stem-like side population cells in ovarian cancer cell line OVCAR-3. Ultrastruct Pathol. 33(4):175–181. doi:10.3109/01913120903086072.
- Gentleman RC, Carey VJ, Bates DM, Bolstad B, Dettling M, Dudoit S, Ellis B, Gautier L, Ge Y, Gentry J, et al. 2004. Bioconductor: open software development for computational biology and bioinformatics. Genome Biol. 5(10):80. doi:10.1186/gb-2004-5-10-r80.
- Gov E, Arga KY. 2016. Interactive cooperation and hierarchical operation of microRNA and transcription factor crosstalk in human transcriptional regulatory network. IET Syst Biol. 10(6):219–228. doi:10.1049/iet-syb.2016.0001.
- Gov E, Arga KY. 2017. Differential co-expression analysis reveals a novel prognostic gene module in ovarian cancer. Sci Rep. 7(1):4996. doi:10.1038/s41598-017-05298-w.
- Gov E, Kori M, Arga KY. 2017a. Multiomics analysis of tumor microenvironment reveals Gata2 and miRNA-124-3p as potential novel biomarkers in ovarian cancer. OMICS. 21(10):603–615. doi:10.1089/omi.2017.0115.
- Gov E, Kori M, Arga KY. 2017b. RNA-based ovarian cancer research from ‘a gene to systems biomedicine’perspective. Syst Biol Reprod Med. 63(4):219 238. doi:10.1080/19396368.2017.1330368.
- Hempel N, How T, Dong M, Murphy SK, Fields TA, Blobe GC. 2007. Loss of betaglycan expression in ovarian cancer: role in motility and invasion. Cancer Res. 67(11):5231 5238. doi:10.1158/0008-5472.CAN-07-0035.
- Hippisley-Cox J, Coupland C. 2012. Identifying women with suspected ovarian cancer in primary care: derivation and validation of algorithm. Bmj. 344:d8009. doi:10.1136/bmj.d8009.
- Hover LD, Young CD, Bhola NE, Wilson AJ, Khabele D, Hong CC, Moses HL, Owens P 2015. Small molecule inhibitor of the bone morphogenetic protein pathway DMH1 reduces ovarian cancer cell growth. Cancer Lett. 368(1):79–87. doi:10.1016/j.canlet.2015.07.032.
- Hsu CL, Juan HF, Huang HC. 2015. Functional analysis and characterization of differential coexpression networks. Sci Rep. 5:13295. doi:10.1038/srep13295.
- Hu L, McArthur C, Jaffe RB. 2010. Ovarian cancer stem-like side-population cells are tumourigenic and chemoresistant. Br J Cancer. 102(8):1276. doi:10.1038/sj.bjc.6605626.
- Huang DW, Sherman BT, Lempicki RA. 2009. Bioinformatics enrichment tools: paths toward the comprehensive functional analysis of large gene lists. Nucleic Acids Res. 37:1–13. doi:10.1093/nar/gkn923.
- Ideker T, Krogan NJ. 2012. Differential network biology. Mol Syst Biol. 8:565. doi:10.1038/msb.2011.99.
- Janzen DM, Tiourin E, Salehi JA, Paik DY, Lu J, Pellegrini M, Memarzadeh S. 2015. An apoptosis-enhancing drug overcomes platinum resistance in a tumour-initiating subpopulation of ovarian cancer. Nat Commun. 6:7956. doi:10.1038/ncomms8956.
- Jung JG, Shih IM, Park JT, Gerry E, Kim TH, Ayhan A, Handschuh K, Davidson B, Fader AN, Selleri L, et al. 2016. Ovarian cancer chemoresistance relies on the stem cell reprogramming factor PBX1. Cancer Res. 76(21):6351–6361. doi:10.1158/0008-5472.CAN-16-0980.
- Kanehisa M, Goto S, Sato Y, Kawashima M, Furumichi M, Tanabe M. 2014. Data, information, knowledge and principle: back to metabolism in KEGG. Nucleic Acids Res. 42:D199–D205. doi:10.1093/nar/gkt1076.
- Karabudak AA, Hafner J, Shetty V, Chen S, Secord AA, Morse MA, Philip R. 2013. Autoantibody biomarkers identified by proteomics methods distinguish ovarian cancer from non-ovarian cancer with various CA-125 levels. J Cancer Res Clin Oncol. 139(10):1757–1770. doi:10.1007/s00432-013-1501-6.
- Konstantinopoulos PA, Fountzilas E, Pillay K, Zerbini LF, Libermann TA, Cannistra SA, Spentzos D. 2008. Carboplatin-induced gene expression changes in vitro are prognostic of survival in epithelial ovarian cancer. BMC Med Genomics. 1(1):59. doi:10.1186/1755-8794-1-59.
- Kori M, Gov E, Arga KY. 2019. Novel genomic biomarker candidates for cervical cancer as identified by differential co-expression network analysis. OMICS. 23(5):261–273.
- Liu DC, Yang ZL, Jiang S. 2011. Identification of PEG10 and TSG101 as carcinogenesis, progression, and poor-prognosis related biomarkers for gallbladder adenocarcinoma. Pathol Oncol Res. 17(4):859. doi:10.1007/s12253-011-9394-7.
- Liu Z, Yang Z, Liu D, Li D, Zou Q, Yuan Y, Li J, Liang L, Chen M, Chen S. 2014. TSG101 and PEG10 are prognostic markers in squamous cell/adenosquamous carcinomas and adenocarcinoma of the gallbladder. Oncol Lett. 7(4):1128–1138. doi:10.3892/ol.2014.1886.
- Ma X, Ren L, Zhang N, Liu C, Zhu Y, Xiao J. 2017. Knock-down of KHDRBS3 gene inhibits proliferation of human ovarian cancer CAOV-3 cells. Xi Bao Yu Fen Zi Mian Yi Xue Za Zhi. 33(8):1062–1066.
- Marchini S, Fruscio R, Clivio L, Beltrame L, Porcu L, Nerini IF, Cavalieri D, Chiorino G, Cattoretti G, Mangioni C, et al. 2013. Resistance to platinum-based chemotherapy is associated with epithelial to mesenchymal transition in epithelial ovarian cancer. Eur J Cancer. 49(2):520–530. doi:10.1016/j.ejca.2012.06.026.
- Mythreye K, Blobe GC. 2009. The type III TGF-β receptor regulates epithelial and cancer cell migration through β-arrestin2-mediated activation of Cdc42. PNAS. 106(20):8221–8226. doi:10.1073/pnas.0812879106.
- Osaki M, Okada F, Ochiya T. 2015. miRNA therapy targeting cancer stem cells: a new paradigm for cancer treatment and prevention of tumor recurrence. Ther Deliv. 6:323–337. doi:10.4155/tde.14.122.
- Pils D, Wittinger M, Petz M, Gugerell A, Gregor W, Alfanz A, Horvat R, Braicu EI, Sehouli J, Zeillinger R, Mikulits W. 2010. BAMBI is overexpressed in ovarian cancer and co-translocates with Smads into the nucleus upon TGF-ß treatment. Gynecol Oncol. 117(2):189–197. doi:10.1016/j.ygyno.2009.12.034.
- Saito R, Smoot ME, Ono K. 2012. A travel guide to Cytoscape plugins. Nat Methods. 9:1068–1076. doi:10.1038/nmeth.2212.
- Siegel RL, Miller KD, Jemal A. 2016. (2016) Cancer statistics. CA Cancer J Clin. 66:7–30. doi:10.3322/caac.21332.
- Smyth GK. 2005. LIMMA: linear models for microarray data. In: Gentleman R, Carey V, Dudoit S, Irizarry R, Huber W, editors. Bioinformatics and computational biology solutions using R and bioconductor. NY: Springer; p. 397–420.
- Song J, Fadiel A, Edusa V, Chen Z, So J, Sakamoto H, Fishman DA, Naftolin F. 2005. Estradiol-induced ezrin overexpression in ovarian cancer: a new signaling domain for estrogen. Cancer Lett. 220(1):57–65. doi:10.1016/j.canlet.2004.04.024.
- Szotek PP, Pieretti-Vanmarcke R, Masiakos PT, Dinulescu DM, Connolly D, Foster R, Dombkowski D, Preffer F, MacLaughlin DT, Donahoe PK. 2006. Ovarian cancer side population defines cells with stem cell-like characteristics and mullerian inhibiting substance responsiveness. PNAS. 103(30):11154–11159. doi:10.1073/pnas.0603672103.
- Tothill RW, Tinker AV, George J, Brown R, Fox SB, Lade S, Johnson DS, Trivett MK, Etemadmoghadam D, Locandro B, Traficante N. 2008. Novel molecular subtypes of serous and endometrioid ovarian cancer linked to clinical outcome. Clin Cancer Res. 14(16):5198–5208. doi:10.1158/1078-0432.CCR-08-0196.
- Vathipadiekal V, Saxena D, Mok SC, Hauschka PV, Ozbun L, Birrer MJ. 2012. Identification of a potential ovarian cancer stem cell gene expression profile from advanced stage papillary serous ovarian cancer. PLoS One. 7(1):e29079. doi:10.1371/journal.pone.0029079.
- Wang L, Mezencev R, Bowen NJ, Matyunina LV, McDonald JF. 2012. Isolation and characterization of stem-like cells from a human ovarian cancer cell line. Mol Cell Biochem. 363(1–2):257–268. doi:10.1007/s11010-011-1178-6.
- Yoshihara K, Tajima A, Adachi S, Quan J, Sekine M, Kase H, Yahata T, Inoue I, Tanaka K. 2011. Germline copy number variations in BRCA1-associated ovarian cancer patients. Genes Chromosomes Cancer. 50(3):167–177. doi:10.1002/gcc.20841.
- Yoshihara K, Tsunoda T, Shigemizu D, Fujiwara H, Hatae M, Fujiwara H, Masuzaki H, Katabuchi H, Kawakami Y, Okamoto A, et al. 2012. High-risk ovarian cancer based on 126-gene expression signature is uniquely characterized by downregulation of antigen presentation pathway. Clin Cancer Res. 18(5):1374–1385. doi:10.1158/1078-0432.CCR-11-2725.
- Zeimet AG, Reimer D, Sopper S, Boesch M, Martowicz A, Roessler J, Wiedemair AM, Rumpold H, Untergasser G, Concin N, et al. 2012. Ovarian cancer stem cells. Neoplasma. 59(6):747. doi:10.4149/neo_2012_094.
- Zhan Q, Wang C, Ngai S. 2013. Ovarian cancer stem cells: a new target for cancer therapy. Biomed Res Int. 2013:916819. doi:10.1155/2013/916819.
- Zhang T, Xu J, Deng S, Zhou F, Li J, Zhang L, Li L, Wang QE, Li F. 2018. Core signaling pathways in ovarian cancer stem cell revealed by integrative analysis of multi-marker genomics data. PLoS One. 13(5):e0196351.
- Zhao X, Liu X, Su L. 2014. Parthenolide induces apoptosis via TNFRSF10B and PMAIP1 pathways in human lung cancer cells. J Exp Clin Cancer Res. 33:3. doi:10.1186/1756-9966-33-3. https://www.ncbi.nlm.nih.gov/pubmed/24387758
- Zhou Q, Chen A, Song H, Tao J, Yang H, Zuo M. 2015. Prognostic value of cancer stem cell marker CD133 in ovarian cancer: a meta-analysis. Int J Clin Exp Med. 8(3):3080.
- Zou J, Yin F, Wang Q, Zhang W, Li L. 2015. Analysis of microarray-identified genes and microRNAs associated with drug resistance in ovarian cancer. Int J Clin Exp Pathol. 8(6):6847.