
 ?Mathematical formulae have been encoded as MathML and are displayed in this HTML version using MathJax in order to improve their display. Uncheck the box to turn MathJax off. This feature requires Javascript. Click on a formula to zoom.
ABSTRACT
The aim of this work was to construct a score issued from a machine learning system with self-improvement capacity able to predict the fate of an ART embryo incubated in a time lapse monitoring (TLM) system. A retrospective study was performed. For the training data group, 110 couples were included and, 891 embryos were cultured. For the global setting data group, 201 couples were included, and 1186 embryos were cultured. No image analysis was used; morphokinetic parameters from the first three days of embryo culture were used to perform a logistic regression between the cell number and time. A score named DynScore was constructed, the prediction power of the DynScore on blastocyst formation and the baby delivery were tested via the area under the curve (AUC) obtained from the receiver operating characteristic (ROC). In the training data group, the DynScore allowed the blastocyst formation prediction (AUC = 0.634, p < 0.001), this approach was the higher among the set of the tested scores. Similar results were found with the global setting data group (AUC = 0.638, p < 0.001) and it was possible to increase the AUC of the DynScore with a regular update of the prediction system by reinforcement, with an AUC able to reach a value above 0.9. As only the best blastocysts were transferred, none of the tested scores was able to predict delivery. In conclusion, the DynScore seems to be able to predict the fate of an embryo. The reinforcement of the prediction system allows maintaining the predictive capacity of DynScore irrespective of the various events that may occur during the ART process. The DynScore could be implemented in any TLM system and adapted by itself to the data of any ART center.
Abbreviations: ART: assisted reproduction technology; TLM: time lapse monitoring system; AUC: area under the curve; ROC: receiver operating characteristic; eSET: elective single embryo transfer; AIS: artificial intelligence system; KID: known implantation data; AMH: anti-Müllerian hormone; BMI: body mass index; WHO: World Health Organization; c-IVF: conventional in-vitro fertilization; ICSI: intracytoplasmic sperm injection; PNf: pronuclear formation; D3: day 3; D5: day 5; D6: day 6; GnRH: gonadotrophin releasing hormone; FSH: follicle stimulating hormone; LH: luteinizing hormone; hCG: human chorionic gonadotropin; PVP: polyvinyl pyrrolidone; PNf: time of pronuclear fading; tx: time of cleavage to x blastomeres embryo; ICM: inner cell mass; TE: trophectoderm; NbCellt: number of cells at t time; FIFO: first in first out; TD: training data group; SD: setting data group; R: real world
Introduction
For the past 35 years, and despite considerable development in the techniques, culture media, and hormone treatments used, the rate of embryo implantation has remained stable with assisted reproduction technology (ART) processes (Kupka et al. Citation2014; De Geyter et al. Citation2018). In Europe, after an ART process the embryo transfer pregnancy rate is between 29.0% and 35.8% and the live birth rate per transfer 21.8% to 28.1% (Kupka et al. Citation2014; De Geyter et al. Citation2018). To increase the chances of pregnancy, ART teams have proposed the transfer of multiple embryos, but a significant association between this and the rate of multiple pregnancies has been found (Pinborg Citation2005). To limit the risk of multiple pregnancies, strict transfer policies have been developed by proposing an elective single embryo transfer (eSET) (Pandian et al. Citation2013). This significantly reduces the rate of multiple pregnancies without compromising birth rates but requires the selection of the best embryo for transfer (Pandian et al. Citation2013). The evaluation, classification, and selection of the transferred embryo are essential factors for the success of the ART attempt. Currently, in the majority of ART centers embryos for transfer are chosen according to specific morphological criteria at specific times (Guido et al. Citation2011). New approaches for the selection of transferred embryos have been developed (but not routinely applied as yet), and among these, the study of embryonic morphokinetic parameters through the use of incubators equipped with time lapse monitoring (TLM) systems for embryonic culture. The principle of this system is two-fold: first, it enables the collection of morphokinetic data of embryonic development to optimize the selection of embryos to transfer, and second, it improves growing conditions by reducing embryo handling time and exposure to light, and stabilizes the environment (temperature, atmosphere). From the morphokinetic parameters some models have been proposed to select as early as possible the embryo(s) able to reach the blastocyst stage and having the greatest chance of implantation (Azzarello et al. Citation2012; Cruz et al. Citation2012; Dal Canto et al. Citation2012; Chamayou et al. Citation2013; Basile et al. Citation2015; Siristatidis et al. Citation2015; Yang et al. Citation2015; Petersen et al. Citation2016; Goodman et al. Citation2016; Motato et al. Citation2016; Liu et al. Citation2016; Mizobe et al. Citation2016; Carrasco et al. Citation2017; Fishel et al. Citation2017). All such models are based on selected morphokinetic parameters for which thresholds have been determined to construct two main types of model, either hierarchical or selection/deselection models. However, these models have a major disadvantage in that they are not able to calculate a score if there is a missing value for one of the parameters included and are based on cutoff values. Thus, it has been reported that nearly half of all embryos are not classified (Herrero et al. Citation2013) precluding procedure optimization.
With the emergence of artificial intelligence system (AIS) (Uyar et al. Citation2015; Vogiatzi et al. Citation2019), it becomes possible to include an AIS in the TLM system (Manna et al. Citation2013; Matos et al. Citation2014; Khosravi et al. Citation2019; Tran et al. Citation2019). The goal of these systems is to predict embryo implantation once that embryo has reached blastocyst stage. By their construction, these systems were not able to predict embryos able to the reach blastocyst stage at the beginnings of embryo development.
The objective of the present study was therefore to model the growth of embryos using morphokinetic data. From this model to extract parameters to construct a score allowing the identification of embryos able to reach the blastocyst stage and predicting implantation capacity in order to use this score routinely for embryo selection in clinical practice. Moreover, this model has to adapt to the different changes occurring in the laboratory, so a reinforcement capacity score calculation has been added. To perform this work, an automatic embryo classification system based on machine learning was used.
Results
Initial training data group
Population
A total of 101 couples were included in the initial training data group that represented 110 ART cycles. There were 12.9% of women who smoked, female age was (mean ± SD) 34.2 ± 4.6 years, female BMI was a 24.0 ± 4.3, and AMH level was 3.9 ± 2.3 ng/mL. The number of ICSIs performed was 3.1 ± 1.4. The duration of ovarian stimulation was 11.5 ± 1.4 days, and this allowed the retrieval of 14.5 ± 5.6 oocytes. The fertilization rate was 70.6 ± 19.0% and 891 embryos were obtained. An embryo transfer was performed for all couples; the mean number of transferred blastocysts was 1.8 ± 0.6 (), 37 ART cycles had a single blastocyst transferred, 63 ART cycles had two blastocysts transferred, 9 ART cycles had three blastocysts transferred, and one ART cycle had four blastocysts transferred. Male age was 37.4 ± 5.6 years, male BMI was 26.3 ± 4.2, and 18.8% of men smoked. In 91.8% of attempts, the ART procedure was performed with fresh ejaculated sperm, and 39.8% of semen analyses were considered as normal according to the WHO classification. The delivery rate was 24.8% (25/101) by couple and 22.7% (25/110) by ART cycle, which corresponded to 34 live births; 16 twins and 18 singletons.
Table 1. Baseline and cycle characteristics according to delivery (mean ± SD) for the training data and the setting data
Blastocyst development
In this cohort of 110 ART cycles, 557 embryos meeting the criteria for embryo transfer at day 3 (number of blastomeres > 5 and embryo fragmentation < 50%) were included, among these 557 embryos, 444 (79.7%) reached the blastocyst stage. Among the embryos that reached the blastocyst stage, 226 (50.9%) were grade A, 75 (16.9%) grade B, and 143 (32.2%) grade C. Among the 444 blastocysts obtained, 190 (42.8%) were transferred, and 100 (22.5%) were vitrified. Among the 190 transferred blastocysts, 136 (71.6%) were grade A, 40 (21.1%) grade B, and 14 (7.4%) grade C. Among these embryos, 134 (70.5%) were transferred on day 5 and 56 (29.5%) on day 6. The delivery rate by cycle was 28.9% (22/76) for embryos transferred on day 5, and 11.8% (4/34) for embryos transferred on day 6 (p < 0.05).
Explanation models
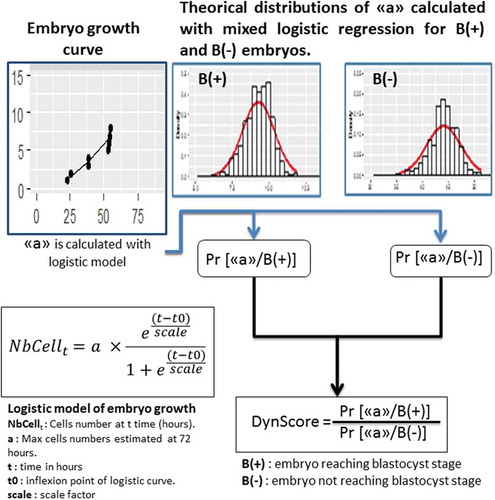
A simple function is not able to model the embryo development, with all occurring events. The first step was to find a function able to estimate the number of embryos blastomers according to the morphokinetic values, i.e., time of observation, during the first three days: the embryo growth model. The logistic function was used for this purpose, even if with this function the acceleration of cell division could not be modeled. From the morphokinetic values obtained during the three first days of embryo life (from PNf to t9), the logistic function (Equation 1) was used to perform a logistic regression between the number of cells and time of observation.
Equation 1: Logistic function for cells number according to time of observation for the first three days.
NbCellt: number of cells at t time (t in hours).
a: Estimated number of maximum cells at 72 hours equivalent to the asymptote of the logistic curve.
t: time of cell division, in hours.
t0: inflexion point of the logistic curve.
scale: scale factor.
First a theoretical distribution of ‘a’ coefficient from the embryo growth model was elaborated. For this, mixed logistic functions were used to calculate means and variances of the ‘a’ coefficients. The scale values were fixed, and not estimated by the mixed logistic functions. Two mixed logistic functions were calculated, a mixed logistic function for the embryos not able to reach the blastocyst stage (B(-) prediction model), and a mixed logistic function for the embryos able to reach the blastocyst stage (B(+) prediction model). From obtained means and variances issued of the mixed logistic functions, the Gaussian distributions of the ‘a’ coefficients were calculated.
Then, the embryo growth was also modeled with the same equation but in this case the non-mixed version of the logistic function was used, i.e., without a random effect. Thus for each embryo ‘a’ coefficient was estimated, named: ‘a.observed’ coefficient. With the Gaussian distributions of ‘a’ coefficients it was possible to calculate the probability that the ‘a.observed’ coefficient’ value belongs to B(-) and B(+) prediction models ().
Figure 1. The different steps to construct the DynScore.The ‘Embryo growth curve’ was obtained from the morphokinetic points and modeled with a logistic model. From these points according the fate of embryo, two mixed logistic regressions were calculated (B(+), i.e., embryos able to reach the blastocyst stage, and B(-), i.e., embryos not able to reach the blastocyst stage). From these mixed logistic regression the theoretical distributions of ‘a’ parameter have been calculated. For each embryo, the conditional probability of ‘a’ parameter was calculated according to B(+) or B(-) fate. From these two probabilities, the DynScore was calculated
Predictive model: The DynScore calculation
The construction of the DynScore was performed in several steps. The probabilities that the ‘a.observed’ coefficient belonged to B(+) model or B(-) prediction models were calculated according to the Gaussian distributions of ‘a’ in case of B(+) and B(-) prediction models ().
With these probabilities, DynScore was calculated (Equation 2):
Equation 2: Calculation of DynScore from the probabilities
Once the DynScore was calculated, it was compared to a set of known scores based on morphokinetic parameters: the KidScore (Petersen et al. Citation2016), the score reported by Cruz et al. (hereafter referred to as the Cruz score) (Cruz et al. Citation2012), the score reported by Basile et al. (hereafter referred to as the Basile score) (Basile et al. Citation2015), the score reported by Dal Canto et al. (hereafter referred to as the Dal Canto score) (Dal Canto et al. Citation2012), the score reported by Chamayou et al. (hereafter referred to as the Chamayou score) (Chamayou et al. Citation2013), and the score reported by Azzarello et al. (hereafter referred to as the Azzarello score) (Azzarello et al. Citation2012). The transferred blastocysts were considered as KID embryos, the KID status was KID (+) if the transferred embryo was implanted and KID (-) if the embryo was not implanted.
The reinforcement capacity
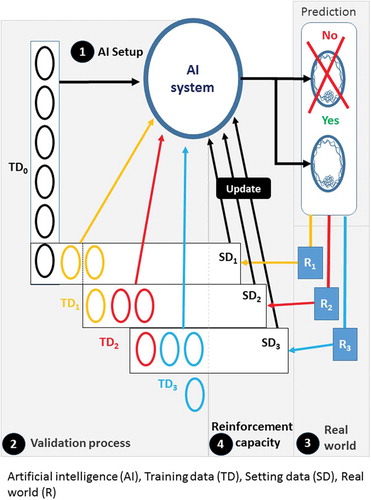
Two predictive systems were elaborated. One predictive system without reinforcement capacity: frozen system and one predictive system with reinforcement capacity: system with reinforcement capacity. For the system with reinforcement capacity, in order to take into account, the fluctuations due to the different parameters involved in embryonic growth, the theoretical distributions of the ‘a’ coefficients obtained from the B(-) and B(+) prediction models were regularly recalculated with the data of embryos included the previous weeks whose fate was known, i.e., the Gaussian distributions of ‘a’ coefficients were regularly recalculated. The prediction models were first constructed on initial training data group, these ones were used to calculate DynScore values in order to predict the fate of embryos, and these predicted embryos constituting a sub setting data group. When the real fate of this sub setting data group was known in the real world. This setting data group was integrated in the training data group, in the same time the embryos belonging to the oldest week have been removed from the training data group, thus allowing a new training data group to be set up as a FIFO (first in first out) stack. With this new training data group the theoretical distributions of ‘a’ coefficient were recalculated and the DynScore was recalculated with these new distributions, these new predictive models were used for one week, until other predictive models were calculated the following week (). The new training data group included between 153 and 207 embryos. The period chosen was the week, so embryos (between 11 and 43 embryos) that have been put into TLM the previous week were considered to have their growing conditions as close as possible to the embryos whose fate was to be predicted and have been included in the new training data group.
Figure 2. Explanatory diagram of the reinforcement process. 1- Artificial intelligence (AI) setup: First, the variables of the model are calculated to allow the attribution of a DynScore for each embryo by the artificial intelligence (AI system) from a first training data group (TD0). 2- Validation process: the fate of the embryos is predicted in batches, these batches are the setting data groups (SDx), each SDx corresponds to a set of embryos corresponding to one week of operation. 3- Real world: The real fate of each embryo is known later in the real world (Rx). A new training data group will be created. 4- AI reinforcement: This training data group includes the embryos that have just been ‘predicted’ (TDx) but whose real future is known, which are added to the previous training data group (TDx-1), from which embryos from the oldest week is subtracted. A new SD, SDx, is therefore created which will allow the AI system parameters to be recalculated (update). The following setting data group SDx+1 is predicted with this new AI system. This process is restarted after each TD
Prognosis factors for blastocyst formation
Morphokinetic parameters
The morphokinetic parameters were not available for all embryos. PNf was obtained for all embryos; t2 was not measured for 2.0% of the embryos, t3 for 12.2%, t4 for 2.9%, t5 for 4.8%, t6 for 5.7%, t7 for 4.7%, and t8 for 2.7%. Only 70.2% (391/557) of embryos had all morphokinetic parameters available.
The scores and embryo fate
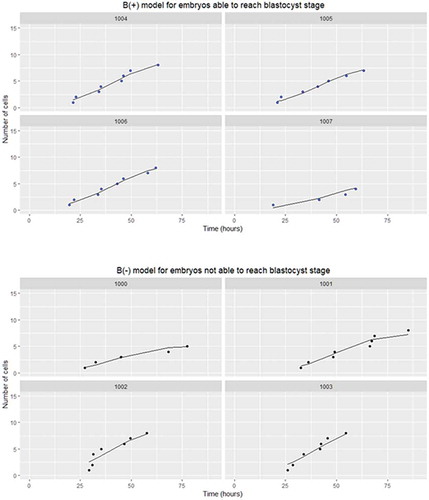
Embryonic growth was modeled according to equation 1 as illustrated in . For the learning study, the DynScore was calculated for all embryos; among the other scores tested this was the case for only the Azzarelo score. The least effective score was the Cruz score, calculated for only 81.0% of the embryos. For the blastocyst formation prediction, the best AUC value with p < 0.001 was obtained with the DynScore and the KidScore (AUC = 0.634 for both), followed by the Cruz score (AUC = 0.576, p = 0.011). The AUC values of the Basil score (AUC = 0.557), Dal Canto score (AUC = 0.542), Chamayou score (AUC = 0.538), and Azzarello score (AUC = 0.483) were not significantly different from 0.5 ().
Table 2. AUC values according to blastocyst and useful embryo obtention for learning and validation set with frozen model
Figure 3. Logistic function for embryos able to reach (B(+) model) or not (B(-) model) the blastocyst stage. The circles represent the morphokinetic parameters measured; the line represents the logistic function. The curves represent the cell growth modeling according the number of points available. The number in each box represents the embryo identification number. (B(+), i.e., embryos able to reach the blastocyst stage, and B(-), i.e., embryos not able to reach the blastocyst stage)
For the prediction of obtaining a useful embryo, the best AUC was obtained with Dynscore (AUC = 0.625, p < 0.001), followed by KidScore (AUC = 0.609, p < 0.001), Chamayou score (0.576, p < 0.001), Dal Canto score (AUC = 0.563, p = 0.003), Basile score (AUC = 0.565, p = 0.009), Cruz score (AUC = 0.543, p = 0.069), and Azzarello score (AUC = 0.497, p = 0.787). The AUC values of the Cruz score and Azzarello score were not statistically different from 0.5 (). None of the tested scores was able to predict delivery.
Validation of the DynScore with global setting data group
Blastocyst formation validation
In the global setting data group, a total 229 ART cycles were included from which 1186 embryos were obtained. No difference was found between the training data group and the global setting data group for cycle characteristics data (). Among these 1186 embryos, 755 (63.7%) reached the blastocyst stage. Among the embryos that reached the blastocyst stage, 270 (35.8%) were grade A, 283 (37.5%) grade B, and 202 (26.8%) grade C. Among the 755 blastocysts obtained, 404 (53.5%) were transferred and 170 (22.5%) were vitrified. Among the 404 transferred blastocysts, 196 (48.5%) were grade A, 125 (30.9%) grade B, and 83 (20.5%) grade C. Among these transferred embryos, 341 (84.4%) were transferred on day 5 and 63 (15.6%) on day 6. The embryos transfer was performed for 227 ART cycles; the overall delivery rate was 22.7 (52/229) by ART cycle and 22.9% (52/227) by embryo transfer. The delivery rate was 22.9% (43/188) for embryos transferred on day 5, and 22.0% (9/41) for embryos transferred on day 6 (p = 0.899).
Frozen system
For the blastocyst formation prediction, the best AUC values with p < 0.001 were obtained with the DynScore (AUC = 0.638), followed by the KidScore (AUC = 0.624), the Basile score (AUC = 0.556, p = 0.007), and the Cruz score (AUC = 0.549, p = 0.032). The AUC values of Dal Canto score (AUC = 0.536), Chamayou score (AUC = 0.511), and Azzarello score (AUC = 0.498) were not significantly different from 0.5 ().
For the prediction of obtaining a useful embryo, the best AUC was obtained with Dynscore (AUC = 0.629, p < 0.001), followed by KidScore (AUC = 0.628, p < 0.001), Cruz score (AUC = 0.543, p < 0.001), and Basile score (AUC = 0.546, p = 0.013). The AUC values of the other scores were not statistically different from 0.5 (). However, none of the samples tested was the score able to predict delivery, for all, the AUC value was not statistically different from 0.5.
Predictive system with the reinforcement capacity
With the system with reinforcement capacity, the AUC of the DynScore values varied from 0.504 to 0.939 in comparison to frozen system for which the AUC values of the DynScore varied from 0.420 to 0.895. The DynScore AUC values obtained with the system with the reinforcement capacity were significantly higher than the DynScore AUC values obtained with the frozen system (p = 0.013) (). The AUC values of the DynScore obtained with the system with reinforcement capacity were above 0.7 in 56.3% (18/32) of cases during period time of the study, the DynScore AUC values of the frozen system were above 0.7 in 40.6% (13/32) during the same period ().
Figure 4. The AUC values of the DynScore according to system with reinforcement capacity and to the frozen system. For the two systems, the AUCs (area under curve) values were calculated each week with embryos whose fate was known. In the majority of cases, the AUCs values obtained with the system with reinforcement capacity (solid line) were above the AUC values obtained with to the frozen system (dashed line)
However, even with the reinforcement capacity, DynScore was unable to predict delivery; the DynScore AUC value was not statistically different from 0.5.
Discussion
Among all samples tested and scored, the DynScore was able to predict blastocyst formation yielding a useful embryo. Whatever, the studied sample, the AUC values of the DynScore and of the KidScore were the best. This DynScore was calculated for embryos that would potentially have been transferred on D3. Wong et al. (Citation2010) were among the first to report a method to predict the embryos able to reach the blastocyst stage; following the analysis of thawed zygotes assigned to research, the authors used a nonhierarchical model that included the cc1, cc2, and s2 morphokinetic parameters. Similarly, Hashimoto (Hashimoto et al. Citation2012) worked on thawed zygotes but their model was constructed using the s2 and s3 morphokinetic parameters. This illustrates that for each mathematical model, choices must be made as to which parameters are to be included principally to minimize collinearity between variables, but also because the performance of scores to predict blastocyst formation may be adversely affected if too many parameters are included in its construction, that will be the case is a logistic regression was performed including all morphokinetic parameters (Freour et al. Citation2015). In addition, the risk of missing data precluding score calculation for a given embryo also increases in function of the increasing number of variables used in the model. The scores reported by Wong et al. (Citation2010) and Hashimoto et al. (Citation2012) were not tested herein as more recent scores with better performance have since been described.
Interestingly, the Azzarello score (Azzarello et al. Citation2012) and the Dal Canto score (Dal Canto et al. Citation2012) were calculated in all (or nearly all) embryos, but these are based on only one parameter (PNf or t9, respectively) that is often known. However, a score that only considers a single parameter may not be sufficiently precise. This is illustrated herein as only the KidScore (Petersen et al. Citation2016), the Cruz score (Cruz et al. Citation2012), and the DynScore were able to predict (equally well) the capacity of an embryo to reach the blastocyst stage. The results of the present study confirm the finding reported by Barrie (Barrie et al. Citation2017) who found that the Cruz score was able to predict blastocyst formation, whereas the Basile, the Dal Canto, Chamayou score, and Azzarello scores did not (the KidScore was not studied). Among the scores tested, the DynScore, the KidScore, the Cruz score, and the Basile score were associated with blastocyst formation on D5. However, the AUC obtained for blastocyst formation was not as high as one would have expected, regardless of the score used. The DynScore construction was based on a mixed model. These models take into account the variance in their definition and the variation of this variance was involved in the prediction of embryo fate. In order to obtain a useful variation of variance, the size of the data should not be too important as in consequence the variation of variance will be too low to be useful in this model. In this particular case, it was necessary to obtain relatively large to achieve the theoretical distributions. This was possible only if the samples were not too large, as the variance depends on the size of the sample and this variance decreased as the sample size increased. In order to increase the DynScore AUC, the predictive system was improved by the inclusion of a reinforcement capacity. This improvement allowed maintaining or increasing the capacity of the DynScore to predict the blastocyst formation. This reinforcement capacity improvement was allowed because DynScore corresponds to a mathematical formula that could be calculated easily. In comparison to the other cited scores where the morphokinetic parameters thresholds were fixed and they were unable to follow easily the changes in embryonic dynamic growth. The purpose of reinforcement of the predictive system is to maintain the DynScore predictive effectiveness, i.e., to maintain the AUC value at its initial level or even increase it. As the DynScore has been implemented under particular culture and/or ovarian stimulation conditions or even with certain types of patients, as soon as changes occur the predictive potential of the DynScore may decrease, its calculation conditions must be updated to respond to these new conditions: modification of the type of patients recruited, modification of ovarian stimulation protocols, modification of culture conditions, etc. These updates result in a fluctuating aspect of the evolution of the AUC of the DynScore over time; decreases of the AUC followed by a refining or even an improvement of the AUC.
The DynScore based on morphokinetic parameters does not use any image information AI as usually undertaken when for predicting embryo fate. However, AI based on image processing and image transformations (Laplacian filter, gradient filter, etc.) to obtain quantitative data was employed. These data are used in AI-based deep learning systems in order to predict the embryo outcome, for this, a ‘black box’ is created accordingly complicated as the number of layers of the neural networks involved. The DynScore approach could evoke a mix of neural network with only one neural layer (calculation layer) and recurrent neural network where the fine-tuning of the weights was time dependant (Vogiatzi et al. Citation2019). However, no layer of classification was used as low quantity of data was available, so the output of the calculation layer was directly used to provide a result. In order to set the DynScore, the quantity of morphokinetic data was not important in comparison to deep learning (Khosravi et al. Citation2019; Tran et al. Citation2019), and similar predictive capacity was obtained. The DynScore that corresponds to a ratio of two probabilities obtained from the Gaussian distribution. This could be calculated from the morphokinetic data obtained from any TLM system and provide a model specific for each TLM system and each ART center. It has been shown that some morphokinetic parameters were ART center dependant (Zaninovic et al. Citation2019).
Obtaining a blastocyst is a necessary but not sufficient requirement to achieve an ongoing pregnancy. For instance, although the scores can predict blastocyst formation and day of formation, they are not able to predict delivery even though there is a negative correlation between live birth rate after transfer of blastocysts obtained on D6 compared to those obtained on D5 (Dessolle et al. Citation2011; Poulsen et al. Citation2017). It is therefore important to keep in mind that embryo implantation and delivery do not depend exclusively on the embryo itself but also on the characteristics of the woman. Among the women’s characteristics studied, age was one of the most important as has been reported elsewhere (Stolwijk et al. Citation2000; Stone et al. Citation2014). From a physiological perspective this means that the information from morphokinetic data of the first 3 days is not sufficient to predict the fate of the embryo and that further phenomena of high relevance are necessary.
This study does, have some limitations; the most notable is that the number of instances analyzed may seem low. However it was possible to construct a model of embryo growth and extract the DynScore, which has a predictive power of the fate of these embryos. This DynScore requires validation on more data from other centers, hence the interest of multicentre studies when designing models. Moreover, couples benefiting from the TLM system are a source of bias as most had failed at least one ART procedure. To decrease bias when considering failures, important female (high BMI, low ovarian response) or male factors (azoospermia or severe oligoasthenoteratozoospermia) were not included in the present study and this may be a limitation. Furthermore, all embryos included in the present study originated from an ICSI procedure; no embryo originated from a c-IVF was included as the precise time of fertilization could not be obtained. The clinical interest of DynScore is certainly less due to the change of procedures in ART process: transfer at the blastocyst stage rather than at D3 is preferred; however the DynScore allows one to obtain an objective score at D3 for embryos and confirms that the fate of an embryo is determined during the first three days. Moreover, the DynScore can be included in the data from an image-based AI system to increase the information available and improve the predictive power of this AI. Another aspect is that the association between the DynScore and delivery rate was biased as blastocyst transfer was determined based on morphological quality leading to an underrepresentation of blastocysts with low DynScore among those transferred, precluding statistical comparison owing to the lack of power in the training data group. In order to study the impact of DynScore, it would be necessary to carry out a study in which the embryo to be transferred was selected randomly but this would lead to significant ethical problems. However, one possibility would be to carry out transfers of a single embryo at D3 on the basis of the DynScore and to compare pregnancy rates to a matched group in which a single embryo was transferred on D5 according to morphological criteria (Kaser et al. Citation2017). Furthermore, in order to be useful the DynScore should be tested in external ART centers as it has been shown that a score could have a good performance in the ART center in which it has been developed but to be not optimally implemented elsewhere (Freour et al. Citation2015). Consideration should be given to provide the program scripts to the scientific community in order to allow other teams to test and validate the relevance of the proposed predictive models.
In conclusion, the DynScore presented herein has been validated for the prediction of blastocyst formation but was unable to predict delivery. The DynScore calculation was improved by the inclusion of a reinforcement capacity which corresponds to an agent of an artificial intelligence system that will allow its portability between centers.
Materials and methods
Study population
A single center retrospective study was performed in the laboratory of reproductive biology at the Femme Mère Enfant hospital (Lyon, France). This study was approved by our infertility review board and institutional review boards (IRB). According to French law, as this study concerns biological data already collected outside the genetic study, the opinion of the IRB is sufficient. However, patients were previously informed that their anonymized medical data could be used for retrospective research protocols.
Two sets of couples were used for this study, respectively, for model setup (initial training data group) and validation (global setting data group). The initial training data group included couples for whom oocyte retrieval for an ART process was performed between 1 May 2013 and 30 April 2015. The global setting data group included couples for whom oocyte retrieval for ART process was performed between 1 June 2015 and 31 December 2017.
During this study period, two series of sequential media were alternately used. Embryos obtained from couples were cultured in an incubator equipped with a TLM system (EmbryoScope, Vitrolife, Goteborg, Sweden), and morphokinetic parameters analyzed. The objective was to elaborate and validate a new embryonic score able to predict the blastocyst formation from the morphokinetic parameters of any embryo placed in the EmbryoScope (Vitrolife). This new embryonic score will be compared to a set of published scores based on the TLM system. ‘Only the blastocysts from the transfers in which all the transferred blastocysts did or did not implant were select for analysis. These embryos were defined as known implantation data (KID) embryos’ (Coello et al. Citation2017).
Participants
Exclusion criteria for women were: anti-Müllerian hormone (AMH) levels < 0.4 ng/mL, a body mass index (BMI) > 35.0, retrieval of <5 mature oocytes, or repeated miscarriages. For men, the exclusion criteria were sperm from testicular biopsy or oligozoospermia with <1 million motile sperm/ejaculate. The semen was classified according to the WHO classification (World Health Organization Citation2010).
Conventional in-vitro fertilization (c-IVF) cycles were not retained due to the difficulty to precisely date the time of fertilization, resulting in a mismatch with the cleavage time. Only embryos obtained by intracytoplasmic sperm injection (ICSI) were included as the time of the sperm penetration into oocyte is precisely known. Embryos with 1 pronuclear (PN) or 3 PN, as well as lysed embryos were not analyzed. Within an embryo cohort, only embryos with ≥6 blastomeres and <50% fragmentation on day 3 (D3) of development were analyzed in order to study all embryos that would potentially have been transferred on D3 based on morphological criteria. All segmented embryos on day three with at least three time points (the minimum number of values to estimate the mathematical model) were included.
The initial training data group
The initial training data group included 101 couples, which had performed 108 ART cycles. The morphokinetic parameters were entered in the TLM system database by the lab team (technicians and embryologists). When a morphokinetic parameter was not in the TLM system database, the concerned embryo did not pass through the concerned stage.
The global setting data group
The global setting data group was segmented in 34 groups of embryos, and each sub setting data group corresponding to embryos put in the TLM system during the same week. Thus each sub setting data group represents about 20% of the total data, which complies with the machine learning rules. The global setting data group was included by 201 couples, who had performed 228 ART procedures between 1 June 2015 and 31 December 2017. The embryonic follow-up and the data entry of the global setting data group in the TLM system were carried out by the lab team as the entry of initial training data group. For the analysis when a data point (morphokinetic data) was missing in the global setting data group, no retroactive annotation was performed in order to perform the future calculation process in the real-life conditions of routine laboratory practice. With this way of proceeding, the construction of a real dataset test was not feasible. With this way of proceeding, the construction of a real dataset test group was not possible.
KID status
For the classification of blastocyst according to KID status, ART procedures with a delivery in which the number of babies did not match the number of transferred blastocysts were excluded. Furthermore, if several blastocysts were transferred but no delivery was obtained, these cases were included in the blastocyst implantation investigation study.
Stimulation protocol
Patients were stimulated by a gonadotrophin releasing hormone (GnRH) agonist protocol. This protocol included GnRH agonist and recombinant follicle stimulating hormone (FSH) (Campbell et al. Citation2013; Fishel et al. Citation2016) that was sometimes associated with luteinizing hormone (LH) (Alviggi et al. Citation2018). The induction of ovulation was induced by injection of recombinant human chorionic gonadotropin (hCG), Ovitrelle (MerckSerono, Darmstadt, Germany). The trigger criteria for induction of ovulation were >3 follicles with a diameter > 16 mm determined by ultrasound, an endometrium > 7 mm thick, an estradiol value ≥ 250 ng/mL/follicle. Ovarian puncture was performed 34–36 hours after ovulation induction under general anesthesia. From the day of oocyte retrieval, support of the luteal phase was performed by intra-vaginal progesterone administration (de Ziegler et al. Citation2018).
Fertilization and embryo cultivation
The origin of the semen was either fresh or frozen sperm, or frozen donor sperm. Sperm preparation was performed by the density gradient selection technique. Each layer was composed of IVF medium (Origio, Malov, Denmark) and Suprasperm (Origio). A three-layer gradient was used: 90%, 70%, and 50% Suprasperm. After centrifugation for 20 minutes at 394 g, the 90% layer was suspended in 4 mL of washing medium, Ferticult (FertiPro, Beernem, Belgium) and then centrifuged for 10 minutes at 701 g. Finally, the sperm pellet was taken up in a recovery volume of Ferticult (FertiPro), with the aim of obtaining a final concentration of 1 million/mL progressive spermatozoa in order to allow the microinjection procedure. Retrieved oocytes, surrounded by their follicular cells were placed in Nunc dishes (Nunc, Roskilde, Denmark) containing FERT medium (Origio). The oocyte decoronisation was performed in two stages: hyaluronidase decoronisation using SynVitro Hyadase (Origio) followed by a finer mechanical decoronisation using Stripper (Origio).
For the ICSI process, each oocyte was placed in an 8 µL micro-drop of G-IVF medium (Origio) in microinjection boxes. The selection of the injected spermatozoon was performed in 10 µL of polyvinyl pyrrolidone (PVP) SpermSlow (Origio). Microinjection was performed on a micromanipulator; either Integra (Nikon Instruments Europe BV) or Leica AM6000 (Leica micro system, Wetzlar, Germany). Directly after injection, the oocytes were placed in EmbryoSlide (Vitrolife) culture dishes specific to the EmbryoScope (Vitrolife) TLM system.
During this study period, two series of sequential media were alternately used G-SERIES (G1 and G2, Vitrolife) and ISM1/BlastAssist (BA, Origio). Embryo culture was carried out in a 25 µL micro-drop of G1 or ISM1 under a layer of paraffin oil (Origio). After 48 hours of culture with the first media (G1 or ISM1), this was replaced with G2 or BA, respectively, and not changed until the end of the embryo culture. The embryos were observed daily using the EmbryoViewer (Vitrolife), which is software that allows the observation of the embryos placed in the EmbryoScope. To determine the moments of cell division, in the TLM system, images of each embryo were acquired every 20 minutes (1000 x 1000 pixels) at seven different focal planes to determine the developmental events from the syngamy to the blastocyst stage. From these events, the EmbryoViewer calculated times; those used in the present study were: PNf (time of pronuclear fading), t2 (time of cleavage to two blastomere embryo), t3 (time of cleavage to three blastomere embryo), t4 (time of cleavage to four blastomere embryo), t5 (time of cleavage to five blastomere embryo), t6 (time of cleavage to six blastomere embryo), t7 (time of cleavage to seven blastomere embryo), t8 (time of cleavage to eight blastomere embryo), and t9 (time of cleavage to nine blastomere embryo). Intervals between time points, s2 (= t4-t3), s3 (=t8-t5), cc2 (= t4-t2), and cc3 (= t8-t4), were not used in the DynScore calculation.
Embryo assessment and selection for transfer
For the global setting data group, the embryo quality on D3 according to the number of blastomeres and the proportion of cell fragmentation was assessed. The following classification was used: between 6 and 9 blastomeres and less than 10% of cells fragmentation: grade 1; between 6 and 9 blastomeres and cells fragmentation between 10% and 20%: grade 2; between 6 and 9 blastomeres and cells fragmentation between 20% and 50% or between 4 and 6 blastomeres and cells fragmentation less than 50%: grade 3, the remaining embryos were classified as grade 4.
Blastocyst quality was assessed using the Gardner and Schoolcraft classification (Gardner and Schoolcraft Citation1999). Only blastocysts with an expansion size above 2 were considered to have reached the blastocyst stage and were assessed for the quality. Grade A corresponds to blastocyst stage embryos with inner cell mass (ICM) and trophectoderm (TE) rated A. Grade B corresponds to the blastocyst stage embryos with ICM and TE rated B, or one of the two parameters rated B and the other A, or blastocyst graded B1 or B2 on the 5th day of development. Grade C corresponds to embryos at the blastocyst stage with ICM and/or TE rated C or, blastocyst graded B1 or B2 on the 6th day of development.
The blastocyst(s) with the highest quality (grade A > B > C) was (were) selected for the transfer. Embryo transfer was performed using EmbryoGlue medium (Vitrolife) and an Elliocath catheter (Ellios Bio Tek laboratory, Paris, France) on day 5 (D5) or day 6 (D6). The supernumerary blastocysts were vitrified (RapidVit Blast, Vitrolife) if they were graded A.
In order to test the capacity of prediction of the different scores, two embryo fates were used. The first fate was the capacity of an embryo to reach the blastocyst stage: blastocyst obtention. The second fate was the possibility of an embryo not only to reach the embryo stage but also to be transferred or vitrified: useful embryo.
The delivery of a healthy baby was used to investigate the relationship between morphokinetic parameters and ART outcome.
Software use
The analysis was developed using the R software (v3.5) (R Core Team Citation2014), the package ‘lme4’ (Bates et al. Citation2015) was used for the computation of the mixed models allowing the computation of the theoretical distributions of the coefficients ‘a’, ‘nlstools’ from the nlme package (Pinheiro et al. Citation2018) were used for embryo by embryo modeling in order to calculate ‘a.observed’; the ‘ROCR’ package (Sing et al. Citation2005) was used for area under the curve (AUC) calculation, and the ‘ggplot2ʹ package (Wickham Citation2016) for graphic representations. The AUC obtained from the ROC curve was used to appreciate the performance of the DynScore to predict blastocyst formation, the obtention of useful embryos and the outcome of ART procedure.
Statistical methods
The statistical analysis was performed using data from the EmbryoViewer and extracted from the medical ART database (MediFirst database, Medifirst, Montigny Le Bretonneux, France).
The parameters were described as mean ± standard deviation (SD) for normal quantitative variables; the percentage distribution was used for categorical variables. In case of normal distribution tested with Kolmogorov-Smirnov test, Student t, ANOVA and Chi-squared tests were used; otherwise Mann-Whitney U test or Kruskal-Wallis tests were used.
In order not to lose information, the DynScore has not been transformed into a categorical variable. The DynScore values obtained with the system with reinforcement capacity were compared with the DynScore values calculated with the frozen system. The prediction power of the DynScore on blastocyst formation and the baby delivery was tested via the area under the curve (AUC) obtained from the receiver operating characteristic (ROC). Each week, two AUCs were calculated for the sub setting data group, one for DynScore values calculated using system with reinforcement capacity and one for DynScore values calculated with the frozen system. A test was considered significant when p was less than 0.05.
Author contributions
Acquisition of the data, and revising the manuscript: SGE; design of the work, and acquisition and analysis of the data, and revising the manuscript: EL; contribution of the conception and design of the work, and data acquisition and revising the manuscript: CE; analysis of the data, and revising the manuscript: MF; acquisition of the data, and revising the manuscript: BS; acquisition of the data, and revising the manuscript: JL; conception and design of the work, and acquisition and analysis and interpretation of data for the work, and drafting the work: MB. All authors have approved the final article.
Ethics approval
This study was approved by our infertility review board and institutional review boards (IRB). According to French law, as this study concerns biological data already collected outside the genetic study, the opinion of the IRB is sufficient. However, patients were previously informed that their anonymized medical data could be used for retrospective research protocols.
Acknowledgments
We thank Philip Robinson (DRCI, Hospices Civils de Lyon) for help in manuscript preparation.
Disclosure statement
No potential conflict of interest was reported by the authors.
Additional information
Funding
References
- Alviggi C, Conforti A, Esteves SC, Andersen CY, Bosch E, Bühler K, Ferraretti AP, De Placido G, Mollo A, Fischer R, et al. 2018. Recombinant luteinizing hormone supplementation in assisted reproductive technology: a systematic review. Fertil Steril. 109(4):644–664. doi:10.1016/j.fertnstert.2018.01.003.
- Azzarello A, Hoest T, Mikkelsen AL. 2012. The impact of pronuclei morphology and dynamicity on live birth outcome after time-lapse culture. Hum Reprod. 27(9):2649–2657. doi:10.1093/humrep/des210.
- Barrie A, Homburg R, McDowell G, Brown J, Kingsland C, Troup S. 2017. Examining the efficacy of six published time-lapse imaging embryo selection algorithms to predict implantation to demonstrate the need for the development of specific, in-house morphokinetic selection algorithms. Fertil Steril. 107(3):613–621. doi:10.1016/j.fertnstert.2016.11.014.
- Basile N, Vime P, Florensa M, Aparicio Ruiz B, García Velasco JA, Remohí J, Meseguer M. 2015. The use of morphokinetics as a predictor of implantation: a multicentric study to define and validate an algorithm for embryo selection. Hum Reprod. 30(2):276–283. doi:10.1093/humrep/deu331.
- Bates D, Mächler M, Bolker B, Walker S. 2015. Fitting linear mixed-effects models using lme4. J Stat Softw. 67(1):1–48. doi:10.18637/jss.v067.i01.
- Campbell A, Fishel S, Bowman N, Duffy S, Sedler M, Thornton S. 2013. Retrospective analysis of outcomes after IVF using an aneuploidy risk model derived from time-lapse imaging without PGS. Reprod Biomed Online. 27(2):140–146. doi:10.1016/j.rbmo.2013.04.013.
- Carrasco B, Arroyo G, Gil Y, Gómez MJ, Rodríguez I, Barri PN, Veiga A, Boada M. 2017. Selecting embryos with the highest implantation potential using data mining and decision tree based on classical embryo morphology and morphokinetics. J Assist Reprod Genet. 34(8):983–990. doi:10.1007/s10815-017-0955-x.
- Chamayou S, Patrizio P, Storaci G, Tomaselli V, Alecci C, Ragolia C, Crescenzo C, Guglielmino A. 2013. The use of morphokinetic parameters to select all embryos with full capacity to implant. J Assist Reprod Genet. 30(5):703–710. doi:10.1007/s10815-013-9992-2.
- Coello A, Meseguer M, Galán A, Alegre L, Remohí J, Cobo A. 2017. Analysis of the morphological dynamics of blastocysts after vitrification/warming: defining new predictive variables of implantation. Fertil Steril. 108(4):659–666.e4. doi:10.1016/j.fertnstert.2017.07.1157.
- Cruz M, Garrido N, Herrero J, Pérez-Cano I, Muñoz M, Meseguer M. 2012. Timing of cell division in human cleavage-stage embryos is linked with blastocyst formation and quality. Reprod Biomed Online. 25(4):371–381. doi:10.1016/j.rbmo.2012.06.017.
- Dal Canto M, Coticchio G, Mignini Renzini M, De Ponti E, Novara PV, Brambillasca F, Comi R, Fadini R. 2012. Cleavage kinetics analysis of human embryos predicts development to blastocyst and implantation. Reprod Biomed Online. 25(5):474–480. doi:10.1016/j.rbmo.2012.07.016.
- De Geyter C, Calhaz-Jorge C, Kupka MS, Wyns C, Mocanu E, Motrenko T, Scaravelli G, Smeenk J, Vidakovic S, Goossens V, et al. 2018. ART in Europe, 2014: results generated from European registries by ESHREThe European IVF-monitoring Consortium (EIM) for the European Society of Human Reproduction and Embryology (ESHRE). Hum Reprod. 33(9):1586–1601.
- de Ziegler D, Pirtea P, Andersen CY, Ayoubi JM. 2018. Role of gonadotropin-releasing hormone agonists, human chorionic gonadotropin (hCG), progesterone, and estrogen in luteal phase support after hCG triggering, and when in pregnancy hormonal support can be stopped. Fertil Steril. 109(5):749–755. doi:10.1016/j.fertnstert.2018.03.006.
- Dessolle L, Fréour T, Ravel C, Jean M, Colombel A, Daraï E, Barrière P. 2011. Predictive factors of healthy term birth after single blastocyst transfer. Hum Reprod. 26(5):1220–1226. doi:10.1093/humrep/der039.
- Fishel S, Baker D, Elson J, Ragunath M, Atkinson G, Shaker A, Omar A, Kazem R, Beccles A, Greer IA. 2016. Precision medicine in assisted conception: a multicenter observational treatment cohort study of the annexin A5 M2 haplotype as a biomarker for antithrombotic treatment to improve pregnancy outcome. EBioMedicine. 10:298–304. doi:10.1016/j.ebiom.2016.06.024.
- Fishel S, Campbell A, Montgomery S, Smith R, Nice L, Duffy S, Jenner L, Berrisford K, Kellam L, Smith R, et al. 2017. Live births after embryo selection using morphokinetics versus conventional morphology: a retrospective analysis. Reprod Biomed Online. 35(4):407–416.
- Freour T, Basile N, Barriere P, Meseguer M. 2015. Systematic review on clinical outcomes following selection of human preimplantation embryos with time-lapse monitoring. Hum Reprod Update. 21(1):153–154. doi:10.1093/humupd/dmu054.
- Gardner DK, Schoolcraft WB. 1999. Culture and transfer of human blastocysts. Curr Opin Obstet Gyn. 11(3):307–311. doi:10.1097/00001703-199906000-00013.
- Goodman LR, Goldberg J, Falcone T, Austin C, Desai N. 2016. Does the addition of time-lapse morphokinetics in the selection of embryos for transfer improve pregnancy rates? A randomized controlled trial. Fertil Steril. 105(2):275–285.e10. doi:10.1016/j.fertnstert.2015.10.013.
- Guido C, Perrotta I, Panza S, Middea E, Avena P, Santoro M, Marsico S, Imbrogno P, Andò S, Aquila S. 2011. Human sperm physiology: estrogen receptor alpha (ERα) and estrogen receptor beta (ERβ) influence sperm metabolism and may be involved in the pathophysiology of varicocele-associated male infertility. J Cell Physiol. 226(12):3403–3412. doi:10.1002/jcp.22703.
- Hashimoto S, Kato N, Saeki K, Morimoto Y. 2012. Selection of high-potential embryos by culture in poly(dimethylsiloxane) microwells and time-lapse imaging. Fertil Steril. 97(2):332–337. doi:10.1016/j.fertnstert.2011.11.042.
- Herrero J, Tejera A, Albert C, Vidal C, de Los Santos MJ, Meseguer M. 2013. A time to look back: analysis of morphokinetic characteristics of human embryo development. Fertil Steril. 100(6):1602–1609.e1–4. doi:10.1016/j.fertnstert.2013.08.033.
- Kaser DJ, Bormann CL, Missmer SA, Farland LV, Ginsburg ES, Racowsky C. 2017. A pilot randomized controlled trial of Day 3 single embryo transfer with adjunctive time-lapse selection versus Day 5 single embryo transfer with or without adjunctive time-lapse selection. Hum Reprod. 32(8):1598–1603. doi:10.1093/humrep/dex231.
- Khosravi P, Kazemi E, Zhan Q, Malmsten JE, Toschi M, Zisimopoulos P, Sigaras A, Lavery S, Cooper LAD, Hickman C, et al. 2019. Deep learning enables robust assessment and selection of human blastocysts after in vitro fertilization. NPJ Digit Med. 2:21. doi:10.1038/s41746-019-0096-y.
- Kupka MS, Ferraretti AP, de Mouzon J, Erb K, D’Hooghe T, Castilla JA, Calhaz-Jorge C, De Geyter C, Goossens V, European IVF-Monitoring Consortium, for the European Society of Human Reproduction and Embryology. 2014. Assisted reproductive technology in Europe, 2010: results generated from European registers by ESHRE†. Hum Reprod. 29(10):2099–2113. doi:10.1093/humrep/deu175.
- Liu Y, Chapple V, Feenan K, Roberts P, Matson P. 2016. Time-lapse deselection model for human day 3 in vitro fertilization embryos: the combination of qualitative and quantitative measures of embryo growth. Fertil Steril. 105(3):656–662.e1. doi:10.1016/j.fertnstert.2015.11.003.
- Manna C, Nanni L, Lumini A, Pappalardo S. 2013. Artificial intelligence techniques for embryo and oocyte classification. Reprod Biomed Online. 26(1):42–49. doi:10.1016/j.rbmo.2012.09.015.
- Matos FD, Rocha JC, Nogueira MFG. 2014. A method using artificial neural networks to morphologically assess mouse blastocyst quality. J Anim Sci. 56(1):15. doi:10.1186/2055-0391-56-15.
- Mizobe Y, Oya N, Iwakiri R, Yoshida N, Sato Y, Miyoshi K, Tokunaga M, Ezono Y. 2016. Effects of early cleavage patterns of human embryos on subsequent in vitro development and implantation. Fertil Steril. 106(2):348–353.e2.
- Motato Y, de Los Santos MJ, Escriba MJ, Ruiz BA, Remohí J, Meseguer M. 2016. Morphokinetic analysis and embryonic prediction for blastocyst formation through an integrated time-lapse system. Fertil Steril. 105(2):376–384.e9. doi:10.1016/j.fertnstert.2015.11.001.
- Pandian Z, Marjoribanks J, Ozturk O, Serour G, Bhattacharya S. 2013. Number of embryos for transfer following in vitro fertilisation or intra-cytoplasmic sperm injection. Cochrane Database Syst Rev. 7:CD003416.
- Petersen BM, Boel M, Montag M, Gardner DK. 2016. Development of a generally applicable morphokinetic algorithm capable of predicting the implantation potential of embryos transferred on Day 3. Hum Reprod. 31(10):2231–2244. doi:10.1093/humrep/dew188.
- Pinborg A. 2005. IVF/ICSI twin pregnancies: risks and prevention. Hum Reprod Update. 11(6):575–593.
- Pinheiro J, Bates D, DebRoy S, Sarkar D, R Core Team. 2018. nlme: linear and nonlinear mixed effects models [Internet]. place unknown. https://CRAN.R-project.org/package=nlme.
- Poulsen V, Ingerslev HJ, Kirkegaard K. 2017. Elective embryo transfers on Day 6 reduce implantation compared with transfers on Day 5. Hum Reprod. 32(6):1238–1243. doi:10.1093/humrep/dex059.
- R Core Team. 2014. R: a language and environment for statistical computing [Internet]. Vienna (Austria): R Foundation for Statistical Computing. http://www.R-project.org/.
- Sing T, Sander O, Beerenwinkel N, Lengauer T. 2005. ROCR: visualizing classifier performance in R. Bioinformatics. 21(20):7881. doi:10.1093/bioinformatics/bti623.
- Siristatidis C, Komitopoulou MA, Makris A, Sialakouma A, Botzaki M, Mastorakos G, Salamalekis G, Bettocchi S, Palmer GA. 2015. Morphokinetic parameters of early embryo development via time lapse monitoring and their effect on embryo selection and ICSI outcomes: a prospective cohort study. J Assist Reprod Genet. 32(4):563–570. doi:10.1007/s10815-015-0436-z.
- Stolwijk AM, Wetzels AM, Braat DD. 2000. Cumulative probability of achieving an ongoing pregnancy after in-vitro fertilization and intracytoplasmic sperm injection according to a woman’s age, subfertility diagnosis and primary or secondary subfertility. Hum Reprod. 15(1):203–209. doi:10.1093/humrep/15.1.203.
- Stone BA, March CM, Ringler GE, Baek KJ, Marrs RP. 2014. Casting for determinants of blastocyst yield and of rates of implantation and of pregnancy after blastocyst transfers. Fertil Steril. 102(4):1055–1064. doi:10.1016/j.fertnstert.2014.06.049.
- Tran D, Cooke S, Illingworth PJ, Gardner DK. 2019. Deep learning as a predictive tool for fetal heart pregnancy following time-lapse incubation and blastocyst transfer. Hum Reprod. 34(6):1011–1018. doi:10.1093/humrep/dez064.
- Uyar A, Bener A, Ciray HN. 2015. Predictive modeling of implantation outcome in an in vitro fertilization setting: an application of machine learning methods. Med Decis Mak. 35(6):714–725. doi:10.1177/0272989X14535984.
- Vogiatzi P, Pouliakis A, Siristatidis C. 2019. An artificial neural network for the prediction of assisted reproduction outcome. J Assist Reprod Genet. 36(7):1441–1448. doi:10.1007/s10815-019-01498-7.
- Wickham H. 2016. ggplot2: elegant graphics for data analysis [Internet]. place unknown: Springer-Verlag New York. http://ggplot2.org.
- Wong CC, Loewke KE, Bossert NL, Behr B, De Jonge CJ, Baer TM, Reijo Pera RA. 2010. Non-invasive imaging of human embryos before embryonic genome activation predicts development to the blastocyst stage. Nat Biotechnol. 28(10):1115–1121. doi:10.1038/nbt.1686.
- World Health Organization, editor. 2010. WHO laboratory manual for the examination and processing of human semen. 5th ed. Geneva: World Health Organization.
- Yang ST, Shi JX, Gong F, Zhang SP, Lu CF, Tan K, Leng LZ, Hao M, He H, Gu YF, et al. 2015. Cleavage pattern predicts developmental potential of day 3 human embryos produced by IVF. Reprod Biomed Online. 30(6):625–634. doi:10.1016/j.rbmo.2015.02.008.
- Zaninovic N, Nohales M, Zhan Q, de Los Santos ZMJ, Sierra J, Rosenwaks Z, Meseguer M. 2019. A comparison of morphokinetic markers predicting blastocyst formation and implantation potential from two large clinical data sets. J Assist Reprod Genet. 36(4):637–646. doi:10.1007/s10815-018-1396-x.