
ABSTRACT
Anti-Mullerian hormone (AMH) is expressed by the granulosa cells of the pre-antral and small antral follicles in the ovary. AMH serum levels are significantly higher in women with polycystic ovary syndrome (PCOS) due to an increased antral follicle counts (AFC) and a higher production of AMH per antral follicle. This research is a cohort study design with a sample size of 60 female patients with (n = 30) and without PCOS (n = 30) in which the relationship between AMH serum level and other hormonal markers was explored. The following measurements were taken from the patients on the fifth day of the menstrual cycle: AMH, glucose, index of insulin resistance (HOMA/IR), body mass index (BMI), testosterone and cholesterol, lipoproteins, and triglycerides. The study proposes diagnostic criteria for PCOS. A twofold increase in the AMH serum levels was observed in the PCOS group when compared to the control group. The following incremental increases were seen in AMH serum levels: testosterone (18.4%); fasting blood glucose (18%); fasting insulin (83.86%); HOMA/IR (64.23%); mean cholesterol (30%); mean triglycerides (17%); and BMI (26.75%). All differences were considered significant at p ˂ 0.005. The results from the study concluded that monitoring the level of AMH allows for the prediction of ovarian hyperstimulation syndrome (OHSS) during ovulation induction and assisted reproductive technology cycles. Monitoring of anti-Mullerian hormone levels may provide an additional marker for determining treatment strategies when presented with additional risks associated with overweight, hirsutism, type II diabetes, infertility, and cardiovascular disease.
Introduction
Anti-Mullerian Hormone (AMH) regulates the folliculogenesis and prevents the premature egg production (Bhide and Homburg Citation2016). Some experts evaluate ovarian reserve by measuring the level of AMH in the body. It is likely that in the future, ovarian reserve and follicle count will be analyzed specifically by examining the AMH serum levels. Among other factors involved, the follicle-stimulating hormone (FSH) and AMH regulate follicular growth in the body (Dewailly et al. Citation2016). This is a double-triangle model that promotes the hypothesis that the secretion of AMH may be FSH-dependent until E2 (estradiol) is synthesized in the body. However, this hypothesis has not yet been confirmed. This model is applicable to both normal and excessive follicular growth, which may be observed in PCOS (polycystic ovary syndrome). Consequently, abnormalities of folliculogenesis seen in PCOS may be caused by an exaggeration of a physiological process, rather than aberration. However, the elevated levels of AMH can inhibit the formation of primary follicles and egg maturation, which is an integral component of PCOS. In one particular case, at least 12 primordial follicles were found in the ovary. One way to diagnose PCOS is by measuring AMH levels; but this method may have its limitations, as the concentration of AMH tends to decrease with age, as shown in a study by Lie Fong et al. The findings from the study allowed the authors to demonstrate that polycystic ovarian morphology (PCOM) can happen in both younger and older women, suggesting that isolated PCOM does not correspond to the upper limit of follicle count in regularly cycling young women. Older women (≥40 [n = 444]) had significantly lower AMH levels compared to women who were <35 years of age [n = 64], with the adjusted median of 0.73 ng/ml vs 2.52 ng/ml in (Jung et al. Citation2017). The AMH concentrations were significantly lower in young women at menarche (<12-year old [n = 96] vs ≥14-year old [n = 200]: 0.90 ng/ml vs. 1.12 ng/ml) and in women who used oral contraceptives when compared to those who never used them ([n = 27] vs [n = 468]: 0.36 ng/ml vs 1.15 ng/ml). Variables such as race, body mass index (BMI), education, height, smoking status, parity, and the menstrual phase did not significantly correlate with the AMH level. There were also no significant associations found between AMH level and androgen level, between AMH level and concentration of sex hormone-binding globulin, or between AMH level and blood collection factors (e.g., sample, time, season, and year).
In another study (Sir-Petermann et al. Citation2006), serum concentrations of AMH were significantly higher in the PCOS group compared to the control group during early infancy (20.4 ± 15.6 vs. 9.16 ± 8.6 pmol/liter; P = 0.024) and childhood (14.8 ± 7.7 vs. 9.61 ± 4.4 pmol/liter; P = 0.007). The concentrations of gonadotropin and serum sex steroids were similar in both groups during the two study periods. This was not the case for FSH, which was lower in prepubertal daughters of PCOS women, suggesting that these girls have shown evidence of altered follicular development during infancy and childhood. As the ovarian reserve decreases, the level of AMH drops spontaneously. In some cases, such a trend contributes to spontaneous restoration of fertility in the late reproductive age. Cases like these are often found in the medical practice literature (Du et al. Citation2016). The diagnostic criteria for PCOS have been grouped in various classifications that have been conflicting for many years. The Rotterdam criteria are the most widely used today. Although its underlying principle (two criteria required out of three) is still valid, each of its three items (oligo-anovulation (OA), hyperandrogenism (HA), and PCOM) needs to be updated (Homburg et al. Citation2013). According to many authors, the diagnosis of PCOS using the Rotterdam criteria should always be a diagnosis of exclusion (Giampaolino et al. Citation2018; Jensterle Sever et al. Citation2019). The definition of biological HA and its connection with PCOS still needs to be explored (Afifi et al. Citation2011). The primary goal of androgenic assays should be to exclude other states of HA, even though hirsutism is not always seen in PCOS or the metabolic syndrome. The criteria used to define OA are considered to be insufficient. The definition of PCOM proposed in 2003 is now obsolete when using the latest generation of ultrasound machines. The AMH assay seems to be an increasingly excellent substitute for follicular count and is likely to emerge as the official PCOM marker (Tata et al. Citation2018). Monitoring AMH fluctuations is advisable when planning for in-vitro fertilization (IVF) (Lujan et al. Citation2008) because a constantly high level of AMH (˃14.24 ng/ml) may increase the risk of ovarian hyperstimulation syndrome (OHSS). In a study assessing the relationship between the serum level of AMH and other hormonal markers through IVF, the cutoff point for AMH level was 4.8 ng/ml (according to presence or absence of pregnancy) but this was not statistically significant (P = 0.655). In PCOS patients with an AMH level ˃2.7 ng/ml, the number of oocytes that were recovered (six or more) was higher than in the group with higher AMH concentrations (Aleyasin et al. Citation2011). Whereas the place of AMH as a diagnostic aid for PCOS has yet to be settled, the role of AMH in the pathophysiology of this enigmatic syndrome is a challenge for further research (Homburg et al. Citation2013). The inverse relationship between AMH and FSH serum concentrations adds an intriguing facet to the puzzle while the positive correlation of AMH with LH has been confirmed.
The most common methods for the treatment and prevention of PCOS are BMI correction, exposure to the corrective influence on carbohydrate and lipid metabolism, moderate physical and aerobic exercises, and the use of metformin hydrochloride and spironolactone solutions, to normalize the HOMA index and reduce the effect of androgens on the body (Wei and Ren Citation2018).
Other authors do not indicate whether the elevated AMH level is a primary cause or a result of PCOS. The previous studies define the isolated PCOM neither as an independent factor nor as a residual PCOS phenotype. The likelihood of constantly present subclinical defects in women of all ages who have PCOS was not discussed either.
This study identified the long-term health risks associated with polycystic ovaries. The paper aimed to establish the correlation between the levels of hormonal markers and AMH concentration in order to identify potential metabolic and cardiovascular risks that emerge with an increase in AMH level. With this knowledge, an appropriate PCOS treatment can be established.
Results
The results are shown in tables and figures as follows. shows statistically significant differences between the control and PCOS groups with respect to various measurements.
Table 1. Clinical, biochemical, hormonal, and ultrasound characteristics of both groups expressed as means ± SD=4.47
As it can be seen, there is a significant increase in hormonal levels, ovarian volume, and HOMA/IR in the PCOS group. Furthermore, there is a significant drop in HDL levels. AMH levels in the PCOS group were highest in women who had an android body type and increased body fat. Note that AMH levels in the PCOS group were almost 3 times higher than those in the control group. In the control group, women over 38 years of age had a very low level of AMH (<0.7 ng/ml), while in most patients with PCOS of the same age, it was significantly higher and amounted to 1.4–7.8 ng/ml. The above results conclude that patients with PCOS have a high risk for cardiovascular and endocrinological disorders.
shows the correlation between serum AMH levels and other factors in the PCOS group. As it turns out, the serum AMH level positively correlated with the AFC and OV. A slight correlation (р˃0.005, r < 0.7) was noted between AMH and other factors involved.
Table 2. Correlation between AMH levels and hormonal markers in PCOS group
Data in show that AMH level has the strongest associations with AFC and OV. Therefore, a twofold elevation of the serum AMH level is indicative of the PCOS syndrome. A significant age-dependent decrease in AMH levels in the PCOS and control groups was observed, although, in the PCOS group, it always remained higher than in the control one. In patients of the control group over 35 years, the level of AMH was very low, while in patients with PCOS, it remained quite high in most cases. Also, the correlation between AMH and patient’s age was found to be very low.
demonstrates a significant positive correlation between AMH and parameters such as testosterone, HOMA/IR, BMI, cholesterol, HDL (p = 0.000), and TG in both groups. This shows significant divergence within groups.
Table 3. Correlation between AMH, testosterone, HOMA/IR, BMI, cholesterol, HDL, and TG in both groups
Increased androgen secretion is one of the signs of PCOS, and AMH levels positively correlated with the androgen level. However, a negative correlation between the levels of AMH and FSH was observed in the control group, in contrast to patients with PCOS. In terms of age, a negative correlation of AMH levels was noted in patients of both groups. No correlation between the level of AMH and estradiol, as well as AMH and LH, was revealed in both groups. Elevated AMH levels in women with PCOS may be due to the increased number of small follicles responsible for AMH secretion. The negative correlation between AMH and FSH levels in healthy women and its absence in patients with PCOS can be attributed to the elevated FSH levels in late reproductive age and high or variable AMH levels in women with PCOS.
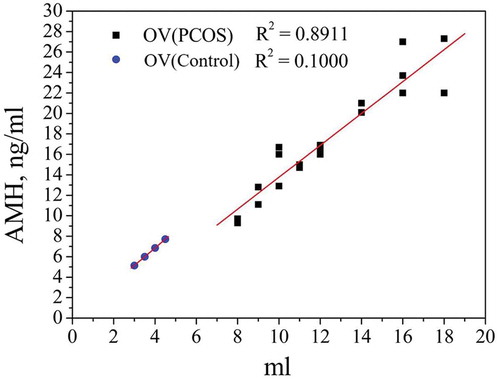
provides evidence of a significant positive correlation between AMH and ovarian parameters, such as AFC and OV (p = 0.0001) in both groups. This confirms the results depicted in .
Table 4. Correlation between AMH, AFC, and OV in both groups
shows a significant positive correlation between AMH and AFC in the PCOS. In patients with PCOS, a positive correlation between the level of AMH and AFC was revealed during ultrasound examination and amounted to (R2 = 0.8911, p < 0.001) in PCOS group and (R2 = 0.8981, p < 0.001) in the control one.
Figure 1. Correlation between AMH and AFC in the PCOS and control groups. The AMH serum concentration depends on AFC. In healthy women, AFC was less than 12. In the control group, AMH was equal to 4.3 ± 0.5. Results from the control group are marked with ▲. The coefficient of determinationR2 was equal to 0.8981. In women with PCOS, AFC was more than 12 and AMH was equal to 12.90 ± 3.3. Results from the PCOS group are marked with ●. The coefficient of determination R2 was 0.8911
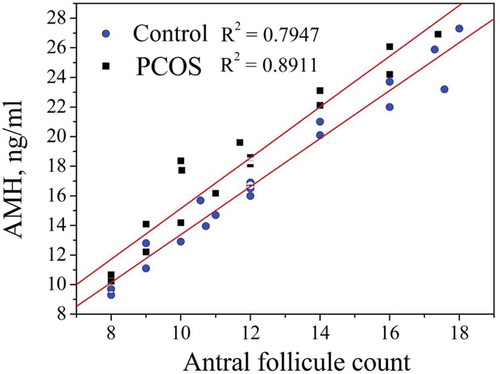
shows a significant positive correlation between AMH and OV in the PCOS (R2 = 0.8911, p < 0.001) and control (R2 = 0.9662, p < 0.001) groups.
Figure 2. Correlation between AMH and OV in the PCOS and control groups. Ovarian volume is affected by AFC and ovarian cysts. Results from the control group are marked with ▲. The coefficient of determination R2 was 0.9662. Results from the PCOS group are marked with ●. The coefficient of determination R2 was 0.8911
It is noted that in women with PCOS, the menstrual cycle normalizes with age, probably due to the gradual loss of follicles. The relatively high level of AMH in women with PCOS in the older group (over 35 years) indicates that the follicles, and hence fertility, may remain on the same level in women with PCOS.
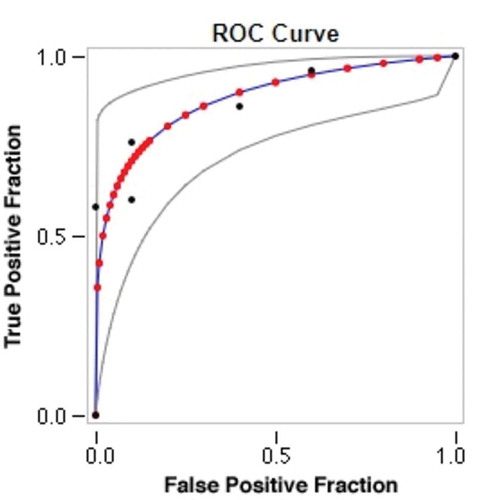
shows an area under the receiver operating characteristic curve for AMH that was equal to one. The AMH cutoff value for diagnosing PCOS was 5.80, with 100% sensitivity and 100% specificity.
Figure 3. Receiver operating characteristic (ROC) curve for AMH levels. Data were collected in six categories with category 6 representing the strongest evidence of positivity. Number of actually negative cases = 10. Number of actually positive cases = 50. Red symbols and blue line represent the fitted ROC curve. GRAY lines = 95% confidence interval of the fitted ROC curve. Black symbols represent points making up the empirical ROC curve. Summary statistics: Number of cases: 60; Number of correct cases: 47; Accuracy: 78.3%; Sensitivity: 76%; Specificity: 90%; Positive cases missed: 12; Negative cases missed: 1; Fitted ROC Area: 0.882; Empiric ROC Area: 0.876
presents an ultrasound image of polycystic ovaries.
Figure 4. Ultrasound image of the ovaries in patients of the control group and in PCOS patients
As seen in the above figure, patients in the PCOS group had enlarged ovaries with many cysts. This clinical picture is typical for PCOS. The ovarian volume in women in the PCOS group was found to be more than 7 cm3, and cysts with a diameter of 2–8 mm were found along the periphery of both ovaries (˃10 in each).
Discussion
Polycystic ovary syndrome is a set of symptoms related to a hormonal imbalance that can range from mild to severe and it has reproductive, endocrine, and metabolic implications (Nieschlag and Vorona Citation2015). PCOS is one of the leading causes for female subfertility and the most common endocrine disorder among women of reproductive age. Despite many decades of extensive research, the exact etiology and pathogenesis of this complex disorder remain hidden. AMH is a promising marker for this condition, as its concentration is stable throughout the menstrual cycle and is not affected by fluctuations of other reproductive hormones (Nieschlag and Vorona Citation2015; Abdelazim et al. Citation2020).
Although AMH serum levels are used as a predictive marker of ovarian response during IVF, there are conflicting reports of its predictive value for folliculogenesis in ovulation induction with clomiphene citrate (Nieschlag and Vorona Citation2015). Measuring AMH levels allows for the further investigation of PCOS and its clinical implications. By addressing AMH values in the present study, it was determined that they could distinguish between PCOM and PCOS as separate entities, adding strength to the notion that PCOM is a precursor to PCOS and suggest that PCOM is not merely a normal variation of ovarian morphology.
The aim of this study was to examine the relationship between AMH serum levels, AFC, and OV in healthy women compared to women with PCOS. The study has the following limitations. First, it is restricted to patients aged between 27 and 40 years. Older women (40–45 years) can be pseudo-positive for ovarian cysts, whilst women under 27 are at risk of being suspected with PCOS when the ultrasound reports are negative due to elevated AMH levels. Second, the study did not study the role of visceral and SC lipids in the metabolism of sex hormones. This issue will be addressed in future research.
The results show that fasting blood glucose is significantly higher in the PCOS group (5.98 ± 2.1 mmol/L) than in the control group (5.05 ± 0.99 mmol/L). The FI levels are significantly higher as well (22.1 ± 5.1 μU/mL vs 12.02 ± 2.44 μU/mL).
This study confirmed that HOMA/IR is significantly higher in the PCOS group (6.1 ± 2.49) compared to that in the control group (2.4 ± 0.5). There was a significant positive correlation between HOMA/IR and cholesterol level. This result was consistent with other studies that had previously shown a significant correlation between HOMA-IR and variables such as TG, LDL cholesterol, and HDL (Jung et al. Citation2017). In this study, the HOMA/IR cutoff value was ≥3.22 with 87.3% sensitivity and 87.3% specificity, which turned out to be consistent with the recent research (Jung et al. Citation2017). The Ferriman–Gallwey score was significantly higher in the PCOS group (26.49 ± 3.6 vs 7.73 ± 1.66), with a cutoff value of ≥15.7 at 100% sensitivity and 100% specificity. Some authors (Nieschlag and Vorona Citation2015; Jung et al. Citation2017) conducted an extensive review of publications in which they reported a cutoff point for mFG of ≥11 for indigenous women in China (Jung et al. Citation2017). Androgenic disorders may be present with normal body hair; therefore, the absence of hirsutism does not exclude consideration of PCOS with other symptoms of androgen excess such as the presence of acne, alopecia, infertility, or menstrual dysfunction (Jung et al. Citation2017).
The mean cholesterol level was significantly higher in the PCOS group (218 ± 20 mg/dl vs 167.7 ± 17.19 mg/dl). There was a significant increase in the mean triglyceride level in women with PCOS (99.6 ± 10 mg/dl) when compared to healthy controls (85.00 ± 9 mg/dl). In this study, the PCOS group had a significantly lower mean concentration of HDL (39.45 ± 7.25 mg/dl vs 55.80 ± 4.53 mg/dl), which indicated a high risk of developing metabolic syndrome. This result was consistent with a previous study, which claimed that low HDL cholesterol was a criterion for explaining the high prevalence of the metabolic syndrome in PCOS subjects which, in turn, was influenced by hyperinsulinemia, rather than hyperandrogenemia (Gambineri et al. Citation2002). In the current study, a significant increase in BMI was observed in patients with PCOS (34.78 ± 3.43 kg/m2) when compared to controls (27.44 ± 1.73 kg/m2). A direct correlation was observed between serum AMH levels and other parameters in the subjects under study.
It was also found that exercising decreased the level of AMH in overweight women with PCOS. These findings were consistent with other publications (Sahmay et al. Citation2012).
In this study, the AMH serum concentrations in women with PCOS (12.90 ± 3.3 ng/ml) were significantly higher when compared to controls (4.3 ± 0.5 ng/ml). This is in line with data in the research by Dewailly et al. (Citation2016). The authors found that elevated AMH (>4.5 ng/ml) may be useful as an alternative to PCOM in the case where ultrasound findings are not conclusive (Balen et al. Citation1995). In this study, the mean AMH level was 2.72-fold higher in patients with PCOS as compared to healthy controls. This was consistent with data from previous researchers, who reported two- to threefold higher serum AMH levels in women with PCOS as compared to ovulatory women (Lujan et al. Citation2008), which corresponds to an increase in the number of small follicles seen in PCOS. Normally, AMH serum concentrations in patients with PCOS are higher than in ‘normal’ women (Li et al. Citation2010). The present study shows that a diagnostic cutoff value of AMH serum level for PCOS is 5.8 ng/ml, yielding a sensitivity of 100% and specificity of 100%. In contrast, Lin et al. (Citation2011) reported an AMH cutoff value of 7.3 ng/ml (specificity, 76%; sensitivity, 70%). In addition, the measurement of a serum AMH level can be used as an indicator of the PCOS patient’s response to therapeutic approaches, including evaluation after treatment with insulin sensitizers and monitoring after laparoscopic ovarian resection.
In this study, the mean number of follicles (26.6 ± 6) in both ovaries was significantly higher in the PCOS group than in the control group (9 ± 2). This data is in line with another study (Lie Fong et al. Citation2017), which confirmed an AFC threshold of ≥12 for Chinese women. The 2003 Rotterdam consensus, the most common ultrasound definition employed to date, was based on Balen’s study and expert agreement (Balen et al. Citation2003). Many authors found that polycystic ovaries on transvaginal ultrasound are characterized by the presence of ≥12 follicles measuring 2–9 mm in diameter (mean of both ovaries) (Lin et al. Citation2011).
The ovarian volume in the PCOS group was significantly higher than in the control group (11.56 ± 3.1 cm3 vs 6.23 ± 0.73 cm3). In addition, there was a significant correlation between AMH and OV (r = 0.853, p < 0.0001). Without contradicting the present results, other researchers have demonstrated that AMH has a statistically significant positive correlation with OV (r = 0.623, P < 0.01) (Jung et al. Citation2017). In a recent study, OV showed the strongest positive correlation (r = 0.62) with the serum AMH level among related factors (Lie Fong et al. Citation2017). There was also a significant correlation with AFC (r = 0.861, P < 0.0001). The AMH/AFC ratio, which indicates the concentration of AMH per follicle, was 0.46 in the PCOS group and 0.48 in the control group. Therefore, it can be concluded that the number of follicles depends on the serum AMH level. Here, a significant correlation was observed between serum AMH levels and variations in testosterone, AFC, and OV on the ultrasound (Nteeba et al. Citation2014). The significant correlation between AMH and AFC values among PCOS patients was in line with the results obtained by other researchers (Lin et al. Citation2011). Accordingly they propose that AMH levels can be used to replace the number of follicles as a diagnostic criterion if the ultrasound cannot provide an accurate measure.
Material and methods
Patients
The case–control study consisted of 30 healthy, regularly cycling middle-age women with normal ultrasound findings (control group) and 30 female patients with PCOS (OA + HA + PCOM phenotypes). The study was conducted at the Beijing Maternal and Child Health Care Hospital in 2019, during the period from February to September. All participants gave written informed consent before participating in the study. Oligo-anovulation (OA) was defined as self-reported menstrual cycles of ≥36 days or <10 cycles a year.
Diagnostic methods
Clinical hyperandrogenism (HA) was diagnosed by scoring the presence of terminal hairs over nine body areas on a scale from 0 to 4 using the Ferriman–Gallwey scoring system. Normally, hirsutism is characterized as mild within scores that are up to 15, moderate from 16 to 25, and severe as anything above 25. Biochemical HA was determined at the serum testosterone level of >2.5 nmol/L (Youssef and Marei Citation2019). The selection of the control group was carried out using the ultrasound method. Subjects, who had undergone previous ovarian surgery, received cytotoxic drugs or pelvic irradiation, had undergone 3 months of hormone therapy before the study, or had another endocrinological disorder were excluded from the study. The diagnosis of PCOS was based on two of three Rotterdam criteria: (1) irregular menstrual cycles or OA (≥35 days); (2) HA, clinical (the acne presence of acne or hirsutism) or biochemical manifestations (increase in the level of at least one circulating ovarian androgen); and (3) polycystic ovaries (PCOs) on ultrasound (Youssef and Marei Citation2019). The existing Rotterdam guidelines define PCOM as the presence of at least 12 follicles in the ovary measuring 2–9 mm in diameter or increased ovarian volume (>10 mL) (Stolorz et al. Citation2016). The multifollicular ovarian (MFO) size threshold should be adapted to the ultrasound machine that is used (Somunkiran et al. Citation2007). Both groups underwent the following procedures: complete anamnesis; clinical examination (to gather relevant data such as the extent and degree of the hirsutism, weight, and height); and ultrasonography. Antral follicle count (AFC) and ovarian volume (OV) were assessed using General Electric Logiq Book XP with vaginal probe 7.5 MHz (General Electric Medical Systems, Solingen, Germany). Ovary size was measured in three dimensions, and the ovary volume was subsequently calculated using the formula: height × width × depth × 0.5. All visible follicles of 2–9 mm in diameter in both ovaries were included in the AFC. All ultrasound examinations were performed by the same investigator.
Laboratory methods
Blood samples were taken with a syringe; the serum was separated by centrifugation after coagulation, placed in aliquots, and stored at – 20°C until analysis. Hormonal levels were measured in both groups during the follicular phase.
It was not always possible to measure the levels of all hormonal markers in irregularly cycling subjects but the AMH concentrations did not change significantly during the menstrual cycle (Hadlow et al. Citation2013). Hence, the AMH serum concentrations were estimated using an ELISA kit (MBS 702,605, MyBioSource Company, USA). Testosterone levels were measured by a competitive binding assay using a Beckman Coulter UniCel DXI 800 analyzer (Beckman Coulter Diagnostics Australia, Gladesville, Australia). Fasting plasma glucose (FPG) and fasting insulin (FI), cholesterol, high-density lipoprotein (HDL) cholesterol, and triglycerides (TG) were measured using the enzymatic colorimetric assay method (BIOLABO REAGENTS SA 02160, Maizy, France). FPG and FI were determined for the homeostatic model assessment of insulin resistance (HOMA-IR) (Antunes et al. Citation2016). The HOMA-IR was calculated as [fasting serum insulin (μU/mL) × fasting blood glucose (mmol/L)/22.5] (Ansari et al. Citation2018).
Statistical analysis
The results were presented as means ± standard deviations (SD) (Hyvlud et al. Citation2019). To assess statistical significance, AUC (Area under the Curve) ROC (Receiver Operating Characteristics) analysis was performed using a web-based calculator for ROC curves. The coefficient of determination R2 value was found by constructing a trend line. The acceptable cutoff value was considered to be R2 ≥ 0.8. Differences between the PCOS and control groups were determined through an independent test (Bain and Englehardt Citation2017). Differences were considered significant at p ˂ 0.005. The connections between variables were estimated using the two-sided Pearson correlation coefficient (r) (Xu and Deng Citation2017). Statistical data processing was performed using SPSS 20.0 statistical software (SPSS Inc, version 20.0, Chicago, Illinois, USA), Microsoft Excel, and Statistica.
Ethics approval
All procedures were performed in accordance with the ethical standards of the hospital and were approved by the ethics committee of the National Center for Radiation Research and Technology. The study was conducted under the ethical principles approved by the Human Experiments Ethics Committee of Hainan Medical University (Protocol No. 2 of 28.01.2019).
Author contributions
Contributed equally to the experimentation: HF, YL, XD, LW; wrote and edited the article: HF, XD; equally designed and conducted the experiment: YL, LW; studied scientific literature about the topic: HF, YL. All authors read and approved the final manuscript.
Abbreviations
Disclosure statement
The authors claim no conflict of interest.
Data availability
Data will be available on request.
Additional information
Funding
References
- Abdelazim IA, Bekmukhambetov Y, Aringazina R, Shikanova S, Amer OO, Zhurabekova G, Otessin MA, Astrakhanov AR. 2020. The outcome of hypertensive disorders with pregnancy. J Fam Med Prim Care. 9(3):1678. doi:10.4103/jfmpc.jfmpc_1054_19.
- Afifi L, Saeed L, Pasch LA, Huddleston HG, Cedars MI, Zane LT, Shinkai K. 2011. Association of ethnicity, Fitzpatrick skin type, and hirsutism: A retrospective cross-sectional study of women with polycystic ovarian syndrome. Int J Women’s Dermatol. 3(1):37–43. doi:10.1016/j.ijwd.2017.01.006.
- Aleyasin A, Aghahoseini M, Mokhtar S, Fallahi P. 2011. Anti-Mullerian hormone as a predictive factor in assisted reproductive technique of polycystic ovary syndrome patients. Acta Medica Iran. 49(11):715–720.
- Ansari AM, Bhat KG, Dsa SS, Mahalingam S, Joseph N. 2018. Study of insulin resistance in patients with β thalassemia major and validity of triglyceride glucose (TYG) index. J Ped Hematol Oncol. 40(2):128–131. doi:10.1097/MPH.0000000000001011.
- Antunes LC, Elkfury JL, Jornada MN, Foletto KC, Bertoluci MC. 2016. Validation of HOMA-IR in a model of insulin-resistance induced by a high-fat diet in Wistar rats. Arch Endocr Metab. 60(2):138–142. doi:10.1590/2359-3997000000169.
- Bain L, Englehardt M. 2017. Statistical analysis of reliability and life-testing models: theory and methods. Abingdon: Routledge.
- Balen AH, Conway GS, Kaltsas G, Techatraisak K, Manning PJ, West C, Jacobs HS. 1995. Andrology: polycystic ovary syndrome: the spectrum of the disorder in 1741 patients. Hum Reprod. 10(8):2107–2111. doi:10.1093/oxfordjournals.humrep.a136243.
- Balen AH, Laven JS, Tan SL, Dewailly D. 2003. Ultrasound assessment of the polycystic ovary: international consensus definitions. Hum Reprod Upd. 9(6):505–514. doi:10.1093/humupd/dmg044.
- Bhide P, Homburg R. 2016. Anti-Müllerian hormone and polycystic ovary syndrome. Best Pract Res Clin Obstet Gynecol. 37:38–45. doi:10.1016/j.bpobgyn.2016.03.004.
- Dewailly D, Robin G, Peigne M, Decanter C, Pigny P, Catteau-Jonard S. 2016. Interactions between androgens, FSH, anti-Müllerian hormone and estradiol during folliculogenesis in the human normal and polycystic ovary. Hum Reprod Upd. 22(6):709–724. doi:10.1093/humupd/dmw027.
- Du X, Ding T, Zhang H, Zhang C, Ma W, Zhong Y, Qu W, Zheng J, Liu Y, Li Z, et al. 2016. Age-specific normal reference range for serum anti-müllerian hormone in healthy Chinese Han women: a nationwide population-based study. Reprod Sci. 23(8):1019–1027. doi:10.1177/1933719115625843
- Gambineri A, Pelusi C, Vicennati V, Pagotto U, Pasquali R. 2002. Obesity and the polycystic ovary syndrome. Int J Obes Relat Metab Disord. 26(7):883–896. doi:10.1038/sj.ijo.0801994.
- Giampaolino P, Della Corte L, De Rosa N, Mercorio A, Bruzzese D, Bifulco G. 2018. Ovarian volume and PCOS: a controversial issue. Gynecol Endocr. 34(3):229–232. doi:10.1080/09513590.2017.1391205.
- Hadlow N, Longhurst K, McClements A, Natalwala J, Brown SJ, Matson PL. 2013. Variation in antimüllerian hormone concentration during the menstrual cycle may change the clinical classification of the ovarian response. Fertil Steril. 99(6):1791–1797. doi:10.1016/j.fertnstert.2013.01.132.
- Homburg R, Ray A, Bhide P, Gudi A, Shah A, Timms P, Grayson K. 2013. The relationship of serum anti-Mullerian hormone with polycystic ovarian morphology and polycystic ovary syndrome: a prospective cohort study. Hum Reprod. 28(4):1077–1083. doi:10.1093/humrep/det015.
- Hyvlud A, Sabadash V, Gumnitsky J, Ripak N. 2019. Statics and kinetics of albumin adsorption by natural zeolite. Chem Chem Tech. 13(1):95–100. doi:10.23939/chcht13.01.095.
- Jensterle Sever M, Salamun V, Vrtacnik-Bokal E, Peterlin B, Maver A, Moloku O, Janez A. 2019. MON-220 Androstendione affects endometrial gene expression profile during window of implantation in obese infertile women with PCOS. J Endocr Soc. 3(1):MON–220. doi:10.1210/js.2019-MON-220.
- Jung S, Allen N, Arslan AA, Baglietto L, Brinton LA, Egleston BL, Falk R, R T F, Helzlsouer KJ, Idahl A, et al. 2017. Demographic, lifestyle, and other factors in relation to antimüllerian hormone levels in mostly late premenopausal women. Fertil Steril. 107(4):1012–1022. doi:10.1016/j.fertnstert.2017.02.105
- Li L, Chen X, Mo Y, Chen Y, Wenig M, Yang D. 2010. Elevated serum anti-mullerian hormone in adolescent and young adult Chinese patients with polycystic ovary syndrome. Wien Klin Wochenschr. 122(17–18):519–524. doi:10.1007/s00508-010-1426-x.
- Lie Fong S, Laven JSE, Duhamel A, Dewailly D. 2017. Polycystic ovarian morphology and the diagnosis of polycystic ovary syndrome: redefining threshold levels for follicle count and serum anti-Müllerian hormone using cluster analysis. Hum Reprod. 32(8):1723–1731. doi:10.1093/humrep/dex226.
- Lin YH, Chiu WC, Wu CH, Tzeng CR, Sen Hsu C, Hsu MI. 2011. Antimullerian hormone and polycystic ovary syndrome. Fertil and Sterility. 96(1):230–235. doi:10.1016/j.fertnstert.2011.04.003.
- Lujan M, Chizen D, Pierson R. 2008. Diagnostic criteria for polycystic ovary syndrome: pitfalls and controversies. J Obstet Gynecol Can. 30(8):671–679. doi:10.1016/S1701-2163(16)32915-2.
- Nieschlag E, Vorona E. 2015. Mechanisms in Endocrinology: medical consequences of doping with anabolic androgenic steroids: effects on reproductive functions. Eur J Endocr. 173(2):47–58. doi:10.1530/EJE-15-0080.
- Nteeba J, Ganesan S, Keating AF. 2014. Progressive obesity alters ovarian folliculogenesis with impacts on pro-inflammatory and steroidogenic signaling in female mice. Biol Reprod. 91(4):86–97. doi:10.1095/biolreprod.114.121343.
- Sahmay S, Usta T, Erel CT, Imamoğlu M, Küçük M, Atakul N, Seyisoğlu H. 2012. Is there any correlation between amh and obesity in premenopausal women? Arch Gynecol Obstet. 286(3):661–665. doi:10.1007/s00404-012-2363-x.
- Sir-Petermann T, Codner E, Maliqueo M, Echiburú B, Hitschfeld C, Crisosto N, Pérez-Bravo F, Recabarren SE, Cassorla F. 2006. Increased anti-Mullerian hormone serum concentrations in prepubertal daughters of women with polycystic ovary syndrome. J Clin Endo Metabolism. 91(8):3105–3109. doi:10.1210/jc.2005-2693.
- Somunkiran A, Yavuz T, Yucel O, Ozdemir I. 2007. Anti-Müllerian hormone levels during hormonal contraception in women with polycystic ovary syndrome. Eur J Obstet Gynecol Reprod Biol. 134(2):196–201. doi:10.1016/j.ejogrb.2007.01.012.
- Stolorz K, Nowosielski K, Włodarz IU, Sodowska P, Sodowski K. 2016. Ovarian hyperstimulation syndrome in spontaneous pregnancy. J Gynecol Res Obstet. 2(1):5–9. doi:10.17352/jgro.000007.
- Tata B, Mimouni N, Barbotin A, Malone S, Loyens A, Pigny P, Dewailly D, Catteau-Jonard S, Sundström-Poromaa I, Piltonen TT, et al. 2018. Elevated prenatal anti-Müllerian hormone reprograms the fetus and induces polycystic ovary syndrome in adulthood. Nature Med. 24(6):834–846. doi:10.1038/s41591-018-0035-5
- Wei Y, Ren Q. 2018. Theoretical analysis of prevention and treatment of around-adolescence women with IGT type PCOS by wenshen huatan prescription combined with food exchange. J Zhejiang China Med Univ. 42(3):220–232.
- Xu H, Deng Y. 2017. Dependent evidence combination based on shearman coefficient and pearson coefficient. IEEE Access. 6:11634–11640. doi:10.1109/ACCESS.2017.2783320.
- Youssef H, Marei E. 2019. Relation between anti-müllerian hormone with antral follicle count and ovarian volume in polycystic ovary syndrome. Arab J Nucl Sci Appl. 52(2):84–93. doi:10.21608/ajnsa.2019.3711.1087.