
ABSTRACT
Rodent models have contributed greatly to our understanding of preeclampsia (PE) progression in humans, however to-date no model has been able to effectively replicate the clinical presentation of the disease. This study aimed to provide a thorough physiological characterization of the arginine vasopressin (AVP)-induced rat model of PE to determine its applicability in studying the pathophysiology of PE. Female Sprague Dawley rats (n = 24) were separated into four groups (n = 6 per group) viz., pregnant AVP, pregnant saline, non-pregnant AVP, and non-pregnant saline. All animals received a continuous dose of either AVP (150 ng/h) or saline via subcutaneous mini osmotic pumps for 18 days. Full physiological characterization of the model included measuring systolic and diastolic blood pressure, and collecting urine and blood samples for biochemical analysis. AVP infusion significantly increased blood pressure and urinary protein levels in the pregnant rats (p < 0.05). Biochemical markers measured, differed significantly in the AVP-treated vs the pregnant saline groups (p < 0.05). Placental and individual pup weight decreased significantly in the pregnant AVP vs pregnant saline group (p < 0.05). The physiological and hematological data confirm the usefulness of this rat model in the study of PE, since AVP-induced vasoconstriction increases peripheral resistance and successfully mimics the pathological changes associated with PE development in humans.
Abbreviations: PE: preeclampsia; AVP: arginine vasopressin; ISSHP: International Society for the Study of Hypertension in Pregnancy; ACOG: American College of Obstetricians and Gynecologists; RUPP: reduced uterine perfusion pressure; sFlt-1: soluble fms-like tyrosine kinase; VEGF: vascular endothelial growth factor; PlGF: placental growth factor; AVP: arginine vasopressin; PAVP: pregnant AVP-treated; PS: pregnant saline; GD: gestational day; ALT: alanine transaminase; NAVP: non-pregnant AVP-treated; NS: non-pregnant saline; AST: aspartate aminotransferase; HDL: high-density lipoprotein; RBC: red blood cell; RAAS: renin-angiotensin aldosterone system; HELLP: hemolysis, elevated liver enzymes, low platelet.
Introduction
Preeclampsia (PE) is a multifactorial, multi-organ hypertensive disorder manifesting after 20 weeks of gestation, impacting 5–8% of all pregnancies, making it the leading cause of maternal and fetal morbidity and mortality globally (Marshall et al. Citation2018). Despite advancements in understanding the pathophysiology of PE, its early diagnosis remains a challenge. Initially, PE was characterized by de novo hypertension coupled with proteinuria (Brown et al. Citation2018) however, the International Society for the Study of Hypertension in Pregnancy (ISSHP) and the American College of Obstetricians and Gynecologists (ACOG) have redefined PE, stating that proteinuria is not mandatory for PE diagnosis and allowing for the inclusion of cases that exhibit signs of renal, hepatic, and/or hematological pathologies (Brown et al. Citation2018).
Treatment and management of PE is hindered by late clinical presentation often warranting premature fetal delivery. Ethical consideration and large enough sample numbers make it difficult to study PE in humans (Sones and Davisson Citation2016), which has resulted in a shift toward the use of animal models. Various animal models have contributed greatly to our understanding of PE. These including the reduced uterine perfusion pressure (RUPP) (Li et al. Citation2012), soluble fms-like tyrosine kinase (sFlt-1) rodent model (Maynard et al. Citation2003) and BPH/5 mouse models (Davisson et al. Citation2002) have been widely used to study the disorder. However, these models are limited in that the RUPP and sFlt-1 models are unable to reproduce liver dysfunction and intrauterine growth restriction associated with PE development (Maynard et al. Citation2003; Li et al. Citation2012), while the BPH/5 model indicates a preexisting hypertension in non-pregnant mice (Davisson et al. Citation2002). The recent data demonstrate the effectiveness of some models in treating PE symptoms, for example; aspirin improved maternal and fetal symptoms in a preclinical model of PE (Li et al. Citation2018; Zhang et al. Citation2018). Moreover, vasodilators such as sildenafil ameliorates maternal phenotype in PE models, however, its fetal and placental effects are inconsistent (Motta et al. Citation2015; Gillis et al. Citation2016). Also, proangiogenic vascular endothelial growth factor (VEGF) and placental growth factor (PlGF), improve PE phenotypes in soluble fms-like tyrosine kinase-1 (sFlt1)-induced preeclampsia (PE) rodent models (Spradley et al. Citation2016; Zhu et al. Citation2016). Despite the plethora of evidence, not all aspects of PE are fully understood. Therefore, it is essential that alternative animal models are available to further develop the study of PE pathogenesis.
Arginine vasopressin (AVP), a vasoconstrictor and antidiuretic hormone was recently used in the development of a murine PE model, which displayed all of the characteristic phenotypes of PE (Santillan et al. Citation2014). AVP plays a central role in the mechanisms related to PE development viz., vascular function, angiogenesis, renal dysregulation, and immunological abnormalities (Santillan et al. Citation2014). In non-pregnant states, AVP exerts its physiological effects via V1a receptors, inducing vasoconstriction and regulating neuronal and immune cell function (Koshimizu et al. Citation2012), as well as modulating angiogenesis in the hypothalamus (Alonso et al. Citation2008). It promotes water reabsorption in the kidney via V2 receptors (Guelinckx et al. Citation2016), thereby regulating blood pressure and blood volume (Koshimizu et al. Citation2012; Santillan et al. Citation2014). It also supports the regulation of the hypothalamic-pituitary-adrenal axis via V1b receptors, which indirectly alters immune, vascular, and renal functions (Buchwalter et al. Citation2008; Koshimizu et al. Citation2012). AVP is also involved in T helper 1 cell predominance and activation of dendritic and T helper 17 cells associated with PE development (Elenkov and Chrousos Citation2006; Russell and Walley Citation2010). Hence, the normal physiological role of AVP is similar to the mechanisms underlying the vascular, immune, renal, and angiogenic dysfunction associated with PE (Sandgren et al. Citation2015), warranting its investigation in PE development.
Despite the murine AVP model of PE producing symptoms similar to those observed clinically, this model has yet to be replicated in rats, a prototype which is preferred for pregnancy-specific disorders due to a similar placental development observed in humans (Soares et al. Citation2014). In a previous study conducted by our lab, we showed significantly increased serum levels of transforming growth factor beta-2 and a significant elevation in the activity of the liver injury enzymes arginase and 5ʹ-nucleotidase suggestive of AVP-induced injury (Govender et al. Citation2021). Therefore, this study aimed to characterize the physiological, hematological, and biochemical changes associated with an AVP-induced rat model of PE, in order to determine its applicability in studying the pathophysiology of human PE.
Results
Preliminary dose-response study
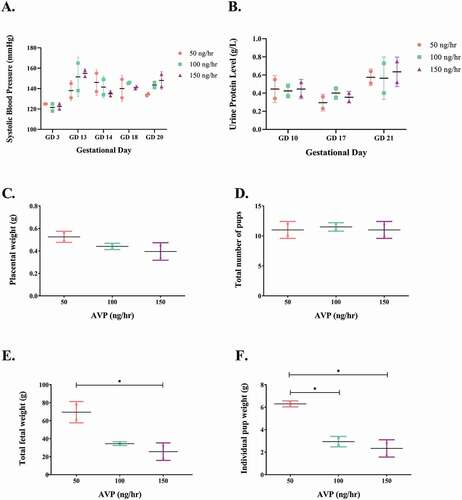
The physiological dose-response outcomes supported the use of an AVP dose of 150 ng/h (). Lower AVP dosages (50 ng/h and 100 ng/h) were unable to significantly elevate blood pressure and proteinuria nor did it reduce placental and pup weight. Pregnant rats treated with AVP (150 ng/h) showed significantly increased systolic blood pressure and urinary protein levels and reduced individual pup and placental weights, respectively ().
Figure 1. Effect of chronic AVP infusion (50, 100 and 150 ng/h) on (A) systolic blood pressure, (B) urinary protein concentration and (C-F) fetal and placental parameters in pregnant Sprague-Dawley rats. (A) Infusion of 150 ng/h AVP produced a larger increase in systolic blood pressure in pregnant rats than lower doses (50 and 100 ng/h). (B) Rats infused with 150 ng/h AVP showed a marked increase in urine protein levels in comparison to lower doses (50 and 100 ng/h). (C) Individual placental weight, AVP-infusion reduces placental weight. (D) Total number of pups, AVP-infusion does not induce a great change in the total number of pups produced. (E) 150 ng/h AVP infusion induced a significant reduction in total fetal weight in comparison to 50 ng/h. (f) Individual pup weight was significantly reduced pups produced from rats infused with 150 ng/h AVP in comparison to rats infused with 50 ng/h AVP. One-way ANOVA analyses followed by Tukey’s multiple comparison analyses. Data is shown as mean ± SD, *p < 0.05.
Experimental study
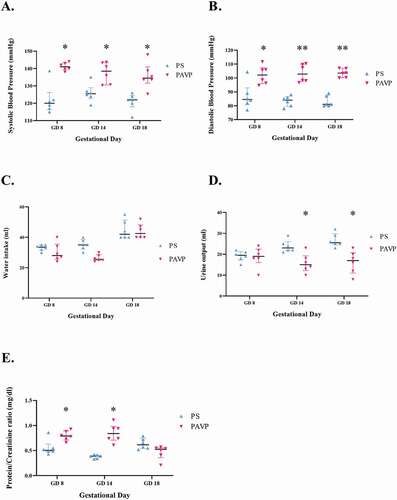
Statistically significant elevations were noted for both systolic [143.00 (139.67–144.00) mmHg vs 125.00 (124.00–127.00) mmHg; p < 0.05] and diastolic [103.50 (100.33–106.88) mmHg vs 81.00 (80.00–87.00) mmHg; p < 0.001] blood pressure throughout pregnancy in the pregnant AVP-treated (PAVP) vs the pregnant saline (PS) group (). The urine protein: creatinine ratio was increased in the PAVP compared to the pregnant saline group on gestational day (GD) 8 [PAVP: 0.79 (0.73–0.88) g/day vs PS: 0.49 (0.43–0.49) g/day; p = 0.006] and GD 14 [PAVP: 0.84 (0.74–0.94) g/day vs PS: 0.41 (0.39–0.44) g/day; p = 0.0002; ]. Water intake decreased in the PAVP in comparison to the PS group on GD 8 and GD 14 (), whereas urinary output decreased significantly in PAVP rats [17.00 (12.00–20.00) ml] compared to the PS rats [25.50 (25.00–29.00) ml; p < 0.05; ].
Figure 2. Clinical parameters (A-B) systolic and diastolic blood pressures (mmHg); (C) water intake (ml); (D) urinary output (ml) and (E) urine protein:creatinine ratio levels (mg/dL) across all study groups. Systolic (A) and diastolic (B) blood pressure was significantly increased in AVP-treated groups in comparison to saline groups. (C) Water intake is significantly upregulated in the pregnant groups in comparison to the non-pregnant rat groups. (D) Urine output is significantly reduced in the pregnant AVP-treated group as compared to the pregnant saline group (E) AVP infusion in pregnant rats induced significant elevations in urine protein: creatinine ratio levels in comparison to saline infusion on GD 8 and 14. Kruskal-Wallis and Dunn’s post hoc multiple comparison tests were used to compare the medians between groups. Data is shown as median and interquartile range, *p < 0.05, **p < 0.001. # Data for non-pregnant (NS and NAVP) groups were within normal ranges and are not illustrated.
The hematology results show significantly higher serum alanine transaminase (ALT) levels in the PAVP [58.50 (57.00–60.00) IU/L] compared to the non-pregnant AVP-treated (NAVP) [40.00 (38.00–44.00) IU/L; p < 0.001] and saline-treated groups [non-pregnant saline (NS): 51.50 (46.00–54.00) IU/L; PS: 48.00 (45.00–49.00) IU/L; p < 0.05], with liver weight also significantly higher in the former group [12.39 (11.99–13.40) g; p < 0.001; & G]. Conversely, aspartate aminotransferase (AST) levels were significantly down-regulated in the PAVP [131.00 (130.00–135.00) IU/L] compared to both the NS [149.00 (143.50–150.00) IU/L] and NAVP [143.50 (140.00–148.00) IU/L; p < 0.05; ] groups. A non-significant increase in AST levels was noted in the PAVP group in comparison to the PS group [129.50 (127.00–133.00) IU/L; p > 0.05; ]. Despite down-regulated lactate dehydrogenase (LDH) levels in the PAVP [1300.00 (1176.50–1359.50) IU/L] vs the NAVP group [1431.00 (1400.00–1738.00) IU/L; p < 0.05; ], both AVP-treated groups displayed significantly higher LDH levels when compared to the saline-treated groups [NS: 570.00 (487.00–761.50) IU/L; PS 538.00 (498.00–549.00) IU/L; p < 0.05].
Figure 3. Metabolic parameters (A) weight (g) and (B) liver weight (g); and biochemical parameters (C) alanine aminotransferase (ALT, mmol/L); (D) aspartate aminotransferase (AST, mmol/L); (E) lactic acid dehydrogenase (LDH, mmol/L); (F) total cholesterol (mmol/L); (G) HDL cholesterol (mmol/L); (H) triglycerides (mmol/L) and (I) blood glucose (mmol/L), measured across all study groups on GD 18. (A) Pregnant rat groups demonstrate significant elevations in weight in comparison to the non-pregnant control groups. (B) Liver weight is increased in the PAVP group in comparison to the PS group. (C) ALT concentrations were significantly elevated in the PAVP vs the PS group. (D) AST concentrations are elevated in the PAVP group in comparison to the PS group. (E) LDH levels are significantly increased in the PAVP group in comparison to the PS group. (F) Total cholesterol and (G) HDL cholesterol is significantly reduced in the PAVP group in comparison to the PS group, while (H) Triglyceride levels in the PAVP group are significantly elevated as compared to the PS group. (I) Blood glucose levels are higher in the PAVP group when compared to the PS group on GD 9, conversely the PAVP group is reduced in comparison to the PS group on GD 18. Kruskal-Wallis and Dunn’s post hoc multiple comparison tests were used to compare the medians between groups. Data is shown as median and interquartile range, *p < 0.05, **p < 0.001. # Data for non-pregnant (NS and NAVP) groups were within normal ranges and are not illustrated.
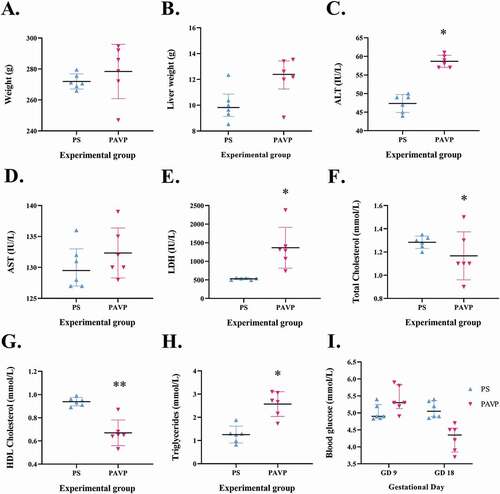
Cholesterol and high-density lipoprotein (HDL) levels were significantly decreased in the PAVP [cholesterol: 1.10 (1.10–1.30) mmol/L; HDL: 0.65 (0.64–0.68) mmol/L] and NAVP groups [cholesterol: 1.20 (1.00–1.20) mmol/L; HDL:0.77 (0.70–0.79) mmol/L] vs the PS group [cholesterol: 1.29 (1.25–1.32) mmol/L; HDL: 0.94 (0.91–0.96) mmol/L; p < 0.05; ]. Triglyceride concentrations increased significantly in the PAVP [2.69 (2.16–3.05) mmol/L] compared to the NAVP [0.64 (0.58–0.69) mmol/L], NS [0.84 (0.47–1.09) mmol/L] and PS [1.27 (0.98–1.30) mmol/L] groups (p < 0.05; ).
Blood glucose levels decreased significantly in the PAVP [4.35 (3.90–4.50) mmol/L] group in comparison with the NAVP [5.65 (5.40–6.40) mmol/L] and NS [6.30 (6.05–6.50) mmol/L] groups on GD18 (p < 0.05; ). Non-significant reductions were noted for red blood cell (RBC) count, platelets, and hematocrit levels in the PAVP group compared to the NAVP group (p > 0.05; ), the levels were above the normal reference range.
Table 1. Hematological parameters between the non-pregnant AVP and pregnant AVP groups on GD 18.
A significant reduction in the serum concentrations of sodium [139.00 (138.00–143.00) mmol/L vs 143.00 (141.00–143.00) mmol/L]; urea [4.50 (3.50–5.80) mmol/L vs 5.60 (5.50–6.00) mmol/L]; and chloride [98.00 (97.00–100.00) mmol/L vs 105.00 (104.00–106.00) mmol/L] was noted between the PAVP group compared to the NAVP group (p < 0.05; ). Potassium levels decreased significantly in the PAVP [4.55 (3.90–4.80) mmol/L] and NAVP [4.40 (4.20–4.80) mmol/L] vs the NS group [5.00 (4.80–5.40) mmol/L; p < 0.05; ]. A reduction in creatinine levels was observed in both AVP groups [NAVP: 29.00 (27.00–33.00) µmol/L; PAVP: 28.50 (24.00–30.00) µmol/L; p < 0.05; ].
Table 2. Serum electrolyte levels across experimental groups on GD 18.
Pup numbers increased significantly in the PAVP [12.00 (11.00–12.00)] vs PS groups [9.00 (8.00–10.00); p < 0.05; ], however, the weight per pup was significantly lower in the PAVP [1.57 (1.45–1.67) g vs the PS groups [1.79 (1.70–1.85) g; p < 0.05]. We also demonstrate significantly lower individual placental weights in the PAVP [0.39 (0.31–0.46) g] vs the PS groups [0.59 (0.55–0.63) g; p < 0.05; ].
Table 3. Fetal and placental parameters.
Histological evaluation of liver, kidney and placenta
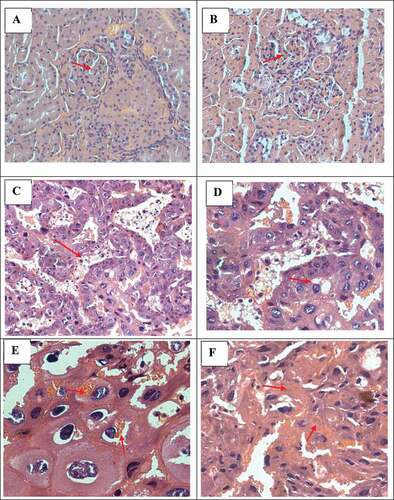
The histological examination of the liver in both the untreated and AVP treated groups appeared normal. In the kidney, mild mesangial cell increase together with an increase in mesangium () was noted in the AVP-treated (NAVP and PAVP) in contrast to the untreated groups. Mild focal cellular glomerular crescents with concurrent reduction in the Bowmans space was also evident (). In the placenta, the labyrinth trophoblast cells lining the vascular channels appeared normal with occasional vacuolation while the spongiotrophoblasts were frequently degenerative in the AVP-treated group vs the untreated group (). The spongiotrophoblasts were often necrotic, with phagocytic material visible ().
Figure 4. Histopathological examination of tissue sections from pregnant AVP treated rats (H&E stain) displaying (from top left plate clockwise; red arrows): (A-B: Kidney): mild mesangial cell increase, increase in mesangium and reduction in the Bowmans space, 40x magnification; (C-F: Placenta): occasional vacuolation along labyrinth trophoblast cells, 20x magnification; degenerative spongiotrophoblasts, 40x magnification; red blood cell phagocytosis, 40x; and fibrinoids, 40x respectively.
Discussion
This study demonstrates that AVP infusion (150 ng/h) resulted in significantly elevated blood pressure and urinary protein, features that typifies PE. Both systolic and diastolic blood pressure were significantly elevated throughout pregnancy in the PAVP vs the PS group. Similarly, chronic AVP infusion of 24 ng/h in a murine model demonstrated increased systolic blood pressure and negatively impacted fetal growth and development (Santillan et al. Citation2014). The short biological half-life of AVP prevents the direct measurement of secreted AVP (Santillan et al. Citation2014), hence, copeptin, a stable protein by-product of AVP synthesis released in a 1:1 ratio with AVP, is the substitute biomarker for measuring AVP secretion (Dobsa and Edozien Citation2013; Sandgren et al. Citation2015). In humans, higher plasma and serum copeptin levels in the preeclamptic compared to normotensive pregnancies is indicative of higher AVP levels as well [(serum: normotensive: 1.69 ± 1.02 ng/mL vs PE: 2.27 ± 2.00 ng/mL) (Yeung et al. Citation2014) and (plasma: normotensive: 0.31 ± 0.09 ng/mL vs mild PE: 0.62 ± 0.16 ng/mL) (Zulfikaroglu et al. Citation2011)].
Earlier studies also linked AVP to arterial blood pressure regulation (Jablonskis and Howe Citation1993; Song and Martin Citation2006; Li et al. Citation2012). The elevations in both systolic and diastolic blood pressure in our study throughout pregnancy in the PAVP group, suggests that arginine vasopressin stimulates the renin-angiotensin aldosterone system (RAAS). This results in vasoconstriction, which is mediated via the V1a receptor and consequently increases peripheral resistance and systemic blood pressure as observed in our study (Qian Citation2018). Myocardial atrial contraction results in an atrial-induced increase in end-diastolic pressure, which subsequently enhances ventricular contraction. Arginine vasopressin increases the impact of norepinephrine and Ang II on cardiac muscle and blood vessels thus altering hemodynamic function (Lee et al. Citation2003), and negatively affects myocardial contraction (Goldsmith Citation2005; Goldsmith and Gheorghiade Citation2005). Chronic hypertension results in diastolic dysfunction and consequent left ventricular hypertrophy thereby reducing cardiac compliance (Lorell and Carabello Citation2000). This results in a higher diastolic pressure–volume relationship where even minor elevations in left ventricular end-diastolic volume induces a significant rise in left ventricular end diastolic pressure (Gutierrez and Blanchard Citation2004). The pronounced effect of AVP on diastolic pressure may be due to the exaggerated interaction of AVP with the V1A and V2 receptors on peripheral blood vessels (Goldsmith Citation2005; Goldsmith and Gheorghiade Citation2005).
Despite the exclusion of proteinuria as a characterizing factor (ACOG Citation2013), it remains significant in PE diagnosis (Guida et al. Citation2018; Özkara et al. Citation2018; Tanacan et al. Citation2019). We report significantly increased urinary protein: creatinine ratios in the PAVP group compared to the pregnant saline group on GD 8 and 14. It is possible that AVP affects the control of glomerular filtration rate via the macula densa and the tubulo-glomerular feedback mechanism as a result of an increase in intraglomerular pressure. The macula densa cells detects the increased tubular ion content subsequently activating the RAAS, which inhibits the juxtaglomerular release of nitric oxide. This results in arteriolar vasoconstriction and increases glomerular and systemic blood pressure, causing glomerular hyperfiltration and proteinuria. A similar effect was previously demonstrated in diabetic rats (Bankir et al. Citation2001; Bolignano and Zoccali Citation2010).
Likewise, chronic AVP administration in pregnant mice induces glomerular endotheliosis and consequent proteinuria (Sandgren et al. Citation2018). In a nitric oxide synthase inhibition rat PE model, elevations in systolic blood pressure were associated with increased glomerular pressure and consequent glomerular damage and proteinuria (Baijnath et al. Citation2014). Shedding of the podocyte barrier due to the intermittent separation of the foot processes from the basement membrane may result in proteinuria (Koop et al. Citation2003). An angiogenic balance between vascular endothelial growth factor (VEGF) and its receptor sFlt-1 maintains the integrity and function of glomerular filtration barrier (al Embarazo et al. Citation2007). In PE, increased levels of sFlt-1, an antagonist of the VEGF receptor, offsets this balance by inhibiting its receptor binding and reducing VEGF levels (Müller-Deile and Schiffer Citation2011; Govender et al. Citation2012), negatively impacting the glomerular structural integrity resulting in proteinuria (Baijnath et al. Citation2017). Moreover, elevations in urinary mRNA levels of podocin and nephrin in early onset PE suggest glomerular damage and podocyte loss characteristic of PE development (Baijnath et al. Citation2017).
Glomerular damage increases glomerular permeability, thereby permitting entry of larger-sized proteins into the filtrate. The increase in peripheral vascular resistance due to AVP treatment, elevates systemic BP with consequent glomerular injury (Santillan et al. Citation2014) as demonstrated by the higher urinary protein levels observed in the AVP-treated rats in our study. Kidney histology as shown in highlights the effects of mild increase in mesangium, mild glomerular crescents and reduction in the Bowman’s space in AVP-treated rats (NAVP and PAVP). The Bowman’s capsular space protects glomerular function by acting as a shield against leukocyte infiltration (Chen et al. Citation2018). Glomerular epithelial crescents produced by the aggregation of inflammatory cells and proliferating epithelial cells in the Bowman’s space, are characteristic of glomerulonephritis (D’Souza et al. Citation2013). Thus, our data suggest an AVP-induced leukocyte infiltration and accompanying glomerular damage may contribute to increased urinary protein levels in the AVP- treated groups. In our study, water intake increased proportionally with gestational days amongst the pregnant (PAVP and PS) and NAVP groups, while urinary output reduced significantly in PAVP rats compared to the PS rats. Reductions in urinary output may be attributed to the antidiuretic effect of AVP, via V2 receptor activation and increased expression of aquaporin-2 channels resulting in water retention and reduced urinary output (Guelinckx et al. Citation2016).
In our study, we notice a significant reduction in the serum concentrations of sodium, urea, and chloride was noted between the PAVP group compared to the NAVP group. Potassium levels decreased significantly in the PAVP and NAVP vs the NS group. Sodium, chloride, and creatinine levels in the PAVP group showed a lower trend in comparison with the PS group, however, these differences were not significant. Reduced serum sodium and potassium levels suggest a dysregulation in their transport across the vascular smooth-muscle cell membrane (Indumati et al. Citation2011). Sodium reabsorption mediated by AVP within renal tubules, creates a salt-sensitive rise in blood pressure while urea retention may increase plasma urea levels, indirectly increasing glomerular filtration rate (Qian Citation2018). Our results corroborate others (Anastasio et al. Citation2001; Bankir et al. Citation2017), and supports a direct relationship between increased GFR and urine osmolality in both humans and rats. Elevated serum chloride levels in PE may possibly inhibit vessel dilation due to increased osmolality (Barrett et al. Citation2010).
The observed reduction in creatinine levels in both AVP groups contradicts other reports of elevated creatinine levels in PE (Manjareeka and Nanda Citation2013; Patil et al. Citation2016). However, creatinine levels may be influenced by many other factors including the glomerular filtration rate and differences in filtration fraction (Huang et al. Citation2011), since higher filtration fractions reduce efferent blood flow resulting in decreased tubular creatinine secretion. Moreover, vasoconstriction of the efferent arteriole may be due to increased RAAS activation induced by AVP, which increases angiotensin II that significantly influences serum creatinine levels.
In addition, we also investigated serum biochemical parameters in the AVP model of PE. We observed significantly higher serum ALT levels in the PAVP compared to the NAVP and saline-treated groups, with liver weight also significantly higher in the former group. Conversely, AST levels were significantly down-regulated in the PAVP compared to both the NS and NAVP groups. A non-significant increase in AST levels was noted in the PAVP group in comparison with the PS group. Despite the noticeable dysregulation of transaminase levels in our study, the liver histology of the PS and PAVP groups was normal, suggesting that while a 150 ng/h infusion of AVP could elevate the level of liver enzymes, it was not high enough to cause liver damage of hemolysis, elevated liver enzymes, low platelet (HELLP) associated with PE. Despite down-regulated LDH levels in the PAVP vs the NAVP group, both AVP-treated groups displayed significantly higher LDH levels when compared to the saline-treated groups.
Liver diseases are reported to affect approximately 3% of pregnancies, resulting in maternal and fetal mortality (Mikolasevic et al. Citation2018), hence it is important to not rule out these variations in the liver injury enzymes. It may be potential indicators of liver dysfunction such as intrahepatic cholestasis of pregnancy or acute fatty liver of pregnancy manifesting in late pregnancy (Mikolasevic et al. Citation2018). This is typical in patients who present with HELLP syndrome, which is seen in severe cases of PE, however, our data indicates mild AVP induced blood pressure elevations, suggestive of mild PE onset. HELLP syndrome is a pregnancy-associated liver disease and is a predisposing factor for the progression of PE to eclampsia (Barton and Sibai Citation2004; Jeyabalan Citation2013; Brown et al. Citation2018). Reproducing this HELLP phenotype in animal models of PE will support the investigation of mechanisms implicated in PE development and its progression from severe PE to eclampsia.
We recently reported higher serum levels of liver injury enzymes arginase, and 5ʹ-nucleotidase in AVP-treated pregnant rats in comparison with saline-treated rats (Govender et al. Citation2021). Higher 5ʹ-nucleotidase levels observed in the PAVP group is suggestive of possible hepatotoxicity and hepatobiliary disease as previously reported (Dixon and Purdom Citation1954; Carakostas et al. Citation1990). The observed increase in these enzyme levels are indicative of liver injury induced by AVP, however, the extent of the liver injury displayed in this model was insufficient to produce the hepatic dysfunction associated with the HELLP syndrome (Govender et al. Citation2021). Our results are in accordance with Sandgren’s group, who reported similar findings (Sandgren et al. Citation2018). The abnormal liver markers and elevated transaminase levels observed in our study may be indicative of acute pregnancy-initiated liver dysfunction.
There is limited data associated with the AVP-induced rat PE model. Nonetheless, higher serum ALT, AST, LDH, and aminotransferase levels occur in PE compared to healthy pregnant women (Dacaj et al. Citation2016; Gupta et al. Citation2019). Chronic AVP possibly creates a hypoxic environment that alters liver function and increases serum AST and ALT levels. Additionally, endothelial dysfunction, a pathognomonic PE feature may alter the prostacyclin: thromboxane ratio with consequent elevations in thromboxane causing hepato-vascular vasoconstriction (Dacaj et al. Citation2016). Moreover, hypoxia in PE may increase glycolysis consequently increasing LDH activity (Lu et al. Citation2005), indicating cellular damage and their potential use to evaluate disease severity (Qublan et al. Citation2005).
Our data also highlight a reduction in cholesterol and HDL levels in the PAVP and NAVP groups in comparison with the PS group. Reduced HDL levels in our study may be linked to the endothelial dysfunction as previously reported (ACOG Citation2013; White et al. Citation2019). However, reduced cholesterol levels in AVP-treated rats in comparison with pregnant saline rats contradicts others (Gohil et al. Citation2011; White et al. Citation2019), which indicate elevated cholesterol levels in PE. Triglyceride concentrations increased significantly in the PAVP compared to the NAVP- and saline-treated groups. Maternal serum triglyceride levels increase during pregnancy to accommodate the fetal nutritional needs (Cortés-Vásquez et al. Citation2018), however, an excess in triglyceride levels are associated with PE development (Huang et al. Citation2013). Arginine vasopressin exerts an anti-lipolytic effect via V1a receptors through the down-regulation of tissue lipase, thereby inhibiting triglyceride breakdown (Hiroyama et al. Citation2007). Elevations in triglyceride levels may interfere with placental vascular development resulting in inadequate implantation and/or poor placental perfusion (Mayret-Mesquiti et al. Citation2007; Vrijkotte et al. Citation2012; El Khouly et al. Citation2016). Additionally, increased triglyceride levels may promote oxidative stress via peroxidation of placental lipids and trophoblasts resulting in endothelial cell damage (Niromanesh et al. Citation2012; El Khouly et al. Citation2016). Others also demonstrated higher triglyceride levels in PE compared to normotensive pregnancies (Lima et al. Citation2011; Huang et al. Citation2013; Saha et al. Citation2013), suggestive that triglyceride elevation may be linked to spiral artery atherosclerosis/thrombosis and consequent endothelial dysfunction (Gilbert et al. Citation2008; Saha et al. Citation2013).
Blood glucose levels decreased significantly in the PAVP group in comparison with the NAVP and NS groups on GD18. Acute AVP infusion in rats produces a temporary rise in blood glucose concentration (Hems et al. Citation1975; Taveau et al. Citation2016), however, the reductions noted in our AVP- treated rats suggest that AVP most probably inhibited gluconeogenesis and glycogenolysis, a process that warrants further investigation.
Despite the non-significant reductions noted for RBC count, platelets, and hematocrit levels in the PAVP group compared to the NAVP group, the levels were above normal. Notably, AVP induces the proliferation and differentiation of red blood cell precursors (Mayer et al. Citation2017), accounting for the elevation noted for RBC counts and hematocrit. Increased hematocrit and RBC levels increase blood viscosity and peripheral resistance with consequent elevations in blood pressure (Emamian et al. Citation2017). Decreased platelet count is associated with the development of the HELLP syndrome in severe PE, which is characterized by hemolysis, elevated liver enzyme, and low platelet count (Weiner et al. Citation2016). High platelet levels observed in the AVP-treated groups are likely due to the mild AVP-induced elevations in blood pressure (120–140 mmHg), which was unable to excessively alter platelet levels. Interestingly, our findings are corroborated by others, who also reported no significant changes to hematological parameters between PE and normal pregnant women (Makuyana et al. Citation2002; Hershkovitz et al. Citation2005; Siddiqui et al. Citation2011).
Despite a significant increase in pup numbers in the PAVP vs PS group, the weight per pup was significantly lower in the PAVP in contrast to the PS group. Abnormal placentation characteristic of preeclamptic placentae leads to reduced placental perfusion and hypoxia (Cheng and Wang Citation2009) with consequent fetal growth restriction (Cotechini et al. Citation2014). We also demonstrate significantly lower individual placental weights in the PAVP vs the PS groups. The smaller placentae may be associated with reduced uteroplacental blood flow due to vasoconstriction of spiral arterioles, which directly influences fetal growth (Ferrazzani et al. Citation2011), mirroring human PE. Placental spongiotrophoblasts are responsible for increasing nutrient availability to the placenta in response to the maternal metabolic adjustments to pregnancy (Hu and Cross Citation2009; Eaton et al. Citation2020). Our histology data demonstrate that the labyrinth trophoblast cells lining the vascular channels appeared normal with occasional vacuolation while the spongiotrophoblasts were frequently degenerative in the AVP-treated group vs the untreated group. The spongiotrophoblasts were often necrotic, with phagocytic material visible, which correlates with the reduced relative size of the basal/junctional zone. It is possible that AVP-induced necrosis and cellular degeneration leading to decreased spongiotrophoblast proliferation and inadequate placental development on the fetal side, which corresponds to the lower individual pup weights observed in the treated groups (Eaton et al. Citation2020).
Despite higher pup numbers observed in the PAVP group, the weight per pup was smaller, indicative of restricted fetal development in comparison to the PS group. The placenta is integral in transporting glucose from the maternal to fetal circulation (Furukawa et al. Citation2011). The AVP-induced glucose reduction and placental impairment observed in our study may have consequently altered glucose transport to the fetus, which correlates with the lower pup weights shown in the AVP- treated groups. Similar findings are reported by various others (Crews et al. Citation2000; Li et al. Citation2012; Macdonald-Wallis et al. Citation2014; Santillan et al. Citation2014). Likewise, lower birth weight and intrauterine growth restriction were reported in C57BL/6 J pregnant mice chronically infused with AVP (Santillan et al. Citation2014). Similarly, in a RUPP rat PE model, uteroplacental perfusion was reduced by almost 40% in vivo, resulting in late gestational hypertension, proteinuria, smaller litter sizes, and fetal growth restriction (Crews et al. Citation2000; Li et al. Citation2012). Elevated maternal blood pressure occurring early in pregnancy is thus associated with reduced birth weight and small-for-gestational-age babies (Macdonald-Wallis et al. Citation2014). However, an earlier study reported that preeclampsia is associated with both pregnancies with normal placental function as well as those with abnormal placentation and intrauterine growth restriction (Rasmussen and Irgens Citation2003). Late-onset PE pregnancies (>34 weeks) are usually linked to normal birth weights (Odegård et al. Citation2000), whereas in early-onset PE pregnancies, the presence or absence of fetal growth restriction did not induce significant differences in the degree of hypertension or maternal complications (Haddad et al. Citation2007).
To our knowledge, this is the first study to successfully replicate an AVP-induced mouse PE model to a Sprague-Dawley rat model. We demonstrate significantly increased systolic and diastolic blood pressures and proteinuria in the AVP-treated rats in comparison with the untreated rats. The physiological and hematological data confirm that this AVP-induced rat model has the potential to adequately reproduce the clinical PE features of elevated blood pressure, proteinuria, fetal growth restriction together with elevations in several blood and lipid parameters. We demonstrate significantly higher serum levels of ALT and triglycerides along with reduced HDL levels in the AVP-treated pregnant group, confirming the potential role of AVP in the development of PE.
Materials and methods
Animal welfare
Sprague-Dawley rats aged 10–12 weeks (160–180 g) were housed in polycarbonate cages under standard laboratory conditions of temperature (22 to 24°C), humidity (60%) and illumination (12 h light/dark cycles) with ad libitum access to standard rat chow (Meadows Feeds, Pietermaritzburg, South Africa) and normal drinking water.
Preliminary dose-response study
A pilot dose-response study used three AVP doses (50, 100, and 150 ng/h) to determine the optimum and safe dose required to produce the clinical symptoms of PE. Six pregnant female Sprague-Dawley rats (n = 2 per dose) were surgically implanted with ALZET mini-osmotic pumps (model 2004; Durect Corporation, Cupertino, CA), on GD 1 to subcutaneously deliver the selected doses of AVP. The mini osmotic pumps remained implanted until sacrifice. Physiological parameters (weight, systolic and diastolic blood pressure) were measured at GD 3, 13, 14, 18, and 20 using the MRBP tail-cuff BP monitor (IITC Life Sciences Inc., USA). Urine samples (24 h) were collected on GD 10, 17, and 21 to measure urinary proteins, using the M-TP Microprotein Kit (Beckman Coulter, CA, USA) and read using the SYNCHRON LX® System (Beckman Coulter, CA, USA).
Experimental study
Twenty-four pregnant female Sprague-Dawley rats (200–220 g) were randomly grouped as follows:
Group 1: (n = 6) Non-pregnant with saline delivery (NS)
Group 2: (n = 6) Non-pregnant with AVP delivery (NAVP)
Group 3: (n = 6) Pregnant with saline delivery (PS)
Group 4: (n = 6) Pregnant with AVP delivery (PAVP)
Based on the pilot study outcomes, an AVP dose of 150 ng/h was chosen since it produced the most significant changes in blood pressure and proteinuria compared to the lower doses tested. The ALZET mini osmotic pumps were subcutaneously implanted on GD 1 and remained implanted until sacrifice (GD 18) in all study groups. Saline and AVP (150 ng/h) were subcutaneously delivered throughout gestation, to the control and experimental groups respectively and pumps were removed at sacrifice (GD 18). Systolic and diastolic blood pressure was measured on GD 8, 14, and 18 using the MRBP tail-cuff BP monitor (IITC Life Sciences Inc., USA), by placing animals in a suitably sized restrainer. Normal blood pressure was defined as systolic ≤120 mmHg and diastolic ≤80 mmHg. Hypertension in rats was defined as systolic ≥140 mmHg and diastolic ≥90 mmHg (Brown et al. Citation2018). Animals were housed in metabolic cages (Techniplast, Italy) on GD 8, 14, and 18, for the measurement of water intake and urinary output; and collection of 24 h urine samples. Urinary protein content was measured using the M-TP Microprotein Kit (Beckman Coulter, CA, USA) and read using the SYNCHRON LX® System (Beckman Coulter, CA, USA). Animals were then euthanized on GD 18, via isoflurane overdose (Safeline Pharmaceuticals, South Africa). Blood samples were collected via cardiac puncture and centrifuged for 15 min at 3500 rpm at 4°C. The number and weight of placentae and pups were recorded. Biochemical and hematological analysis was carried out by a pathology laboratory using rodent reference ranges.
Histological evaluation of the liver, kidney, and placenta
Liver, kidney, and placenta samples were fixed in 10% buffered formaldehyde and embedded into paraffin wax blocks as per standard laboratory procedure (Burton et al. Citation2014). Sections of liver, kidney, and placental tissue were cut (3 µm) using a rotary microtome and mounted onto frosted glass slides (ISOLAB GmbH Herstellung und Vertrieb von Laborgeräten, Eschau, Germany). Tissue sections were de-paraffinized and rehydrated for hematoxylin and eosin staining (Fischer et al. Citation2008). Stained sections were permanently mounted. Tissue sections were examined using the ZEISS Axio Imager 2 and images captured using Zen (Blue edition) software (Carl-Zeiss-Strasse, Oberkochen, Germany).
Statistical analysis
All statistical analyses were carried out using Stata (Version 12). All data were non-parametric and are summarized as median and interquartile range (IQR). The biochemical/hematological parameters in pregnant rats were compared with non-pregnant rats using the Mann–Whitney test. The Kruskal–Wallis and Dunn’s post hoc test was used to compare the medians between groups. A probability value of p < 0.05 was considered statistically significant.
Ethics approval for animal study
This study was approved by the Animal Research Ethics Committee, University of KwaZulu-Natal (UKZN) (AREC/046/017). All procedures were conducted as per the approved institutional standard protocols for animal research.
Authors' contributions
Conception and study design: NG, SB, BNM, SS. Conduction of experiments and data collection: SR, VP. Analysis and interpretation of the data: NG, SR, SB. Development and finalisation of the manuscript: NG, SR, TN, SB BNM, SS.
Acknowledgments
The authors are grateful for and acknowledge the Biomedical Resource Unit (BRU) for their use of the facilities and would like to thank the staff of the BRU for technical assistance with the animal study. The authors also wish to thank Prof. M. Santillan (Carver College of Medicine, University of Iowa, Iowa) and Prof. J. Grobe (Medical College of Wisconsin, Wisconsin) for their valuable input in the initial development of this study.
Disclosure statement
The author(s) report no conflict of interest.
Additional information
Funding
References
- ACOG. 2013. Hypertension in pregnancy. Report of the american college of obstetricians and gynecologists’ task force on hypertension in pregnancy. Obstet Gynecol. 122(5):1122.
- al Embarazo A, Ma S, JC B, Cadavid A, Cadavid A. 2007. A novel renal perspective of preeclampsia: a look from the podocyte. Nephrol Dial Transplant. 22(5):1477–1490. doi:https://doi.org/10.1093/ndt/gfl804.
- Alonso G, Gallibert E, Lafont C, Guillon G. 2008. Intrahypothalamic angiogenesis induced by osmotic stimuli correlates with local hypoxia: a potential role of confined vasoconstriction induced by dendritic secretion of vasopressin. Endocrinology. 149(9):4279–4288. doi:https://doi.org/10.1210/en.2008-0387.
- Anastasio P, Cirillo M, Spitali L, Frangiosa A, Pollastro RM, De Santo NG. 2001. Level of hydration and renal function in healthy humans. Kidney Int. 60(2):748–756. doi:https://doi.org/10.1046/j.1523-1755.2001.060002748.x.
- Baijnath S, Murugesan S, Mackraj I, Gathiram P, Moodley J. 2017. The effects of sildenafil citrate on urinary podocin and nephrin mRNA expression in an L-NAME model of pre-eclampsia. Mol Cell Biochem. 427(1–2):59–67. doi:https://doi.org/10.1007/s11010-016-2897-5.
- Baijnath S, Soobryan N, Mackraj I, Gathiram P, Moodley J. 2014. The optimization of a chronic nitric oxide synthase (NOS) inhibition model of pre-eclampsia by evaluating physiological changes. European Journal of Obstetrics & Gynecology and Reproductive Biology. 182:71–75. doi:https://doi.org/10.1016/j.ejogrb.2014.08.021.
- Bankir L, Bardoux P, Ahloulay M. 2001. Vasopressin and diabetes mellitus. Nephron. 87(1):8–18. doi:https://doi.org/10.1159/000045879.
- Bankir L, Bichet D, Morgenthaler N. 2017. Vasopressin: physiology, assessment and osmosensation. J Intern Med. 282(4):284–297. doi:https://doi.org/10.1111/joim.12645.
- Barton JR, Sibai BM. 2004. Diagnosis and management of hemolysis, elevated liver enzymes, and low platelets syndrome. Clin Perinatol. 31(4):807–833. doi:https://doi.org/10.1016/j.clp.2004.06.008.
- Bolignano D, Zoccali C. 2010. Vasopressin beyond water: implications for renal diseases. Curr Opin Nephrol Hypertens. 19(5):499–504. doi:https://doi.org/10.1097/MNH.0b013e32833d35cf.
- Barrett KE, Barman S, Boitano S, Brooks H. 2010. Pulmonary Function, Ch-35. Ganong’s review of medical physiology, 23rd Edition. 23rd ed. New Delhi: Tata McGraw Hill. p. 587-638.
- Brown MA, Magee LA, Kenny LC, Karumanchi SA, McCarthy FP, Saito S, Hall DR, Warren CE, Adoyi G, Ishaku S. 2018. Hypertensive disorders of pregnancy: ISSHP classification, diagnosis, and management recommendations for international practice. Hypertension. 72(1):24–43. doi:https://doi.org/10.1161/HYPERTENSIONAHA.117.10803.
- Buchwalter A, Van Dort C, Schultz S, Smith R, Le I, Abbott J, Oosterhouse E, Johnson A, Hansen-Smith F, Burnatowska-Hledin M. 2008. Expression of VACM-1/cul5 mutant in endothelial cells induces MAPK phosphorylation and maspin degradation and converts cells to the angiogenic phenotype. Microvasc Res. 75(2):155–168. doi:https://doi.org/10.1016/j.mvr.2007.08.004.
- Burton G, Sebire N, Myatt L, Tannetta D, Wang Y-L, Sadovsky Y, Staff A, Redman C. 2014. Optimising sample collection for placental research. Placenta. 35(1):9–22. doi:https://doi.org/10.1016/j.placenta.2013.11.005.
- Carakostas MC, Power RJ, Banerjee AK. 1990. Serum 5’Nucleotidase activity in rats: a method for automated analysis and criteria for interpretation. Vet Clin Pathol. 19(4):109–113. doi:https://doi.org/10.1111/j.1939-165X.1990.tb00555.x.
- Chen A, Lee K, D’Agati VD, Wei C, Fu J, Guan T-J, He JC, Schlondorff D, Agudo J. 2018. Bowman’s capsule provides a protective niche for podocytes from cytotoxic CD8+ T cells. J Clin Invest. 128(8):3413–3424. doi:https://doi.org/10.1172/JCI97879.
- Cheng M-H, Wang P-H. 2009. Placentation abnormalities in the pathophysiology of preeclampsia. Expert Rev Mol Diagn. 9(1):37–49. doi:https://doi.org/10.1586/14737159.9.1.37.
- Cortés-Vásquez J, Noreña I, Mockus I. 2018. Hypertriglyceridemia and adverse outcomes during pregnancy. Revista de la Facultad de Medicina. 66(2):247–253. doi:https://doi.org/10.15446/revfacmed.v66n2.60791.
- Cotechini T, Komisarenko M, Sperou A, Macdonald-Goodfellow S, Adams MA, Graham CH. 2014. Inflammation in rat pregnancy inhibits spiral artery remodeling leading to fetal growth restriction and features of preeclampsia. J Exp Med. 211(1):165–179. doi:https://doi.org/10.1084/jem.20130295.
- Crews JK, Herrington JN, Granger JP, Khalil RA. 2000. Decreased endothelium-dependent vascular relaxation during reduction of uterine perfusion pressure in pregnant rat. Hypertension. 35(1):367–372. doi:https://doi.org/10.1161/01.HYP.35.1.367.
- D’Souza Z, McAdoo SP, Smith J, Pusey CD, Cook HT, Behmoaras J, Aitman TJ. 2013. Experimental crescentic glomerulonephritis: a new bicongenic rat model. Dis Model Mech. 6(6):1477–1486.
- Dacaj R, Izetbegovic S, Stojkanovic G, Dreshaj S. 2016. Elevated liver enzymes in cases of preeclampsia and intrauterine growth restriction. Medical Archives. 70(1):44. doi:https://doi.org/10.5455/medarh.2016.70.44-47.
- Davisson RL, Hoffmann DS, Butz GM, Aldape G, Schlager G, Merrill DC, Sethi S, Weiss RM, Bates JN. 2002. Discovery of a spontaneous genetic mouse model of preeclampsia. Hypertension. 39(2):337–342. doi:https://doi.org/10.1161/hy02t2.102904.
- Dixon TF, Purdom M. 1954. Serum 5-nucleotidase. J Clin Pathol. 7(4):341–343. doi:https://doi.org/10.1136/jcp.7.4.341.
- Dobsa L, Edozien KC. 2013. Copeptin and its potential role in diagnosis and prognosis of various diseases. Biochemia Medica. 23(2):172–190. doi:https://doi.org/10.11613/BM.2013.021.
- Eaton M, Davies AH, Devine J, Zhao X, Simmons DG, Maríusdóttir E, Natale DR, Matyas JR, Bering EA, Workentine ML. 2020. Complex patterns of cell growth in the placenta in normal pregnancy and as adaptations to maternal diet restriction. PLoS One. 15(1):e0226735. doi:https://doi.org/10.1371/journal.pone.0226735.
- El Khouly NI, Sanad ZF, Saleh SA, Shabana AA, Elhalaby AF, Badr EE. 2016. Value of first-trimester serum lipid profile in early prediction of preeclampsia and its severity: a prospective cohort study. Hypertens Pregnancy. 35(1):73–81. doi:https://doi.org/10.3109/10641955.2015.1115060.
- Elenkov IJ, Chrousos GP. 2006. Stress System – organization, Physiology and Immunoregulation. Neuroimmunomodulation. 13(5–6):257–267. doi:https://doi.org/10.1159/000104853.
- Emamian M, Hasanian SM, Tayefi M, Bijari M, Movahedian Far F, Shafiee M, Avan A, Heidari‐Bakavoli A, Moohebati M, Ebrahimi M. 2017. Association of hematocrit with blood pressure and hypertension. J Clin Lab Anal. 31(6):e22124. doi:https://doi.org/10.1002/jcla.22124.
- Ferrazzani S, Luciano R, Garofalo S, D’Andrea V, De Carolis S, De Carolis MP, Paolucci V, Romagnoli C, Caruso A. 2011. Neonatal outcome in hypertensive disorders of pregnancy. Early Hum Dev. 87(6):445–449. doi:https://doi.org/10.1016/j.earlhumdev.2011.03.005.
- Fischer AH, Jacobson KA, Rose J, Zeller R. 2008. Hematoxylin and eosin staining of tissue and cell sections. Cold Spring Harb Protoc. 2008(6):4986. doi:https://doi.org/10.1101/pdb.prot4986.
- Furukawa S, Hayashi S, Usuda K, Abe M, Hagio S, Ogawa I. 2011. Toxicological pathology in the rat placenta. J Toxicol Pathol. 24(2):95–111. doi:https://doi.org/10.1293/tox.24.95.
- Gilbert JS, Nijland MJ, Knoblich P. 2008. Placental ischemia and cardiovascular dysfunction in preeclampsia and beyond: making the connections. Expert Rev Cardiovasc Ther. 6(10):1367–1377. doi:https://doi.org/10.1586/14779072.6.10.1367.
- Gillis EE, Mooney JN, Garrett MR, Granger JP, Sasser JM. 2016. Sildenafil treatment ameliorates the maternal syndrome of preeclampsia and rescues fetal growth in the dahl salt–sensitive rat. Hypertension. 67(3):647–653. doi:https://doi.org/10.1161/HYPERTENSIONAHA.115.06071.
- Gohil J, Patel P, Gupta P. 2011. Estimation of lipid profile in subjects of preeclampsia. The Journal of Obstetrics and Gynecology of India. 61(4):399. doi:https://doi.org/10.1007/s13224-011-0057-0.
- Goldsmith SR. 2005. Current treatments and novel pharmacologic treatments for hyponatremia in congestive heart failure. Am J Cardiol. 95(9):14–23. doi:https://doi.org/10.1016/j.amjcard.2005.03.004.
- Goldsmith SR, Gheorghiade M. 2005. Vasopressin antagonism in heart failure. J Am Coll Cardiol. 46(10):1785–1791. doi:https://doi.org/10.1016/j.jacc.2005.02.095.
- Govender L, Mackraj I, Gathiram P, Moodley J. 2012. The role of angiogenic, anti-angiogenic and vasoactive factors in pre-eclamptic African women : early- versus late-onset pre-eclampsia. Cardiovasc J Afr. 23(3):153. doi:https://doi.org/10.5830/CVJA-2012-003.
- Govender N, Ramdin S, Reddy R, Naicker T. 2021. Transforming growth factor-beta and liver injury in an arginine vasopressin-induced pregnant rat model. Clin Exp Reprod Med. 48(2):124. doi:https://doi.org/10.5653/cerm.2020.04035.
- Guelinckx I, Vecchio M, Perrier ET, Lemetais G. 2016. Fluid intake and vasopressin: connecting the dots. Ann Nutr Metab. 68(Suppl. 2):6–11. doi:https://doi.org/10.1159/000446198.
- Guida JP, Parpinelli MA, Surita FG, Costa ML. 2018. The impact of proteinuria on maternal and perinatal outcomes among women with pre-eclampsia. International Journal of Gynecology & Obstetrics. 143(1):101–107. doi:https://doi.org/10.1002/ijgo.12487.
- Gupta A, Bhandari N, Kharb S, Chauhan M. 2019. Lactate dehydrogenase levels in preeclampsia and its correlation with maternal and perinatal outcome. International Journal of Reproduction, Contraception, Obstetrics and Gynecology. 8(4):1506.
- Gutierrez C, Blanchard DG. 2004. Diastolic heart failure: the challenges of diagnosis and treatment. Am Fam Physician. 69(11):2609–2616.
- Haddad B, Kayem G, Deis S, Sibai BM. 2007. Are perinatal and maternal outcomes different during expectant management of severe preeclampsia in the presence of intrauterine growth restriction? Am J Obstet Gynecol. 196(3):237. e231-237. e235. https://doi.org/10.1016/j.ajog.2006.10.905.
- Hems DA, Whitton PD, Ma GY. 1975. Metabolic actions of vasopressin, glucagon and adrenalin in the intact rat. Biochimica Et Biophysica Acta (Bba)-general Subjects. 411(1):155–164. doi:https://doi.org/10.1016/0304-4165(75)90294-9.
- Hershkovitz R, Ohel I, Sheizaf B, Nathan I, Erez O, Sheiner E, Pinku A, Mazor M. 2005. Erythropoietin concentration among patients with and without preeclampsia. Arch Gynecol Obstet. 273(3):140–143. doi:https://doi.org/10.1007/s00404-005-0013-2.
- Hiroyama M, Aoyagi T, Fujiwara Y, Birumachi J, Shigematsu Y, Kiwaki K, Tasaki R, Endo F, Tanoue A. 2007. Hypermetabolism of fat in V1a vasopressin receptor knockout mice. Molecular Endocrinology. 21(1):247–258. doi:https://doi.org/10.1210/me.2006-0069.
- Hu D, Cross JC. 2009. Development and function of trophoblast giant cells in the rodent placenta. Int J Dev Biol. 54(2–3):341–354. doi:https://doi.org/10.1387/ijdb.082768dh.
- Huang S-HS, Sharma AP, Yasin A, Lindsay RM, Clark WF, Filler G. 2011. Hyperfiltration affects accuracy of creatinine eGFR measurement. Clinical Journal of the American Society of Nephrology. 6(2):274–280. doi:https://doi.org/10.2215/CJN.02760310.
- Huang X, Jain A, Baumann M, Körner M, Surbek D, Bütikofer P, Albrecht C. 2013. Increased placental phospholipid levels in pre-eclamptic pregnancies. Int J Mol Sci. 14(2):3487–3499. doi:https://doi.org/10.3390/ijms14023487.
- Indumati V, Kodliwadmath M, Sheela M. 2011. The role of serum electrolytes in pregnancy induced hypertension. Journal of Clinical and Diagnostic Research. 5(1):66–69.
- Jablonskis LT, Howe PR. 1993. Vasopressin compensates for acute loss of sympathetic pressor tone in spontaneously hypertensive rats. Clin Exp Pharmacol Physiol. 20(5):380–383. doi:https://doi.org/10.1111/j.1440-1681.1993.tb01711.x.
- Jeyabalan A. 2013. Epidemiology of preeclampsia: impact of obesity. Nutr Rev. 71(suppl_1):S18–S25. doi:https://doi.org/10.1111/nure.12055.
- Koop K, Eikmans M, Baelde HJ, Kawachi H, De Heer E, Paul LC, Bruijn JA. 2003. Expression of podocyte-associated molecules in acquired human kidney diseases. Journal of the American Society of Nephrology. 14(8):2063–2071. doi:https://doi.org/10.1097/01.ASN.0000078803.53165.C9.
- Koshimizu TA, Nakamura K, Egashira N, Hiroyama M, Nonoguchi H, Tanoue A. 2012. Vasopressin V1a and V1b receptors: from molecules to physiological systems. Physiol Rev. 92(4):1813–1864. doi:https://doi.org/10.1152/965physrev.00035.2011.
- Lee CR, Watkins ML, Patterson JH, Gattis W, O’Connor CM, Gheorghiade M, Adams JKF. 2003. Vasopressin: a new target for the treatment of heart failure. Am Heart J. 146(1):9–18. doi:https://doi.org/10.1016/S0002-8703(02)94708-3.
- Li G, Ma L, Lin L, Wang Y-l YH, Yang H. 2018. The intervention effect of aspirin on a lipopolysaccharide-induced preeclampsia-like mouse model by inhibiting the nuclear factor-κB pathway†. Biol Reprod. 99(2):422–432. doi:https://doi.org/10.1093/biolre/ioy025.
- Li J, LaMarca B, Reckelhoff JF. 2012. A model of preeclampsia in rats: the reduced uterine perfusion pressure (RUPP) model. American Journal of Physiology-Heart and Circulatory Physiology. 303(1):H1–H8. doi:https://doi.org/10.1152/ajpheart.00117.2012.
- Lima VJD, Andrade CRD, Ruschi GE, Sass N. 2011. Serum lipid levels in pregnancies complicated by preeclampsia. Sao Paulo Medical Journal. 129(2):73–76. doi:https://doi.org/10.1590/S1516-31802011000200004.
- Lorell BH, Carabello BA. 2000. Left ventricular hypertrophy: pathogenesis, detection, and prognosis. Circulation. 102(4):470–479. doi:https://doi.org/10.1161/01.CIR.102.4.470.
- Lu H, Dalgard CL, Mohyeldin A, McFate T, Tait AS, Verma A. 2005. Reversible inactivation of HIF-1 prolyl hydroxylases allows cell metabolism to control basal HIF-1. Journal of Biological Chemistry. 280(51):41928–41939. doi:https://doi.org/10.1074/jbc.M508718200.
- Macdonald-Wallis C, Tilling K, Fraser A, Nelson SM, Lawlor DA. 2014. Associations of blood pressure change in pregnancy with fetal growth and gestational age at delivery: findings from a prospective cohort. Hypertension. 64(1):36–44. doi:https://doi.org/10.1161/HYPERTENSIONAHA.113.02766.
- Makuyana D, Mahomed K, Shukusho F, Majoko F. 2002. Liver and kidney function tests in normal and pre-eclamptic gestation: a comparison with non-gestational reference values. Central African Journal of Medicine. 48(5/6):55–59.
- Manjareeka M, Nanda S. 2013. Elevated levels of serum uric acid, creatinine or urea in preeclamptic women. International Journal of Medical Science and Public Health. 2(1):43–47. doi:https://doi.org/10.5455/ijmsph.2013.2.43-47.
- Marshall SA, Hannan NJ, Jelinic M, Nguyen TPH, Girling JE, Parry LJ. 2018. Animal models of preeclampsia: translational failings and why. American Journal of Physiology-Regulatory, Integrative and Comparative Physiology. 314(4):R499–R508. doi:https://doi.org/10.1152/ajpregu.00355.2017.
- Mayer B, Nemeth K, Krepuska M, Myneni VD, Maric D, Tisdale JF, Hsieh MM, Uchida N, Lee HJ, Nemeth MJ, et al. 2017. Vasopressin stimulates the proliferation and differentiation of red blood cell precursors and improves recovery from anemia. Sci Transl Med. 9(418):eaao1632. doi:https://doi.org/10.1126/scitranslmed.aao1632
- Maynard SE, Min JY, Merchan J, Lim KH, Li J, Mondal S, Libermann TA, Morgan JP, Sellke FW, Stillman IE, et al. 2003. Excess placental soluble fms-like tyrosine kinase 1 (sFlt1) may contribute to endothelial dysfunction, hypertension, and proteinuria in preeclampsia. J Clin Invest. 111(5):649–658. doi:https://doi.org/10.1172/JCI17189
- Mayret-Mesquiti M, Pérez-Méndez O, Rodríguez ME, Fortoul TI, Gorocica P, Bernal-Alcántara D, Montaño LF, Alvarado-Vasquez N. 2007. Hypertriglyceridemia is linked to reduced nitric oxide synthesis in women with hypertensive disorders of pregnancy. Hypertens Pregnancy. 26(4):423–431. doi:https://doi.org/10.1080/10641950701521569.
- Mikolasevic I, Filipec-Kanizaj T, Jakopcic I, Majurec I, Brncic-Fischer A, Sobocan N, Hrstic I, Stimac T, Stimac D, Milic S. 2018. Liver disease during pregnancy: a challenging clinical issue. Medical Science Monitor: International Medical Journal of Experimental and Clinical Research. 24:4080–4090. doi:https://doi.org/10.12659/MSM.907723.
- Motta C, Grosso C, Zanuzzi C, Molinero D, Picco N, Bellingeri R, Alustiza F, Barbeito C, Vivas A, Romanini MC. 2015. Effect of Sildenafil on Pre-eclampsia-like mouse model induced by L-name. Reproduction in Domestic Animals. 50(4):611–616. doi:https://doi.org/10.1111/rda.12536.
- Müller-Deile J, Schiffer M. 2011. Renal involvement in preeclampsia: similarities to VEGF ablation therapy. J Pregnancy. vol 2011.
- Niromanesh S, Shirazi M, Dastgerdy E, Sharbaf F, Shirazi M, Khazaeipour Z. 2012. Association of hypertriglyceridaemia with pre-eclampsia, preterm birth, gestational diabetes and uterine artery pulsatility index. Natl Med J India. 25(5):265–267.
- Odegård RA, Vatten LJ, Nilsen ST, Salvesen KA, Austgulen R. 2000. Preeclampsia and fetal growth. Obstet Gynecol. 96(6):950–955.
- Özkara A, Kaya AE, Başbuğ A, Ökten SB, Doğan O, Çağlar M, Kumru S. 2018. Proteinuria in preeclampsia: is it important? Ginekol Pol. 89(5):256–261. doi:https://doi.org/10.5603/GP.a2018.0044.
- Patil S, Jyothi A, Babu A, Goud G. 2016. A study on Liver function tests and Renal function tests in Preeclampsia. International Journal of Biomedical Research. 10:713–717.
- Qian Q. 2018. Salt, water and nephron: mechanisms of action and link to hypertension and chronic kidney disease. Nephrology. 23:44–49. doi:https://doi.org/10.1111/nep.13465.
- Qublan H, Ammarin V, Bataineh O, Al-Shraideh Z, Tahat Y, Awamleh I, Khreisat B, Nussair B, Amarin Z. 2005. Lactic dehydrogenase as a biochemical marker of adverse pregnancy outcome in severe pre-eclampsia. Medical Science Monitor. 11(8):CR393–CR397.
- Rasmussen S, Irgens LM. 2003. Fetal growth and body proportion in preeclampsia. Obstet Gynecol. 101(3):575–583.
- Russell JA, Walley KR. 2010. Vasopressin and its immune effects in septic shock. J Innate Immun. 2(5):446–460. doi:https://doi.org/10.1159/000318531.
- Saha T, Halder M, Das A, Das SK. 2013. Role of nitric oxide, angiogenic growth factors and biochemical analysis in preeclampsia. Indian J Biochem Biophys. 50(5):462–466.
- Sandgren JA, Deng G, Linggonegoro DW, Scroggins SM, Perschbacher KJ, Nair AR, Nishimura TE, Zhang SY, Agbor LN, Wu J. 2018. Arginine vasopressin infusion is sufficient to model clinical features of preeclampsia in mice. JCI Insight. 3(19):19. doi:https://doi.org/10.1172/jci.insight.99403.
- Sandgren JA, Scroggins SM, Santillan DA, Devor EJ, Gibson-Corley KN, Pierce GL, Sigmund CD, Santillan MK, Grobe JL. 2015. Vasopressin: the missing link for preeclampsia? Am J Physiol Regul Integr Comp Physiol. 309(9):R1062–1064. doi:https://doi.org/10.1152/ajpregu.00073.2015.
- Santillan MK, Santillan DA, Scroggins SM, Min JY, Sandgren JA, Pearson NA, Leslie KK, Hunter SK, Zamba GK, Gibson-Corley KN. 2014. Vasopressin in preeclampsia: a novel very early human pregnancy biomarker and clinically relevant mouse model. Hypertension. 64(4):852–859. doi:https://doi.org/10.1161/HYPERTENSIONAHA.114.03848.
- Siddiqui IA, Jaleel A, Al Kadri HM, Al Saeed W, Tamimi W. 2011. Iron status parameters in preeclamptic women. Arch Gynecol Obstet. 284(3):587–591. doi:https://doi.org/10.1007/s00404-010-1728-2.
- Soares MJ, Chakraborty D, Kubota K, Renaud SJ, Rumi MK. 2014. Adaptive mechanisms controlling uterine spiral artery remodeling during the establishment of pregnancy. Int J Dev Biol. 58(2–3–4):247. doi:https://doi.org/10.1387/ijdb.140083ms.
- Sones JL, Davisson RL. 2016. Preeclampsia, of mice and women. Physiol Genomics. 48(8):565–572. doi:https://doi.org/10.1152/physiolgenomics.00125.2015.
- Song J, Martin DS. 2006. Rho kinase contributes to androgen amplification of renal vasoconstrictor responses in the spontaneously hypertensive rat. J Cardiovasc Pharmacol. 48(3):103–109. doi:https://doi.org/10.1097/01.fjc.0000245403.45406.d8.
- Spradley FT, Tan AY, Joo WS, Daniels G, Kussie P, Karumanchi SA, Granger JP. 2016. Placental growth factor administration abolishes placental ischemia-induced hypertension. Hypertension. 67(4):740–747. doi:https://doi.org/10.1161/HYPERTENSIONAHA.115.06783.
- Tanacan A, Fadiloglu E, Beksac MS. 2019. The importance of proteinuria in preeclampsia and its predictive role in maternal and neonatal outcomes. Hypertens Pregnancy. 38(2):111–118. doi:https://doi.org/10.1080/10641955.2019.1590718.
- Taveau C, Chollet C, Bichet DG, Velho G, Guillon G, Corbani M, Roussel R, Bankir L, Melander O, Bouby N. 2016. Acute and chronic hyperglycemic effects of vasopressin in normal rats involvement of V1A receptors. American Journal of Physiology-Endocrinology and Metabolism. 312(3):E127–E135. doi:https://doi.org/10.1152/ajpendo.00269.2016.
- Vrijkotte TG, Krukziener N, Hutten BA, Vollebregt KC, van Eijsden M, Twickler MB. 2012. Maternal lipid profile during early pregnancy and pregnancy complications and outcomes: the ABCD study. J Clin Endocrinol Metab. 97(11):3917–3925. doi:https://doi.org/10.1210/jc.2012-1295.
- Weiner E, Schreiber L, Grinstein E, Feldstein O, Rymer-Haskel N, Bar J, Kovo M. 2016. The placental component and obstetric outcome in severe preeclampsia with and without HELLP syndrome. Placenta. 47:99–104. doi:https://doi.org/10.1016/j.placenta.2016.09.012.
- White IPF, Wantania JJ, Mewengkang ME. 2019. Differences in serum lipid profile value in pregnancy and postpartum on severe preeclampsia. Indonesian Journal of Obstetrics and Gynecology. 7(1):15–20.
- Yeung EH, Liu A, Mills JL, Zhang C, Männistö T, Lu Z, Tsai MY, Mendola P. 2014. Increased levels of copeptin before clinical diagnosis of preeclampsia. Hypertension. 64(6):1362–1367. doi:https://doi.org/10.1161/HYPERTENSIONAHA.114.03762.
- Zhang C, Zhu Y, Shen Y, Zuo C. 2018. Aspirin ameliorates preeclampsia induced by a peroxisome proliferator-activated receptor antagonist. Reproductive Sciences. 25(12):1655–1662. doi:https://doi.org/10.1177/1933719118756746.
- Zhu M, Ren Z, Possomato-Vieira JS, Khalil RA. 2016. Restoring placental growth factor-soluble fms-like tyrosine kinase-1 balance reverses vascular hyper-reactivity and hypertension in pregnancy. American Journal of Physiology-Regulatory, Integrative and Comparative Physiology. 311(3):R505–R521. doi:https://doi.org/10.1152/ajpregu.00137.2016.
- Zulfikaroglu E, Islimye M, Tonguc EA, Payasli A, Isman F, Var T, Danisman N. 2011. Circulating levels of copeptin, a novel biomarker in pre-eclampsia. Journal of Obstetrics and Gynaecology Research. 37(9):1198–1202. doi:https://doi.org/10.1111/j.1447-0756.2010.01498.x.