
ABSTRACT
Androgen and AR are essential for maintaining spermatogenesis and male fertility. Previous studies have shown that the phosphatidyl ethanolamine binding protein 1 (Pebp1) gene is down-regulated in the selective ablation of the AR in the Sertoli cells of mouse testes compared with wild-type mice, indicating that Pebp1 is a candidate target of AR. The ChIP-PCR data and ChIP-sequencing results of this study verified that Pebp1 is a target gene regulated by AR. Real-time PCR, Western blot analysis, and immunofluorescence data showed that Pebp1 is expressed at all stages of testicular development, with an increasing trend from 1 to 8 weeks of postnatal development. PEBP1 was principally located in the cytoplasm, and high-intensity fluorescence revealed PEBP in the lumen of the testicular tubules. Bioinformatics analysis indicated effective androgen-responsive elements (AREs) located in the promotor of Pepb1 gene. Dual fluorescence assay data showed that androgens and AR could bind to the AREs of Pebp1 and induce an increase of gene expression. These data suggest that Pepb1 is a newfound target gene regulated by androgens and AR in mouse Sertoli cells. However, the detailed molecular mechanism of their role in spermatogenesis still needs to be further studied.
Abbreviations: AR: androgen receptor; Pebp1: phosphatidyl ethanolamine binding protein 1; ARKO: androgen receptor knockout; WT: wild type; SCARKO: Sertoli cell-selective androgen receptor knockout; ChIP: chromatin immunoprecipitation; RKIP: Raf kinase inhibitory protein; MAPK: mitogen-activated protein kinase; NF-κB: nuclear factor kappa-light-chain-enhancer of activated B cells; GSK-3: glycogen synthase kinase-3; RT-PCR: reverse transcriptase polymerase chain reaction; SEM: standard error of the mean
Introduction
Androgen and its receptor (AR) are essential for maintaining spermatogenesis and male fertility (Heinlein and Chang Citation2002; Heemers and Tindall Citation2007; Patrao et al. Citation2009). Spermatogenesis occurs in the seminiferous tubules of the testes and is supported by the somatic Sertoli cells that surround and nurture developing germ cells (Smith and Walker Citation2014). Testosterone produced by Leydig cells is the major androgen in the testes. AR belongs to the nuclear steroid hormone receptors family, which mediates the actions of steroid hormones, including embryonic development, metabolism, apoptosis and the maintenance of differentiated cellular phenotypes (Marino and Ascenzi Citation2006). Male AR knockout (ARKO) mice exhibited a female-typical appearance, and germ cell development is absolutely disrupted (Yeh et al. Citation2002). These data suggest that the action of androgens in Sertoli cells plays a key role in the regulation of spermatogenesis.
AR is capable of transmitting testosterone signals by classical and non-classical pathways. It has been proposed that only classical testosterone signaling is required for spermatogenesis since germ cell development is halted during meiosis in transgenic mice when exon 3 of the AR contains a portion of the DNA-binding domain, is removed (Lim et al. Citation2009). Transcriptional studies using ARKO mice have aimed to find AR-regulated genes involved in spermatogenesis, and they have identified several candidate genes, such as Rhox5 (Hu et al. Citation2010; MacLean and Wilkinson Citation2010), Tubb3 (De Gendt et al. Citation2011), and Ube2b (Mou et al. Citation2013). However, Rhox5 is the only widely accepted AR target gene. More studies are required to identify candidate genes involved in spermatogenesis. These genes may be used as a diagnostic tool or target in preventing and curing male infertility caused by spermatogenesis disorders.
Previous studies had identified some differentially expressed genes in the testes of wild-type (WT) mice and Sertoli cell-selective AR knockout (SCARKO) mice (Denolet et al. Citation2006; Eacker et al. Citation2007; Zhang et al. Citation2012b; De Gendt et al. Citation2014). Our previous digital gene expression data showed that the phosphatidyl ethanolamine binding protein 1 (Pebp1) is down-regulated in the SCARKO mice compared with WT mice (Zhang et al. Citation2012b), indicating Pebp1 as a candidate target of AR. PEBP1, which is also known as Raf kinase inhibitory protein (RKIP), binds ATP, opioids, and phosphatidylethanolamine. Furthermore, our chromatin immunoprecipitation (ChIP)-sequencing using primary Sertoli cell cultures from WT and ARKO mice testes confirmed the down-regulation of Pebp1. PEBP1 decreases the kinase activity of RAF1 by inhibiting its activation and dissociating the RAF1/MEK complex, acting as a competitive inhibitor of MEK phosphorylation. PEBP1 modulates multiple signaling pathways, including the mitogen-activated protein kinase (MAPK), nuclear factor kappa-light-chain-enhancer of activated B cells (NF-κB), and glycogen synthase kinase-3 (GSK-3) signaling pathways. Further, Pebp1 has been implicated in numerous human cancers and may act as a metastasis suppressor gene.
In the present study, we performed a detailed analysis of PEBP1 expression in the testes of mice. We demonstrated the developmental onset of PEBP1 expression during spermatogenesis in the testes of wild type and ARKO mice using Western blot analysis and immunofluorescence assay. Most importantly, we have provided the first evidence of Pebp1’s role in spermatogenesis, showing that Pebp1 is regulated by AR.
Results and discussion
ChIP-sequencing data and ChIP-qPCR results
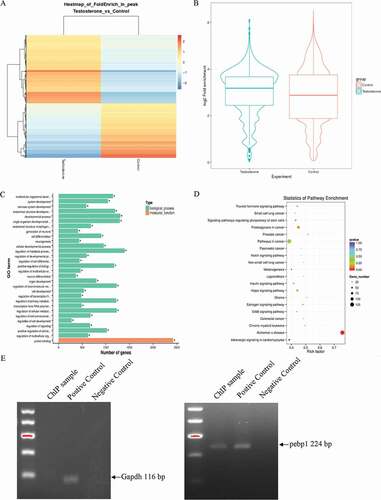
ChIP-sequencing was conducted to detect the expression profiles of Sertoli cells from WT mice (basal condition and testosterone-treated). Sertoli cells were collected following the previously described protocol (Chen et al. Citation2014; Chang et al. Citation2008), and ChIP-sequencing was performed as described in the Materials and Methods section. The ChIP samples were further examined, sequenced, and analyzed by Novogene (Beijing, China; ). Based on the fold enrich value (the ratio of RPM value in IP to rpm value in input), hierarchical clustering analysis is performed in . Rpm is the ratio of 1 m reads in a single sample to the peak. The fold enrich value (the ratio of RPM in IP to RPM in input) of each comparison group in the peak annotation area was calculated. The enrichment level of different IP experiments was displayed by boxplot in . At the same time, we carried out GO enrichment analysis () and KEGG enrichment analysis () for genes related to different peaks. GO enrichment showed their genes are enriched in developmental process, metabolic process, regulation of signaling, and protein binding. In , there genes are enriched in signaling pathway and tumorigenesis. Bioinformatics analysis indicated effective androgen-responsive elements (AREs) located in the promotor of Pepb1 gene (ARE: −1516/-1520). Primers were designed and synthesized against the promoter of Pebp1. The ChIP- quantitative polymerase chain reaction (qPCR) data using Pebp1 primers (F: 5ʹ-AGC CTC AAC CAA GAT CCA GC-3ʹ, R: 5ʹ-CCG GAG ATA AGG CCA TGC TT-3ʹ) showed target bands by agarose electrophoresis ().
Figure 1. Analysis of ChIP-sequencing data. (A) Analysis of different experimental peak enrichment levels. (B) Boxplot of the density distribution of different experimental reads in the peak annotation area. (C) Gene Ontology (GO) enrichment analysis of peak difference genes. (D) Kyoto Encyclopedia of Genes and Genomes (KEGG) enrichment analysis of peak difference genes. (E) ChIP analysis shows AR bound to the Pebp1 promoter in the Sertoli cells.
Collective evidence indicates that PEBP1 functions as a multi-faceted regulator controlling various cellular processes, including cell differentiation, the cell cycle, apoptosis, and cell migration (Zeng et al. Citation2008). hRKIP is an important modulator of the Ras/Raf1/MEK/ERK signaling pathway, and RKIP down-regulates the Ras/Raf/MEK/ERK pathway by directly binding with the Raf1 kinase (Guo et al. Citation2018). PEBP1 is an important endogenous modulator of many kinases and the predominant protein of recent oncology research (Wang et al. Citation2018).
Pebp1 mRNA expression was decreased in the testes of ARKO mice
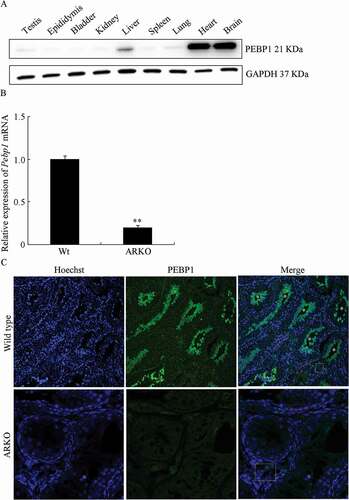
Western blot analysis data () showed that the PEBP1 protein was dominantly expressed in the heart and brain, but it could also be detected in the liver, lung, and testis. To verify the previous digital gene expression analysis results, the expression of Pebp1 mRNA and the PEBP1 protein were examined in the testes of WT and ARKO mice by RT-qPCR and Western blotting. Compared with WT mice, Pebp1 mRNA was decreased to 0.20-fold (P < 0.01) in the testes of ARKO mice (). In the testes of WT mice (), high-intensity fluorescence (green) was found in the lumen of testicular tubules. However, even very low-intensity green fluorescence could not be seen in the testes of ARKO mice. Pebp1 mRNA expression and immunofluorescence brightness in ARKO mice was significantly lower than in WT mice, which is in agreement with the digital gene expression data and ChIP-sequencing results.
Figure 2. Decreased expression of Pebp1 mRNA and the PEBP1 protein in the testes of ARKO mice. (A) PEBP1 expression in different mouse tissues. (B) The expression of Pebp1 mRNA in the testes of WT and ARKO mice was examined by RT-qPCR. The mean value of WT Pebp1 mRNA was set as 1. Data are expressed as the mean ± SEM (**P < 0.01, n = 4). (C) The expression and localization of PEBP1 in mice testes was detected by immunofluorescence. PBPE1 and the nucleus were labeled as green and blue, respectively (n = 4). In the merge figures, * represents the adluminal compartment of seminiferous tubules, red dotted elliptical shape shows Sertoli cells, yellow dotted rectangle shows Leydig cells.
Expression of Pebp1 mRNA and PEBP1 protein localization during testis development
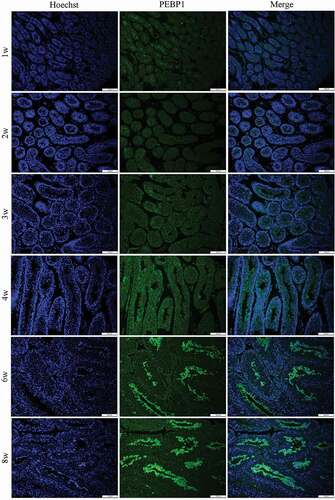
RT-qPCR and immunofluorescent staining were used to examine the expression pattern of Pebp1 during testis development. As shown in , Pebp1 was expressed at all stages of testicular development and showed an increasing trend from 1 to 8 weeks of postnatal development, which is consistent with the Western blot analysis results (). The expression of Pebp1 mRNA and the PEBP1 protein begins in the testes of mice 3 or 4 weeks after birth, when the first wave of spermatogenesis occurs, which indicates the potential role of PEBP1 in spermatogenesis. This was confirmed by the immunofluorescence, which revealed that PEBP1 was principally located in the adluminal compartment of seminiferous tubules at 6 and 8 weeks ().
Figure 3. Expression characterization of PEBP1 during testis development. (A) RT-qPCR analysis was used to detect Pebp1 mRNA in developing postnatal mouse testes. The relative expression of Pebp1 at different stages of testis development was compared to 1 week (w). Gapdh was used as an internal control. Data are expressed as the mean± SEM (n = 4). (B) PEBP1 protein expression was detected by Western blot analysis. GAPDH (36 kDa) was used as an internal control.
Figure 4. Immunofluorescence localization of PEBP1 in mouse testes. The nuclei of the cells were labeled with Hoechst 33,342 (blue).
Immunofluorescence data showed no positive localization indicative of PEBP1 expression in mouse sperm (data not shown). PEBP1 might be a key regulator in the elongation of spermatids. The PEBP1 protein is an important regulatory factor in the MAPK signaling transduction pathway, and its ligand Raf-1 can regulate the cell cycle of mitotic cells (Ziogas et al. Citation1998). Eves et al. (Eves et al. Citation2006) reported the lack of RKIP protein expression in hepatoma cells, which can lead to rapid cell division and increased cell proliferation instability (Lee et al. Citation2006). Nevertheless, PEBP1 can regulate the β-adrenergic pathway and the NF-κB pathway (Odabaei et al. Citation2004; Skinner and Rosner Citation2014; Montagnani et al. Citation2017). PEBP1 may be involved in mammalian spermatogenesis and male fertility (Bollengier and Mahler Citation1988; Frayne et al. Citation1999; Moffit et al. Citation2007). PEBP1 is present in higher abundance in sperm from high-fertility bulls (Kasimanickam et al. Citation2019), compared with low-fertility bulls. This data is consistent with a previous study (Arangasamy et al. Citation2011).In mice, PEBP1 appears to have an inhibitory effect on sperm capacitation (Nixon et al. Citation2006). It acts either as a decapacitation factor released during capacitation (Nixon et al. Citation2006) or as a membrane-bound, glycophosphatidylinositol anchored receptor for a decapacitation factor (Gibbons et al. Citation2005).
In vitro activation of Pebp1 promoter activity by testosterone
To evaluate whether the AR and testosterone affected Pebp1 transcription, we used a luciferase assay to measure Pebp1 promoter-driven luciferase activity. As shown in , TM4 cells were treated with testosterone or ethanol, and the luciferase activity of the empty vector had no difference after testosterone exposure. Luciferase activity was significantly increased when Pebp1 and testosterone were present (P< 0.01). This data indicated that AR and testosterone probably increased the promoter activity of Pebp1. A study conducted by Zhang showed that the induction of Pebp1 by androgens does not require de novo protein synthesis, suggesting that the expression of these transcripts is regulated directly by androgen rather than through intermediary transcription factors (Zhang et al. Citation2012a).
Figure 5. Increased Pebp1 promoter activity by AR and testosterone in TM4 cells. Dual luciferase assay was used to detect the effects of testosterone on Pebp1 promoter activity in TM4 cells. The control was performed with the empty vector. The results are presented as the fold-change of testosterone treatment relative to vehicle treatment. The data are expressed as the mean ± SEM (n = 3). **, P < 0.01.
Regulation of the AR expression by PEBP1
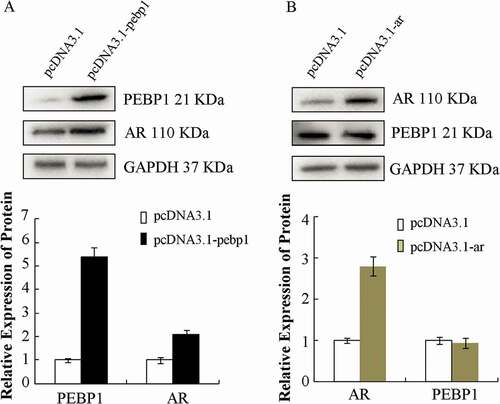
To assess whether PEBP1PEBP1 could regulate testosterone and AR could regulate testosterone and AR, TM4 cells were transiently transfected with pcDNA3.1-pebp1 (pcDNA3.1 vector inserted with peb1 gene, 6765 bp, Shanghai Genechem Co. Ltd) and treated with 10 nM of testosterone for 24 h. Compared with the cells transfected with the empty vector, AR expression was increased (). However, we could not find any PEBP1 increase in the cells with pcDNA3.1-ar (pcDNA3.1 vector inserted with ar gene, 8348 bp, kindly provided by H. Guo (Guo et al. Citation2015)) compared with the empty vector (). AR was up-regulated by the over-expression of Pebp1; however, the knock in of AR had no significant effect on PEBP1 expression. This was consistent with the result that showed no difference in the PEBP1 protein level in the two types of mice (ARKO and WT). The possible molecular mechanism involved in the PEBP1 protein level is still controversial. Combined, the finding in the study, we speculated that the protein might be degraded by an AR-dependent pathway or be recruited and secreted into spermatids. Since lacking an effective time-course study examinind the effect of the AR on Pebp1 expression, it is possible that the protein level increased at some specific time. Further studies are needed to clarify the mechanism.
Figure 6. AR was up-regulated by overexpression of PEBP1. Cells were transfected with pcDNA-pebp1 (A) or pcDNA-ar (B), and Western blot analysis was used to detect PEBP1 and AR expression. The data in the bar graph are expressed as the mean ± SEM (n = 3).
Androgen and its receptor can up-regulate Pebp1. Androgens induce PEBP1 expression through AR-mediated transcriptional modulation of the Pebp1 promoter in the prostate (Zhang et al. Citation2012a). PEBP1 expression is noticeably reduced and the staining is heterogeneous in primary prostate cancer, whereas metastases are PEBP1-negative or show weak PEBP1 staining (Fu et al. Citation2006). PEBP1 is involved with epithelial-to-mesenchymal transition and autophagy as part of the same functional unit in developing prostate cancer (Ahmed et al. Citation2018).
In conclusion, we demonstrated that Pebp1 was regulated by AR and that the expression of Pebp1 mRNA and the PEBP1 protein were downregulated in the testes of ARKO mice. Furthermore, Pebp1 promoter-driven luciferase activity was significantly repressed by AR and testosterone treatment. These data indicate that Pebp1 has a critical role in spermatogenesis and male fertility. Further studies on the molecular mechanisms involved are needed to help us understand how Pebp1 is involved in spermatogenesis, as well as the precise mechanism.
Materials and methods
Animals
Mice (C57BL) were purchased from the Guangdong Province Experimental Animal Center, China. ARKO mice came from Dr. Yaoting Gui’s Laboratory, Peking University Shenzhen Hospital, as a kind gift from Dr. Xingxu Huang, Shanghai Tech University.
Tissue collection
Testes were collected from adult ARKO mice and 1- to 8- week-old C57BL/6 mice. Other organs, including the epididymis, bladder, kidney, liver, spleen, lung, heart, and brain, were collected from adult C57BL/6 mice.
RT-PCR
Total RNAs was extracted using TRIzol per the manufacturer’s directions, and cDNA synthesis was carried out using the Prime ScriptTM RT Master Mix kit (Takara, Beijing, China). End-point reverse transcriptase (RT) polymerase chain reaction (PCR) was carried out using EmeraldAmp PCR Master Mix (Takara, Beijing, China) with primers specific for mouse Pebp1 (F: 5ʹ – AGC AGC ATT TCA TGG GAC G – 3ʹ, R: 5ʹ – TAC ACC AGC CAG ACA TAG CG – 3ʹ, 224 bp), with mouse Gapdh as the endogenous control (F: 5ʹ- GAG GCC GGT GCT GAG TAT GTC GTG-3ʹ, R: 5ʹ- TCG GCA GAA GGG GCG GAG AT-3ʹ, 116 bp). All PCR was performed at 98 °C for 2 min, 98 °C for 10 s, 60 °C for 30 s, and 72 °C for 30 s, with 36 cycles, and finally at 72 °C for 10 min. Data were calculated according to the Applied Biosystems comparative Ct method (Schmittgen and Livak Citation2008).
Western blot analysis
Proteins were extracted using RIPA Lysis Buffer (Beyotime Biotechnology, Shanghai, China) and quantified with the Pierce™ BCA Protein Assay Kit (Thermo Scientific, Waltham, MA, USA). After being denatured at 98°C for 10 min, the samples were electrophoresed with 10% sodium dodecyl sulfate polyacrylamide gel electrophoresis (SDS-PAGE) and transferred onto Immobilon PVDF membranes (Millipore, MD, USA). Anti-PEBP1 antibody (GTX12076; Genetex, Irvine, CA, USA) was used at a 1:1000 dilution overnight at 4 °C, followed by incubation with horseradish peroxidase-conjugated goat anti-rabbit immunoglobulin G (IgG) (sc-2030, Santa Cruz Biotechnology, Dallas, TX, USA) at 1:1000 dilution for 1 h at room temperature. Positive bands were detected using an enhanced chemiluminescence kit (Thermo Scientific, Waltham, MA, USA). AR antibody was from Santa Cruz Biotechnology (1: 1000, sc-816, Dallas, TX, USA), and GAPDH antibody was from Cell Signaling Technologies (1: 1000, #5174, Danvers, MA, USA).
Immunofluorescence
For immunofluorescent staining, the testes were dehydrated in a sucrose gradient, followed by embedding with O.C.T. Compound (Sakura, Oakland, CA, USA), and they were directly fixed in liquid nitrogen. The testes were then sectioned with a 5-µm thickness with a freezing microtome (Leica, Bensheim, Germany). The immunofluorescent staining of the sections was performed as described previously [33–37]. Nuclei were visualized by staining with Hoechst33342 (Invitrogen, Carlsbad, CA, USA). The results were visualized with a laser scanning confocal microscope (Zeiss, Jena, Germany).
Dual luciferase assay
Eighteen hours after transfection with the Pebp1 construct (−2000 to 0 site of the promoter region) and empty vector, which were provided by Shanghai Genechem Co. Ltd, Cos-7 cells were cultured overnight in serum-free medium (0.1% BSA) for 6 h before the addition of 10 nM of testosterone (Meilune, Dalian, China). After another 6 h of incubation and removal of the medium, the cells were lysed by adding 100 μL of passive lysis buffer (Promega, Madison, WI, USA). Luciferase activity was measured using the Dual Luciferase System (Promega, Madison, WI, USA), as described in the handbook.
ChIP Assay
Sertoli cells were collected following the protocol previously described (Chen et al. Citation2014; Chang et al. Citation2008). We added 1% formaldehyde solution to the confluent cells, and then the cells were incubated on a shaking platform for 10 min at room temperature. Glycine (final concentration 0.125 M) was applied to stop fixation, and the cells were rinsed with ice-cold phosphate-buffered saline twice. The cells were collected using a cell lifter, and the pellets were resuspended in lysis buffer and incubated for 10 min on ice. The cells were transferred to an ice-cold Dounce homogenizer, with 30 strokes on ice to release the nuclei. After centrifuging for 10 min at 2400 g at 4°C, the samples were sonicated for 30 min (Bioruptor setting: high, 30 s on, 30 s off, 1 min per cycle). The supernatant was collected by centrifuging at 13,000 g for 10 min at 4°C. Then, the protocol provided with ChIP kit-One Step (ab117138, Abcam, Cambridge, MA, USA) was followed. Briefly, we set up the ChIP reactions by adding the reagents (ChIP buffer, chromatin, antibodies (AR, ab74272, abcam; AR, sc-816, Santa Cruz Biotechnology), RNA ploymerase, and non-immnue IgG) to each well, sealing the wells, and incubating at room temperature for 120 min on an orbital shaker. Then, 4 washes with 200 μL of wash buffer and 1 wash with DNA release buffer were performed, and then the wells were incubated with 40 μL of DNA Release-PK solution at 65°C for 20 min and 95°C for 10 min. Finally, the samples were cooled at room temperature, briefly spun down, and ready for use.
Statistical analysis
Data were presented as mean ± standard error of the mean (SEM) of the values obtained in the number of observations indicated in the text and figure legends. The statistical analysis was conducted using SigmaPlot (https: //systatsoftware.com/ products/sigmaplot/). The statistical significance of differences between groups was determined using an independent t tests or one-/two-way analysis of variance (ANOVA) followed by protected Fisher’s least significant difference post hoc tests, as specified in the figure legends. Statistical significance was set at P < 0.05.
Ethics approval for animal study
All the mice were treated according to the Guide for the Care and Use of Laboratory Animals prepared by the Institute of Laboratory Animal Resources for the National Research Council. The study was approved by the ethics committee of the People’s Hospital of Longhua, Shenzhen.
Availability of data and material
The datasets used and/or analysed during the current study available from the corresponding author on reasonable request.
Authors’ contributions
All of the listed authors participated in conducting the experiments, data analysis, and manuscript preparing. Received grants: QD; reviewed and revised the manuscript: HL.
Acknowledgment
The authors thank Huan Guo for the pcDNA3.1-ar vector, and Prof. Gui for the ARKO mice.
Disclosure statement
No potential conflict of interest was reported by the author(s).
Additional information
Funding
References
- Ahmed M, Lai TH, Zada S, Hwang JS, Pham TM, Yun M, Kim DR. 2018. Functional linkage of RKIP to the epithelial to mesenchymal transition and autophagy during the development of prostate cancer. Cancers (Basel):10.
- Arangasamy A, Kasimanickam VR, DeJarnette JM, Kasimanickam RK. 2011. Association of CRISP2, CCT8, PEBP1 mRNA abundance in sperm and sire conception rate in Holstein bulls. Theriogenology. 76(3):570–577. doi:https://doi.org/10.1016/j.theriogenology.2011.03.009.
- Bollengier F, Mahler A. 1988. Localization of the novel neuropolypeptide h3 in subsets of tissues from different species. J Neurochem. 50:1210–1214. doi:https://doi.org/10.1111/j.1471-4159.1988.tb10594.x.
- Chang H, Gao F, Guillou F, Taketo MM, Huff V, Behringer RR. 2008. Wt1 negatively regulates β-catenin signaling during testis development. Development. 135(10):1875–1885. doi:https://doi.org/10.1242/dev.018572.
- Chen M, Wang X, Wang Y, Zhang L, Xu B, Lv L, Cui X, Li W, Gao F. 2014. Wt1 is involved in leydig cell steroid hormone biosynthesis by regulating paracrine factor expression in mice. Biol Reprod. 90(4):71. doi:https://doi.org/10.1095/biolreprod.113.114702.
- De Gendt K, Denolet E, Willems A, Daniels VW, Clinckemalie L, Denayer S, Wilkinson MF, Claessens F, Swinnen JV, Verhoeven G. 2011. Expression of Tubb3, a beta-tubulin isotype, is regulated by androgens in mouse and rat Sertoli cells. Biol Reprod. 85(5):934–945. doi:https://doi.org/10.1095/biolreprod.110.090704.
- De Gendt K, Verhoeven G, Amieux PS, Wilkinson MF. 2014. Genome-wide identification of AR-regulated genes translated in Sertoli cells in vivo using the RiboTag approach. Mol Endocrinol. 28:575–591. doi:https://doi.org/10.1210/me.2013-1391.
- Denolet E, De Gendt K, Allemeersch J, Engelen K, Marchal K, Van Hummelen P, Tan KA, Sharpe RM, Saunders PT, Swinnen JV, et al. 2006. The effect of a sertoli cell-selective knockout of the androgen receptor on testicular gene expression in prepubertal mice. Mol Endocrinol. 20(2):321–334. doi:https://doi.org/10.1210/me.2005-0113.
- Eacker SM, Shima JE, Connolly CM, Sharma M, Holdcraft RW, Griswold MD, Braun RE. 2007. Transcriptional profiling of androgen receptor (AR) mutants suggests instructive and permissive roles of AR signaling in germ cell development. Mol Endocrinol. 21(4):895–907. doi:https://doi.org/10.1210/me.2006-0113.
- Eves EM, Shapiro P, Naik K, Klein UR, Trakul N, Rosner MR. 2006. Raf kinase inhibitory protein regulates Aurora B kinase and the spindle checkpoint. Mol Cell. 23(4):561–574. doi:https://doi.org/10.1016/j.molcel.2006.07.015.
- Frayne J, Ingram C, Love S, Hall L. 1999. Localisation of phosphatidylethanolamine-binding protein in the brain and other tissues of the rat. Cell Tissue Res. 298(3):415–423. doi:https://doi.org/10.1007/s004410050064.
- Fu Z, Kitagawa Y, Shen R, Shah R, Mehra R, Rhodes D, Keller PJ, Mizokami A, Dunn R, Chinnaiyan AM, et al. 2006. Metastasis suppressor gene Raf kinase inhibitor protein (RKIP) is a novel prognostic marker in prostate cancer. Prostate. 66(3):248–256. doi:https://doi.org/10.1002/pros.20319.
- Gibbons R, Adeoya-Osiguwa SA, Fraser LR. 2005. ‘A mouse sperm decapacitation factor receptor is phosphatidylethanolamine-binding protein 1ʹ. Reproduction. 130(4):497–508. doi:https://doi.org/10.1530/rep.1.00792.
- Guo C, Chang T, Sun T, Wu Z, Dai Y, Yao H, Lin D. 2018. Anti-leprosy drug Clofazimine binds to human Raf1 kinase inhibitory protein and enhances ERK phosphorylation. Acta Biochim Biophys Sin (Shanghai). 50(10):1062–1067. doi:https://doi.org/10.1093/abbs/gmy095.
- Guo H, Li Y, Luo M, Lin S, Chen J, Ma Q, Gu Y, Jiang Z, Gui Y. 2015. Androgen receptor binding to an androgen-responsive element in the promoter of the Srsf4 gene inhibits its expression in mouse Sertoli cells. Mol Reprod Dev. 82:976–985. doi:https://doi.org/10.1002/mrd.22576.
- Heemers HV, Tindall DJ. 2007. Androgen receptor (AR) coregulators: a diversity of functions converging on and regulating the AR transcriptional complex. Endocr Rev. 28:778–808. doi:https://doi.org/10.1210/er.2007-0019.
- Heinlein CA, Chang C. 2002. Androgen receptor (AR) coregulators: an overview. Endocr Rev. 23(2):175–200. doi:https://doi.org/10.1210/edrv.23.2.0460.
- Hu Z, Dandekar D, O’Shaughnessy PJ, De Gendt K, Verhoeven G, Wilkinson MF. 2010. Androgen-induced Rhox homeobox genes modulate the expression of AR-regulated genes. Mol Endocrinol. 24(1):60–75. doi:https://doi.org/10.1210/me.2009-0303.
- Kasimanickam RK, Kasimanickam VR, Arangasamy A, Kastelic JP. 2019. Sperm and seminal plasma proteomics of high- versus low-fertility Holstein bulls. Theriogenology. 126:41–48. doi:https://doi.org/10.1016/j.theriogenology.2018.11.032.
- Lee HC, Tian B, Sedivy JM, Wands JR, Kim M. 2006. Loss of Raf kinase inhibitor protein promotes cell proliferation and migration of human hepatoma cells. Gastroenterology. 131(4):1208–1217. doi:https://doi.org/10.1053/j.gastro.2006.07.012.
- Lim P, Robson M, Spaliviero J, McTavish KJ, Jimenez M, Zajac JD, Handelsman DJ, Allan CM. 2009. Sertoli cell androgen receptor DNA binding domain is essential for the completion of spermatogenesis. Endocrinology. 150(10):4755–4765. doi:https://doi.org/10.1210/en.2009-0416.
- MacLean JA 2nd, Wilkinson MF. 2010. The Rhox genes. Reproduction. 140(2):195–213. doi:https://doi.org/10.1530/REP-10-0100.
- Marino M, Ascenzi P. 2006. Steroid hormone rapid signaling: the pivotal role of S-palmitoylation. IUBMB Life. 58(12):716–719. doi:https://doi.org/10.1080/15216540601019485.
- Moffit JS, Boekelheide K, Sedivy JM, Klysik J. 2007. Mice lacking Raf kinase inhibitor protein-1 (RKIP-1) have altered sperm capacitation and reduced reproduction rates with a normal response to testicular injury. J Androl. 28(6):883–890. doi:https://doi.org/10.2164/jandrol.107.002964.
- Montagnani F, Di Leonardo G, Pino M, Perboni S, Ribecco A, Fioretto L. 2017. Protracted Inhibition of Vascular Endothelial Growth Factor Signaling Improves Survival in Metastatic Colorectal Cancer: a Systematic Review. J Transl Int Med. 5:18–26. doi:https://doi.org/10.1515/jtim-2017-0005.
- Mou L, Zhang Q, Wang Y, Zhang Q, Sun L, Li C, Huang W, Yuan Y, Duan Y, Diao R, et al. 2013. Identification of Ube2b as a novel target of androgen receptor in mouse sertoli cells. Biol Reprod. 89(2):32. doi:https://doi.org/10.1095/biolreprod.112.103648.
- Nixon B, MacIntyre DA, Mitchell LA, Gibbs GM, O’Bryan M, Aitken RJ. 2006. The identification of mouse sperm-surface-associated proteins and characterization of their ability to act as decapacitation factors. Biol Reprod. 74(2):275–287. doi:https://doi.org/10.1095/biolreprod.105.044644.
- Odabaei G, Chatterjee D, Jazirehi AR, Goodglick L, Yeung K, Bonavida B. 2004. Raf-1 kinase inhibitor protein: structure, function, regulation of cell signaling, and pivotal role in apoptosis. Adv Cancer Res. 91:169–200.
- Patrao MT, Silva EJ, Avellar MC. 2009. Androgens and the male reproductive tract: an overview of classical roles and current perspectives. Arq Bras Endocrinol Metabol. 53(8):934–945. doi:https://doi.org/10.1590/S0004-27302009000800006.
- Schmittgen TD, Livak KJ. 2008. Analyzing real-time PCR data by the comparative C(T) method. Nat Protoc. 3:1101–1108. doi:https://doi.org/10.1038/nprot.2008.73.
- Skinner JJ, Rosner MR. 2014. RKIP structure drives its function: a three-state model for regulation of RKIP. Crit Rev Oncog. 19:483–488. doi:https://doi.org/10.1615/CritRevOncog.2014012001.
- Smith LB, Walker WH. 2014. The regulation of spermatogenesis by androgens. Semin Cell Dev Biol. 30:2–13. doi:https://doi.org/10.1016/j.semcdb.2014.02.012.
- Wang Y, Chen JJ, Wang XF, Wang Q. 2018. Clinical and prognostic significance of Raf kinase inhibitory protein expression in gastrointestinal stromal tumors. World J Gastroenterol. 24:2508–2517. doi:https://doi.org/10.3748/wjg.v24.i23.2508.
- Yeh S, Tsai MY, Xu Q, Mu XM, Lardy H, Huang KE, Lin H, Yeh SD, Altuwaijri S, Zhou X, et al. 2002. Generation and characterization of androgen receptor knockout (ARKO) mice: an in vivo model for the study of androgen functions in selective tissues. Proc Natl Acad Sci U S A. 99:13498–13503.
- Zeng L, Imamoto A, Rosner MR. 2008. Raf kinase inhibitory protein (RKIP): a physiological regulator and future therapeutic target. Expert Opin Ther Targets. 12(10):1275–1287. doi:https://doi.org/10.1517/14728222.12.10.1275.
- Zhang H, Wu J, Keller JM, Yeung K, Keller ET, Fu Z. 2012a. Transcriptional regulation of RKIP expression by androgen in prostate cells. Cell Physiol Biochem. 30(6):1340–1350. doi:https://doi.org/10.1159/000343323.
- Zhang QX, Zhang XY, Zhang ZM, Lu W, Liu L, Li G, Cai ZM, Gui YT, Chang C. 2012b. Identification of testosterone-/androgen receptor-regulated genes in mouse Sertoli cells. Asian J Androl. 14:294–300. doi:https://doi.org/10.1038/aja.2011.94.
- Ziogas A, Lorenz IC, Moelling K, Radziwill G. 1998. Mitotic Raf-1 is stimulated independently of Ras and is active in the cytoplasm. J Biol Chem. 273(37):24108–24114. doi:https://doi.org/10.1074/jbc.273.37.24108.