
 ?Mathematical formulae have been encoded as MathML and are displayed in this HTML version using MathJax in order to improve their display. Uncheck the box to turn MathJax off. This feature requires Javascript. Click on a formula to zoom.
Abstract
The differential expression and direct targeting of mRNA by miRNA are two main logics of the traditional approach to constructing the miRNA-mRNA network. This approach, could be led to the loss of considerable information and some challenges of direct targeting. To avoid these problems, we analyzed the rewiring network and constructed two miRNA-mRNA expression bipartite networks for both normal and primary prostate cancer tissue obtained from PRAD-TCGA. We then calculated beta-coefficient of the regression-model when miR was dependent and mRNA independent for each miR and mRNA and separately in both networks. We defined the rewired edges as a significant change in the regression coefficient between normal and cancer states. The rewired nodes through multinomial distribution were defined and network from rewired edges and nodes was analyzed and enriched. Of the 306 rewired edges, 112(37%) were new, 123(40%) were lost, 44(14%) were strengthened, and 27(9%) weakened connections were discovered. The highest centrality of 106 rewired mRNAs belonged to PGM5, BOD1L1, C1S, SEPG, TMEFF2, and CSNK2A1. The highest centrality of 68 rewired miRs belonged to miR-181d, miR-4677, miR-4662a, miR-9.3, and miR-1301. SMAD and beta-catenin binding were enriched as molecular functions. The regulation was a frequently repeated concept in the biological process. Our rewiring analysis highlighted the impact of β-catenin and SMAD signaling as also some transcript factors like TGFB1I1 in prostate cancer progression. Altogether, we developed a miRNA-mRNA co-expression bipartite network to identify the hidden aspects of the prostate cancer mechanism, which traditional analysis -like differential expression- was not detect it.
Introduction
There were several factors that disturb the function of the genes, leading the normal cells to tumors and making cancer a complex disease. MicroRNAs, as endogenous and small non-coding RNAs, play critical roles in gene regulation of cell development, cell proliferation, cell survival, and apoptosis functions, either oncogenes or tumor suppressors under certain conditions (He and Hannon Citation2004; Bentwich et al. Citation2005; Meltzer Citation2005). The stimulatory, inhibitory, or promoting role of miRNAs is lesser known but, the miRNA binding mechanism could determine this role. Inhibitory action of miRNA is likely by way of direct DNA or mRNA 3'UTR binding (Jopling et al. Citation2005) and through a combination of the mechanisms including direct mRNA degradation, deadenylation, initiation repression, ribosomal stalling, ribosomal drop-off, co- translational degradation, and translation repression following DNA binding. However, it's direct binding to DNA directly or to mRNA 5’UTR may promote transcription (Zhang et al. Citation2013).
β-catenin is a core component of the complex of proteins that constitutes adherens junctions, which is essential for the stabilization and activation of the Wnt/β-catenin signaling pathway (Bakhshandeh et al. Citation2012; Pai et al. Citation2017). Perturbation in this pathway may involve various tumors or neoplasm like colorectal (Cheng et al. Citation2019), breast (Krishnamurthy and Kurzrock Citation2018), ovarian (Arend et al. Citation2013), bladder (Zhou et al. Citation2019), and prostate cancer as well (Murillo-Garzon and Kypta Citation2017). Schneider JA and Logan SK previously discussed the crosstalk between Wnt/β-catenin signaling and androgen receptors which highlights the role of β-catenin (Schneider and Logan Citation2018). Androgen receptor regulates gene expressions with diverse functions located downstream of the androgen response element, including secreted proteins, growth stimulators, transcription factors, and cell cycle regulators (Fujita and Nonomura Citation2019). Epithelial androgen receptor, in normal prostate, acts to supply secretory proteins to the prostate gland, such as prostate-specific antigen and stromal androgen receptor plays a role in prostate growth (Fujita and Nonomura Citation2019).
There are many microRNAs that directly regulate the Wnt/β-catenin signaling pathway in prostate cancer. The miR-744 is known as an oncogenic factor (Guan et al. Citation2017), miR-454 blocks the activation of Wnt signaling by suppressing the β-catenin expression (Fu et al. Citation2018). The miR-939 is a tumor suppressor at the Wnt/β-catenin pathway (Situ et al. Citation2020). Also, there are some other microRNAs that indirectly affect Wnt/β-catenin signaling. For example, miR‐195 is sponging by some LncRNAs and dysregulates the mentioned pathway (Song et al. Citation2019). The miR-496 is another one that indirectly regulates the Wnt/β-catenin pathway and this function is detected by bioinformatics analysis (Song et al. Citation2019).
Biological networks are dynamic ones and with high variety because of disturbances (noises) that come from different sources like the environment. In systems biology, various methods and algorithms (Mousavian, Diaz, et al. Citation2016; Mousavian, Kavousi, et al. Citation2016) are proposed to evaluate the macromolecule interactions (Lanjanian et al. Citation2021), detected novel biomarkers for early detection of cancers (Kouhsar et al. Citation2019) and repurpose the known drugs for different treatments (Kouhsar et al. Citation2019; Masoudi-Sobhanzadeh et al. Citation2019b, Citation2019a, Citation2020). So, the networks are repeatedly rewired to be compatible with the stresses (Mitra et al. Citation2013). Rewiring is defined as the changes in network topology from one state to another such as normal to cancer states (Barabasi et al. Citation2011). In other words, different molecules can continue to work by finding new pathways or molecules to play various roles (Ideker and Krogan Citation2012). For example, experiments have shown that different regulatory components may be activated or deactivated under different conditions and represent highly dynamic entities contrary to their static appearance (Creixell et al. Citation2012).
Traditional logic in gene interaction studies is “guilt by association” based on the hypothesis that the genes with the common function in cell biology have the same profile of expression as the co-expression networks (Gillis and Pavlidis Citation2012). The co-expression network is constructed at one static state and it has inconsistency with the dynamicity of biological networks, so recently “guilt by rewiring” was nominated as new logic to study gene interaction networks (Hou et al. Citation2014). Dynamicity for responding to external stress is one of the characteristics of biological networks that leads to changes in network topology. Change in the network topology was named rewiring and was recently focused as a new window to study the field of systems biology, especially in the networks constructed by gene expression, diseases, and drugs (Barabasi et al. Citation2011).
Hudson et al. explained the stages of gene expression network studies, respectively as expression, differential expression, co-expression, and differential co-expression network (Hudson et al. Citation2009). They believed that each level improves the previous one. Although rewiring in gene expression networks has previously been constructed with some significant achievements, the rewired network based on interactions between mRNA and miRNA is novel. Herein, for the first time, we analyzed the rewiring of the miRNA-mRNA co-expression bipartite network on data from normal and primary prostate cancer tissues to better understand prostate cancer mechanisms.
Results
Data and samples
As presented in , The TCGA-PRAD raw data had the expression of 56,830 transcripts and 1880 miRs from 499 prostate cancer samples and 52 normal adjacent tissue samples. After data filtering, pre-processing, and matching, 12,447 coding mRNA and 213 miR from 52 normal and 394 cancer tissues were included in the final analysis. Normalized data showed that there were 1177 DEGs and 37 DEmiRs.
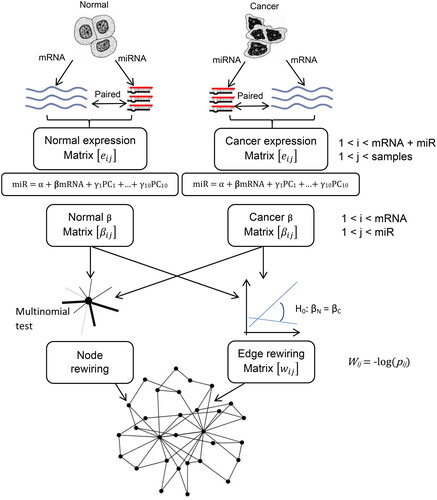
Figure 1. The overall process of constructing our rewiring network. The mRNA and miRNA expression data were obtained from TCGA and structured as two normal and cancer expression matrices. The beta coefficients of regression between miRNA and mRNA were computed as two separate matrices. The edge of the rewiring matrix was defined as the statistical difference between each two regression beta coefficients. The nodes of the rewiring matrix were determined by the multinomial test.
Traditional regulatory miRNA-mRNA network
In the traditional approach, DEGs and DEmiRs were computed. There were 1177 DEGs, 423 (35.9%) of them were upregulated, and 37 DEmiRs, 22 (59.4%) of them were upregulated. Supplementary file 1 contained the lists of DEGs and DEmiRs, sheets 1 and 2 (Table S1.1 and Table S1.2).
After determining the targets of DEmiRs, we constructed two separate bipartite networks from upregulated DEmiRs with downregulated mRNA targets (Figure S1) and downregulated DEmiRs with upregulated mRNA targets (Figure S2). From 22 upregulated DEmiRs in the first network miR-148a, miR-96, and miR-19b-2 had high degree centrality miRNAs, and ZEB2, ATRNL1, and BCL11A were higher degrees between 668 downregulated mRNAs. In the second network, from 14 downregulated DEmiRs, miR-27b, miR-222, and miR-221 had high degree centrality miRNAs, and TP53INP1, RFX3, and ONECUT2 were higher degrees between 297 downregulated mRNAs. The details were presented in the supplementary file 1, sheets 3 to 6 (Table S1.3 to Table S1.6).
Rewiring network
A comparison of the regression beta coefficient showed that there were 11,034 rewired edges between 3604 mRNAs and 179 miRs. Those rewired edges were categorized into four groups, gained (n = 4209, 38%), lost (n = 3592, 17%), strengthened (n = 1831, 32%), and weakened (n = 1402, 17%). Node rewiring based on the multinomial ratio test showed that there were 376 rewired mRNAs (58 of them were DEG, 15%) and 153 rewired miRNAs (27 of them were DEmiR, 18%). The intersection of both sets of the rewired edges and the rewired nodes were 106 mRNA (25 DEG, 24%) and 68 miR (6 DEmiR, 9%) which 306 edges have connected them as a bipartite network (). The lists of rewired mRNAs and miRs (two node sets) and mRNA regulated by miR (edges) were presented in the supplementary file 2 in sheet 1 (Table S2.1- mRNA), sheet 2 (Table S2.2 -miR), and sheet 3 (Table S2.3- Edges) respectively.
Figure 2. Rewiring network of miRNA-mRNA co-expression in prostate cancer. Green ovals are mRNA, and red rectangles are miRNA. Light color was used for differentially expressed genes or miRs. The edges were presented in four colors, red for new, pink for strengthened, blue for lost, Turquoise for weakened connection from normal to cancer state. The edges are weighted by -log(p-value) of the difference between normal to cancer regression coefficient as we defined for edge rewiring.
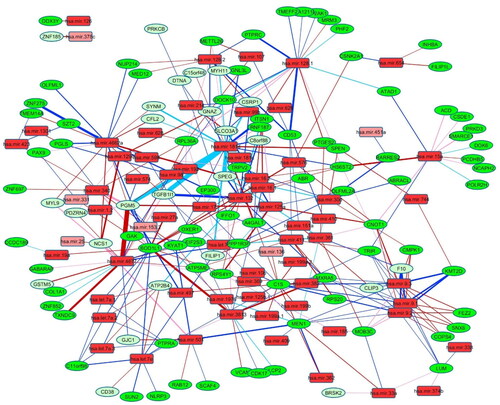
Of these 306 edges, 112 (37%) were new, 123 (40%) were lost, 44 (14%) were strengthened, and 27 (9%) were weakened connections. The strongest edge was between miR-4677 and Phosphoglucomutase 5 (PGM5) as a gained connection. The three next strongest were between miR-181d and Transforming Growth Factor Beta 1 Induced Transcript 1 (TGFb1I1) and PGM5 and Striated Muscle Enriched Protein Kinase (SEPG), all as the weakened connection.
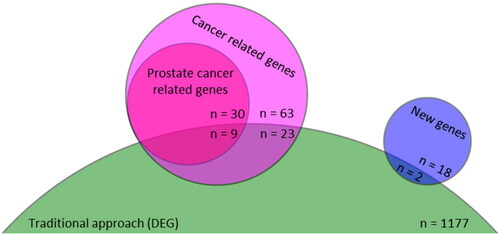
Of 106 rewired mRNA, 86 (81%) were cancer-related and 39 (37%) were related to different types of prostate cancer according to the DisGeNet database. The intersection of mRNAs between the traditional regulatory network and the rewiring network were presented in . There were 26 of 106 (24.5%) rewired nodes in the DEGs set. These ratios were 29.8%, 23.1%, and 10.0% for other cancer-related, prostate cancer-related, and non-cancer-related mRNA groups respectively.
Figure 3. The Venn diagram of the rewired and differentially expressed mRNAs. There were 1177 DEGs and 106 rewired mRNA in traditional and our rewiring approaches. The rewired mRNA could be categorized into cancer-related (n = 86, 81.1%) and new not labelled as cancer-related until us (n = 20, 18.9%) that presented by pink and blue circles, respectively. Thirty-nine of 86 cancer-related mRNA were directly related to prostate cancer. The traditional approaches (green truncated circle) identified two new and 32 cancer-related rewired mRNAs (9 of prostate cancer-related mRNA). DEG: differentially expressed gene.
The highest degree centrality of them belonged to PGM5, Biorientation of Chromosomes in Cell Division 1 Like 1 (BOD1L1), and Complement C1s (C1S) as three cancer-related mRNA. The highest betweenness centrality of them belonged to SEPG, ACD Shelterin Complex Subunit, Telomerase Recruitment Factor (ACD), and Transmembrane Protein with EGF Like and Two Follistatin Like Domains 2 (TMEFF2) which are two cancer-related factors and one prostate cancer-related protein. Finally, the highest closeness of them belonged to Casein Kinase 2 Alpha 1 (CSNK2A1), SR-Related CTD Associated Factor 4 (SCAF4), and Ribosomal Protein S4 Y-Linked 1 (RPS4Y1). The first was a prostate cancer-related factor, the last was a cancer-related protein, and the association of the second with cancer was unknown.
Of 68 rewired miRs 6 (8.8%) were DEmiR, and the highest degree centrality belonged to miR-181d, miR-4677, and miR-4662a; the highest betweenness centrality belonged to miR-9.3, miR-1301, and miR-10b; also, the highest closeness centrality belonged to miR-1301, miR-151a, and miR-744.
Enrichment analysis
The terms “structural molecule activity”, “hormone receptor binding”, “structural constituent of muscle”, “androgen receptor binding”, and “transcription coactivator activity” were the five main molecular functions obtained from rewired genes. While, the kinase binding and activity, channel and transmembrane receptor activity, and some terms related to extracellular matrix binding were the main molecular functions obtained from traditional DEGs set as presented in .
Figure 4. The results of enrichment analysis of traditional and rewired mRNAs. Upper left: Enrichment of the traditional approach DEGs set showed molecular function terms like channel activity, kinase activity, and some terms related to the extracellular matrix. Enrichment of the rewired mRNAs set showed molecular function terms like androgen receptor, SMAD, and beta-catenin binding. Lower left: The terms related to muscle and circulatory systems were repeating biological processes obtained from the traditional approach DEGs set. Lower right: In the Biological process, some terms related to regulation were enriched. Lower left: Some pathways related to immune systems were enriched. The bars present the -log(adjusted p-value). The labels are the hit count in the query list/in the genome.
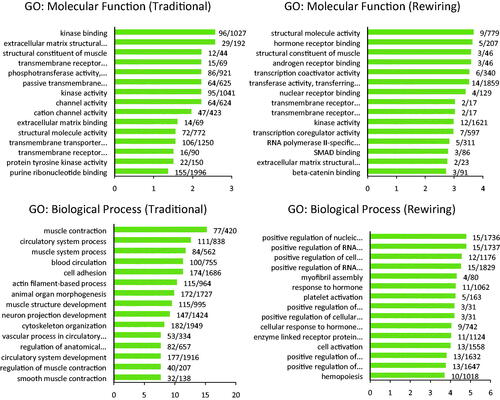
The terms “positive regulation of nucleic acid-templated transcription”, “positive regulation of RNA biosynthetic process”, “positive regulation of cell differentiation”, “positive regulation of RNA metabolic process”, and “myofibril assembly” were the five main biological processes that resulted from rewired genes. While the terms related to muscle and circulatory systems were frequent biological processes obtained from traditional DEGs sets.
Those 106 rewired genes hit "Role of Calcineurin-dependent NFAT signaling in lymphocytes", "Epstein-Barr virus infection", and "Activation of Src by Protein-tyrosine phosphatase alpha" pathways. While, “Muscle contraction”, “Ensemble of genes encoding extracellular matrix and extracellular matrix-associated proteins”, and “Prostaglandin synthesis and regulation” were frequent pathways between 1177 DEGs. The prostatic neoplasms, malignant neoplasm of the prostate, and benign prostatic hyperplasia were diseases related to both rewired genes and DEGS set (supplementary figure S3).
Discussion
In this study, we had a new approach to constructing the miRNA-mRNA network without focusing on the differential expression of miRNA or mRNA, and also without considering the direct targeting of mRNA by miRNA. We defined our network only by co-expression of miRNA and mRNA. Many researchers formed their networks based on the prediction of mRNA–miRNA direct interactions and used some tools like miRDB (Chen and Wang Citation2020), miRTarBase (Hsu et al. Citation2011), Targetscan (Agarwal et al. Citation2015), miRWalK (Sticht et al. Citation2018), and other interaction predictor tools (He et al. Citation2019; Yang et al. Citation2020). The base of target prediction was upon on the sequence complementary and computing the characteristics like binding energy, degree of complementarity of nucleotides in the interaction of miRNA with mRNA, presence of non-interacting nucleotides, and multiplicity of binding sites located using one or more nucleotides (Brennecke et al. Citation2005). High false positives rate, correct detection of target site accessibility, and considering the only secondary structure of mRNA to evaluate the target site are challenges of sequence alignment-based algorithms (Dai et al. Citation2011). Recently, the miRNA interaction mechanism was developed more to competitive endogenous RNA (ceRNA) (Liu et al. Citation2019). In ceRNA networks, there were long non-coding RNAs, pseudogene transcripts, and circular RNAs that may play a sponge role in regulating miRNA and mRNA interaction (Thomson and Dinger Citation2016). Almost all computational research about miRNA-mRNA interaction has used direct targeting prediction, while the weaknesses of this method have also been stated. Over-reliance on one method may deprive us of a comprehensive understanding of the complexity of diseases. Rewiring could be considered a minority report besides direct target prediction. Herein, we have abandoned the traditional view of miRNA-mRNA interaction and allowed to consider direct and indirect miRNA-mRNA interaction via co-expression network.
Another feature of our established network was the lack of use of differentially expressed genes. Almost all gene expression networks were built on DEGs, while DEGs are essential to finding biomarkers and they have little role in clarifying the action mechanism of cell function (Paul and Sil Citation2019). Abedi et al. reported that in most transcriptomic data analysis only the top DEGs were analyzed and considerable numbers of genes with mild alterations were totally ignored (Abedi et al. Citation2019). This reductionist approach can be misleading as slight variations of a bundle of genes can have a significant effect on cell behaviour. So, we allowed not only the differentially expressed genes but all mRNAs and miRNAs to be inserted in the network based on their role in the rewiring. As presented in the result section only one-quarter of rewired mRNAs were DEGs.
The correlation-based interaction between miRNA and mRNA may occur through some mechanisms such as competing-endogenous RNA networks. ceRNAs are endogenous transcripts that contain shared MREs and regulate each other by reducing miRNA availability through competing for binding to shared miRNAs (Salmena et al. Citation2011). Some types of RNA including pseudogenes, protein-coding transcripts, lncRNAs, and circular RNAs can dysregulate miRNA-mRNA interaction by sponging miRNA (Thomson and Dinger Citation2016; Wang et al. Citation2016). Another mechanism may be as co-expression of mRNA with the host miR gene.
Gene ontology analysis showed some of the cancer-related functions from our rewiring gene set -like beta-catenin binding (Yeh et al. Citation2019; Zhu et al. Citation2020), SMAD binding (Bello-DeOcampo and Tindall Citation2003; Oh et al. Citation2019), hormone receptor binding (Kumar Citation2016), and androgen receptor binding (Heinlein and Chang Citation2004; Culig and Santer Citation2014) - with known roles in prostate cancer. As we expected, the binding was the most frequent term in the molecular function, and the regulation was the most frequent term in the biological process when the gene ontology analysis did on the rewired mRNA set. Rewiring generally defines as the gain or loss of connection. In biology, it interprets as changing the proteins bindings and interaction between mRNA and miR, and this change will be made dysregulation in biological processes.
Using traditional miRNA-mRNA regulatory analyses -especially when considering just differentially expressed mRNA- highlighted gene functions were related to structure, extracellular matrix, and transmembrane activity, whiles the rewiring analyses highlighted regulatory mechanisms and bindings. Hence rewiring could include as a mechanism of dysregulation in biological processes.
Mediator complex subunit 12 (MED12), a prostate-related oncogene (Shaikhibrahim et al. Citation2014; Kampjarvi et al. Citation2016), was a common gene in two Beta-catenin and hormone receptor binding molecular functions of our gene rewiring set. Histone acetyltransferase P300 (EP300), another cancer-related oncogene (Ring et al. Citation2020), plays a critical role in the above function and also in the androgen receptor and SMAD binding molecular function as well. EP300 is known as a miRNA-regulated metastasis suppressor gene (Mees et al. Citation2010). Both EP300 and MED12 lost their connection with miR-4662a which is a high-degree centrality hub of our network. miR-361 was a microRNA that increased its connectivity with EP300 in our network. There were some reports that approved interaction between them in ischemic cardiomyopathy in which miR-361 and EP300 were up- and down-regulated respectively (Leger et al. Citation2013). Moreover, via text mining approaches the interaction between miR-361 and EP300 changed the regulation of other gene expressions (Anandaram Citation2018).
The expression of miR-132 plays some roles in the cancer-related biological processes (Rafat et al. Citation2021), especially through the TGF-B signaling pathway (Chen L et al. Citation2020; Wang et al. Citation2020), is reduced in prostate cancer (Qu et al. Citation2016) and its lower expression induced lower survival time (Formosa et al. Citation2013), so based on these interactions, this microRNA can be a candidate for a tumor suppressor target in further studies. miR-132 in our network lost connections with six genes like TGFB1I1, (SPEG, MXRA5, GNAZ, CSRP1, C8orf88) and gained new connections with three others (IFFO1, ABR, RPS4Y1).
Protein kinase CK2 (CSNK2A1) -one of our network hubs- plays a critical role in some specific cellular processes which eventually lead to cancer (Rabalski et al. Citation2016) and opens a new avenue as a therapeutic target in prostate cancer (Zaman et al. Citation2019). The expression level of CSNK2A1 increases in some tumors including prostate cancer (Tawfic et al. Citation2001). The studies found the downregulation of miR-654 in prostate cancer (Formosa et al. Citation2014) and the downregulation of microRNA in some other tumors (Eldaly et al. Citation2020). In our study, CSNK2A1 lost its connection with miR-654 and gained a new connection with miR-576 through prostate cancer processes.
Conclusion
In this study, we suggested a miRNA-mRNA co-expression bipartite network that identified the hidden aspects of the prostate cancer mechanism, which were not shown by traditional differential expression analyses. This model highlighted the impact of β-catenin and SMAD molecular function and some transcript factors like TGFB1I1 in prostate cancer.
Methods
Dataset and samples
The data used in this study were downloaded from the prostate cancer program (TCGA-PRAD) of The Cancer Genome Atlas (TCGA) database (https://www.cancer.gov/tcga). TCGA PRAD patient miRNA expression (Level 3 data, illumine-hiseq miRNA-seq) and mRNA expression (level 3 data, RNA-seq Version 2) were downloaded with the TCGAbiolinks (Colaprico et al. Citation2016) package of R/Bioconductor (http://www.bioconductor.org/). This data includes 499 samples of prostate cancer, and 52 samples of normal adjacent tissue.
Data preprocessing and differentially expressed genes (DEGs) screening
The mRNA and miRNA with a raw expression containing zero count or low coefficient of variation (CV <0.35), and mRNA with duplicated or undetected names and long non-coding or other RNA were filtered. Also, samples with low expression correlation (Spearman rho <0.8) and low CV (CV <0.35) or no primary type of cancer were removed from the samples. Finally, only samples that had paired mRNA and miRNA were included in further analysis. Data normalization was done using the Trimmed Mean of M-values (TMM) method (Robinson and Oshlack Citation2010) and the derived CPM (read counts per million) values were used as a measure of expression level. The differentially expressed gene (DEGs) and miRNA (DEmiR) of cancer and normal tissues were detected as false discovery ratio (FDR) adjusted P-value <0.05 and absolute logFC >1 using edgeR package of R software (Robinson et al. Citation2010).
mRNA-miR regression
After preprocessing, we constructed two expression matrices for normal and cancer states. Each element of this matrix was an expression of mRNA or miR (rows) for different samples (column). The linear regression model was applied to determine the link between each miR expression (the outcome of the regression model) with mRNA expression (as a predictor of the model) one by one. To reduce the effect of collinearity, we adjusted each normal and cancer beta coefficient with ten main principal components of the mRNA expression matrix (miR = α + βmRNA + γ1PC1 +…+ γ10PC10). The regression coefficient of mRNA from these models has constructed two beta matrices for both normal and cancer states that are used for edge rewiring. The p-values of the coefficients have constructed two normal and cancer FDR-adjusted p-values that are used for node rewiring.
Edge rewiring
We defined rewiring as a significant change in the regression coefficient when mRNA was regressed on the miRNA in both normal and cancer state. A comparison of the regression beta coefficients was done with Welch corrected t-test discussed in the Andrade JM work (Andrade and Estevez-Perez Citation2014).
Node rewiring
To label a node as rewired, we used a likelihood ratio test based on the multinomial distribution. The generalization of the binomial distribution is a statistical distribution that computes the probability of the event in cases when the population have more than two partitions. In our study, according to two separate linear regression models for normal and cancer states each miR had some linked mRNA in normal and cancer states. This linked mRNA could categorize into three separate partitions gained links, which are presented only in the cancer state, lost links which are presented only in the normal state, and fixed links, which are presented only in both states.
When g, l, and f were the number of gained, lost, and fixed edges of each node during a change from normal to cancer state, then the probability of this state was computed as below:
e = g + l + f and pg = g/e, pl = l/e, pf = f/e. Under the null hypothesis, the probability of G, L, and F was computed as pG = G/E, pL = L/E, pF = F/E from the total edges of the rewiring network. According to Wilks’ theorem -2ln(likelihood for null model/likelihood of alternative model) has a chi-square distribution with dfalt-dfnul degree of distribution. We also adjusted the p-values of the chi-square test with FDR to avoid a false positive.
Rewiring network
We selected the rewired node and edges that connected them as the network nodes and edges and -log(p-value) that was computed in Section 2.4 as edge weight. The network construction was done via Cytoscape software (Shannon et al. Citation2003) and computed centrality indices with the CytoNCA network analyzer package for weighted edges (Tang et al. Citation2015).
Enrichment analysis
The Gene Ontology (GO) and pathway enrichment analyses were performed using the ToppFun web tool from the ToppGene site (Chen J et al. Citation2009). The DisGeNET database was used to identify genes associated with prostate and other cancer (Pinero et al. Citation2017).
Traditional approach to constructing the microRNA regulatory network
The DEGs set and DEmiR set were detected in Section 5.2 and enriched as explained in section 5.7. The targeted mRNAs for miRs were determined using target prediction databases and algorithms. Then two separate networks contained upregulated miRNA with their downregulated mRNA targets and downregulated miRNA with their upregulated mRNA targets were constructed. The miRNAs that target the mRNAs were extracted from the mirTarBase (Huang et al. Citation2020), Targetscan (Agarwal et al. Citation2015), miRDB (Chen Y and Wang Citation2020), PITA (Kertesz et al. Citation2007), and RAID (Yi et al. Citation2017) databases.
Ethics approval
Not applicable. This study used data from the public domain and did not require the approval from an ethics committee.
Authors’ contributions
Conceptualization: MMN, AMN, BB; Methodology: MMN, FN; Software: MMN; Biological validation: MMN, MY, BB; Writing original draft preparation: MMN; Writing review and editing: MMN, AMN, FN, MY, BB; Supervision: AM, BB; All authors have read and agreed to the published version of the manuscript.
| Abbreviation | ||
| ABR | = | ABR activator of RhoGEF and GTPase |
| ACD | = | ACD shelterin complex subunit, telomerase recruitment factor |
| ATRNL1 | = | Attractin Like 1 |
| BCL11A | = | BAF Chromatin Remodeling Complex Subunit BCL11A |
| BOD1L1 | = | Biorientation of chromosomes in cell division 1 Like 1 |
| C1S | = | Complement C1s |
| C8orf88 | = | Chromosome 8 open reading frame 88 |
| CK2 | = | Protein kinase CK2 |
| CPM | = | Read counts per million |
| CSNK2A1 | = | Casein Kinase 2 Alpha 1 |
| CSRP1 | = | Cysteine and glycine rich protein 1 |
| DEG | = | Differentially expressed gene |
| DEmiR | = | Differentially expressed miRNA |
| EP300 | = | Histone acetyltransferase P300 |
| FDR | = | False discovery ratio |
| GNAZ | = | G protein subunit alpha Z |
| GO | = | Gene ontology |
| IFFO1 | = | Intermediate filament family orphan 1 |
| logFC | = | Logarithm of fold change |
| MED12 | = | Mediator complex subunit 12 |
| MXRA5 | = | Matrix remodeling associated 5 |
| ONECUT2 | = | One Cut Homeobox 2 |
| PGM5 | = | Phosphoglucomutase 5 |
| PRAD | = | Prostate adenocarcinoma |
| RFX3 | = | Regulatory Factor X3 |
| RPS4Y1 | = | Ribosomal Protein S4 Y-Linked 1 |
| SCAF4 | = | SR-related CTD associated factor 4 |
| SEPG | = | Striated muscle-enriched protein kinase |
| SMAD | = | Suppressor of Mothers against Decapentaplegic |
| TCGA | = | The cancer genome atlas |
| TGF-B | = | Transforming growth factor-beta |
| TGFb1I1 | = | Transforming growth factor beta 1 induced transcript 1 |
| TMEFF2 | = | Transmembrane protein with EGF like and two follistatin like domains 2 |
| TMM | = | Trimmed mean of M-values |
| TP53INP1 | = | Tumor Protein P53 Inducible Nuclear Protein 1 |
| UTR | = | Untranslated region |
| Wnt | = | Wingless and Int-1 |
| ZEB2 | = | Zinc Finger E-Box Binding Homeobox 2 |
Supplemental Material
Download MS Word (1.7 MB)Supplemental Material
Download MS Excel (54.7 KB)Supplemental Material
Download MS Excel (214.4 KB)Acknowledgments
The authors would like to thank professor S.K. Ardestani (IBB, University of Tehran) for his kind advices and useful scientific discussion on this project.
Disclosure statement
The authors declare that they have no competing interests.
Data availability and materials
The data used in this study were downloaded from the prostate cancer program (TCGA-PRAD) of The Cancer Genome Atlas (TCGA) database (https://www.cancer.gov/tcga) (accessed on July 8, 2018). The findings were attached as two supplementary files.
References
- Abedi M, Fatehi R, Moradzadeh K, Gheisari Y. 2019. Big data to knowledge: common pitfalls in transcriptomics data analysis and representation. RNA Biol. 16(11):1531–1533.
- Agarwal V, Bell GW, Nam JW, Bartel DP. 2015. Predicting effective microRNA target sites in mammalian mRNAs. Elife. 4:e05005
- Anandaram H. 2018. A computational approach to identify microRNA (miRNA) based biomarker of Pharmacovariant from the regulation of disease pathology. MOJ Proteomics Bioinform. 7(3):152–170.
- Andrade JM, Estevez-Perez MG. 2014. Statistical comparison of the slopes of two regression lines: a tutorial. Anal Chim Acta. 838:1–12.
- Arend RC, Londono-Joshi AI, Straughn JM, Jr., Buchsbaum DJ. 2013. The Wnt/beta-catenin pathway in ovarian cancer: a review. Gynecol Oncol. 131(3):772–779.
- Bakhshandeh B, Soleimani M, Hafizi M, Paylakhi SH, Ghaemi N. 2012. MicroRNA signature associated with osteogenic lineage commitment. Mol Biol Rep. 39(7):7569–7581.
- Barabasi AL, Gulbahce N, Loscalzo J. 2011. Network medicine: a network-based approach to human disease. Nat Rev Genet. 12(1):56–68.
- Bello-DeOcampo D, Tindall DJ. 2003. TGF-betal/Smad signaling in prostate cancer. Curr Drug Targets. 4(3):197–207.
- Bentwich I, Avniel A, Karov Y, Aharonov R, Gilad S, Barad O, Barzilai A, Einat P, Einav U, Meiri E, et al. 2005. Identification of hundreds of conserved and nonconserved human microRNAs. Nat Genet. 37(7):766–770.
- Brennecke J, Stark A, Russell RB, Cohen SM. 2005. Principles of microRNA-target recognition. PLoS Biol. 3(3):e85.
- Chen J, Bardes EE, Aronow BJ, Jegga AG. 2009. ToppGene Suite for gene list enrichment analysis and candidate gene prioritization. Nucleic Acids Res. 37(Web Server issue):W305–311.
- Chen Y, Wang X. 2020. miRDB: an online database for prediction of functional microRNA targets. Nucleic Acids Res. 48(D1):D127–D131.
- Chen L, Zhu Q, Lu L, Liu Y. 2020. MiR-132 inhibits migration and invasion and increases chemosensitivity of cisplatin-resistant oral squamous cell carcinoma cells via targeting TGF-beta1. Bioengineered. 11(1):91–102.
- Cheng X, Xu X, Chen D, Zhao F, Wang W. 2019. Therapeutic potential of targeting the Wnt/beta-catenin signaling pathway in colorectal cancer. Biomed Pharmacother. 110:473–481.
- Colaprico A, Silva TC, Olsen C, Garofano L, Cava C, Garolini D, Sabedot TS, Malta TM, Pagnotta SM, Castiglioni I, et al. 2016. TCGAbiolinks: an R/Bioconductor package for integrative analysis of TCGA data. Nucleic Acids Res. 44(8):e71.
- Creixell P, Schoof EM, Erler JT, Linding R. 2012. Navigating cancer network attractors for tumor-specific therapy. Nat Biotechnol. 30(9):842–848.
- Culig Z, Santer FR. 2014. Androgen receptor signaling in prostate cancer. Cancer Metastasis Rev. 33(2-3):413–427.
- Dai X, Zhuang Z, Zhao PX. 2011. Computational analysis of miRNA targets in plants: current status and challenges. Brief Bioinform. 12(2):115–121.
- Eldaly MN, Metwally FM, Shousha WG, El-Saiid AS, Ramadan SS. 2020. Clinical potentials of mir-576-3p, mir-613, ndrg2 and ykl40 in colorectal cancer patients. Asian Pac J Cancer Prev. 21(6):1689–1695.
- Formosa A, Lena AM, Markert EK, Cortelli S, Miano R, Mauriello A, Croce N, Vandesompele J, Mestdagh P, Finazzi-Agro E, et al. 2013. DNA methylation silences miR-132 in prostate cancer. Oncogene. 32(1):127–134.
- Formosa A, Markert EK, Lena AM, Italiano D, Finazzi-Agro E, Levine AJ, Bernardini S, Garabadgiu AV, Melino G, Candi E. 2014. MicroRNAs, miR-154, miR-299-5p, miR-376a, miR-376c, miR-377, miR-381, miR-487b, miR-485-3p, miR-495 and miR-654-3p, mapped to the 14q32.31 locus, regulate proliferation, apoptosis, migration and invasion in metastatic prostate cancer cells. Oncogene. 33(44):5173–5182.
- Fu Q, Gao Y, Yang F, Mao T, Sun Z, Wang H, Song B, Li X. 2018. Suppression of microRNA-454 impedes the proliferation and invasion of prostate cancer cells by promoting N-myc downstream-regulated gene 2 and inhibiting WNT/beta-catenin signaling. Biomed Pharmacother. 97:120–127.
- Fujita K, Nonomura N. 2019. Role of Androgen Receptor in Prostate Cancer: a Review. World J Mens Health. 37(3):288–295.
- Gillis J, Pavlidis P. 2012. Guilt by association" is the exception rather than the rule in gene networks. PLoS Comput Biol. 8(3):e1002444.
- Guan H, Liu C, Fang F, Huang Y, Tao T, Ling Z, You Z, Han X, Chen S, Xu B, et al. 2017. MicroRNA-744 promotes prostate cancer progression through aberrantly activating Wnt/beta-catenin signaling. Oncotarget. 8(9):14693–14707.
- He Y, Deng F, Zhao S, Zhong S, Zhao J, Wang D, Chen X, Zhang J, Hou J, Zhang W, et al. 2019. Analysis of miRNA-mRNA network reveals miR-140-5p as a suppressor of breast cancer glycolysis via targeting GLUT1. Epigenomics. 11(9):1021–1036.
- He L, Hannon GJ. 2004. MicroRNAs: small RNAs with a big role in gene regulation. Nat Rev Genet. 5(7):522–531.
- Heinlein CA, Chang C. 2004. Androgen receptor in prostate cancer. Endocr Rev. 25(2):276–308.
- Hou L, Chen M, Zhang CK, Cho J, Zhao H. 2014. Guilt by rewiring: gene prioritization through network rewiring in genome wide association studies. Hum Mol Genet. 23(10):2780–2790.
- Hsu SD, Lin FM, Wu WY, Liang C, Huang WC, Chan WL, Tsai WT, Chen GZ, Lee CJ, Chiu CM, et al. 2011. miRTarBase: a database curates experimentally validated microRNA-target interactions. Nucleic Acids Res. 39(suppl_1):D163–D169.
- Huang HY, Lin YC, Li J, Huang KY, Shrestha S, Hong HC, Tang Y, Chen YG, Jin CN, Yu Y, et al. 2020. miRTarBase 2020. Updates to the experimentally validated microRNA-target interaction database. Nucleic Acids Res. 48(D1):D148–d154.
- Hudson NJ, Reverter A, Dalrymple BP. 2009. A differential wiring analysis of expression data correctly identifies the gene containing the causal mutation. PLoS Comput Biol. 5(5):e1000382.
- Ideker T, Krogan NJ. 2012. Differential network biology. Mol Syst Biol. 8(1):565.
- Jopling CL, Yi M, Lancaster AM, Lemon SM, Sarnow P. 2005. Modulation of hepatitis C virus RNA abundance by a liver-specific MicroRNA. Science. 309(5740):1577–1581.
- Kampjarvi K, Kim NH, Keskitalo S, Clark AD, von Nandelstadh P, Turunen M, Heikkinen T, Park MJ, Makinen N, Kivinummi K, et al. 2016. Somatic MED12 mutations in prostate cancer and uterine leiomyomas promote tumorigenesis through distinct mechanisms. Prostate. 76(1):22–31.
- Kertesz M, Iovino N, Unnerstall U, Gaul U, Segal E. 2007. The role of site accessibility in microRNA target recognition. Nat Genet. 39(10):1278–1284.
- Kouhsar M, Azimzadeh Jamalkandi S, Moeini A, Masoudi-Nejad A. 2019. Detection of novel biomarkers for early detection of non-muscle-invasive bladder cancer using competing endogenous RNA network analysis. Sci Rep. 9(1):8434.
- Krishnamurthy N, Kurzrock R. 2018. Targeting the Wnt/beta-catenin pathway in cancer: update on effectors and inhibitors. Cancer Treat Rev. 62:50–60.
- Kumar R. 2016. Steroid hormone receptors and prostate cancer: role of structural dynamics in therapeutic targeting. Asian J Androl. 18(5):682–686.
- Lanjanian H, Nematzadeh S, Hosseini S, Torkamanian-Afshar M, Kiani F, Moazzam-Jazi M, Aydin N, Masoudi-Nejad A. 2021. High-throughput analysis of the interactions between viral proteins and host cell RNAs. Comput Biol Med. 135:104611.
- Liu Y, Xue M, Du S, Feng W, Zhang K, Zhang L, Liu H, Jia G, Wu L, Hu X, et al. 2019. Competitive endogenous RNA is an intrinsic component of EMT regulatory circuits and modulates EMT. Nat Commun. 10(1):1637.
- Masoudi-Sobhanzadeh Y, Omidi Y, Amanlou M, Masoudi-Nejad A. 2019a. DrugR+: a comprehensive relational database for drug repurposing, combination therapy, and replacement therapy. Comput Biol Med. 109:254–262.
- Masoudi-Sobhanzadeh Y, Omidi Y, Amanlou M, Masoudi-Nejad A. 2019b. Trader as a new optimization algorithm predicts drug-target interactions efficiently. Sci Rep. 9(1):9348.
- Masoudi-Sobhanzadeh Y, Omidi Y, Amanlou M, Masoudi-Nejad A. 2020. Drug databases and their contributions to drug repurposing. Genomics. 112(2):1087–1095.
- Mees ST, Mardin WA, Wendel C, Baeumer N, Willscher E, Senninger N, Schleicher C, Colombo-Benkmann M, Haier J. 2010. EP300–a miRNA-regulated metastasis suppressor gene in ductal adenocarcinomas of the pancreas. Int J Cancer. 126(1):114–124.
- Meltzer PS. 2005. Cancer genomics: small RNAs with big impacts. Nature. 435(7043):745–746.
- Mitra K, Carvunis AR, Ramesh SK, Ideker T. 2013. Integrative approaches for finding modular structure in biological networks. Nat Rev Genet. 14(10):719–732.
- Leger KJ, Singh S, Canseco D, vonGrote EC, Karim-Ud-Din S, Collins SC, Thibodeau JT, Mishkin JD, Patel PC, Markham DW. 2013. Identification of novel circulating microRNAs in ischemic cardiomyopathy utilizing whole blood microRNA profiling. Am Heart Assoc. :A13120–A13120.
- Mousavian Z, Diaz J, Masoudi-Nejad A. 2016. Information theory in systems biology. Part II: protein-protein interaction and signaling networks. Semin Cell Dev Biol. 51:14–23.
- Mousavian Z, Kavousi K, Masoudi-Nejad A. 2016. Information theory in systems biology. Part I: gene regulatory and metabolic networks. Semin Cell Dev Biol. 51:3–13.
- Murillo-Garzon V, Kypta R. 2017. WNT signalling in prostate cancer. Nat Rev Urol. 14(11):683–696.
- Oh S, Shin S, Song H, Grande JP, Janknecht R. 2019. Relationship between ETS Transcription Factor ETV1 and TGF-beta-regulated SMAD proteins in prostate cancer. Sci Rep. 9(1):8186.
- Pai SG, Carneiro BA, Mota JM, Costa R, Leite CA, Barroso-Sousa R, Kaplan JB, Chae YK, Giles FJ. 2017. Wnt/beta-catenin pathway: modulating anticancer immune response. J Hematol Oncol. 10(1):101.
- Paul A, Sil J. 2019. Identification of Differentially expressed genes to establish new biomarker for cancer prediction. IEEE/ACM Trans Comput Biol Bioinf. 16(6):1970–1985.
- Pinero J, Bravo A, Queralt-Rosinach N, Gutierrez-Sacristan A, Deu-Pons J, Centeno E, Garcia-Garcia J, Sanz F, Furlong LI. 2017. DisGeNET: a comprehensive platform integrating information on human disease-associated genes and variants. Nucleic Acids Res. 45(D1):D833–D839.
- Qu W, Ding SM, Cao G, Wang SJ, Zheng XH, Li GH. 2016. miR-132 mediates a metabolic shift in prostate cancer cells by targeting Glut1. FEBS Open Bio. 6(7):735–741.
- Rabalski AJ, Gyenis L, Litchfield DW. 2016. Molecular pathways: emergence of protein kinase ck2 (CSNK2) as a potential target to inhibit survival and DNA damage response and repair pathways in cancer cells. Clin Cancer Res. 22(12):2840–2847.
- Rafat M, Moraghebi M, Afsa M, Malekzadeh K. 2021. The outstanding role of miR-132-3p in carcinogenesis of solid tumors. Hum Cell. 34(4):1051–1065.
- Ring A, Kaur P, Lang JE. 2020. EP300 knockdown reduces cancer stem cell phenotype, tumor growth and metastasis in triple negative breast cancer. BMC Cancer. 20(1):1076.
- Robinson MD, McCarthy DJ, Smyth GK. 2010. edgeR: a bioconductor package for differential expression analysis of digital gene expression data. Bioinformatics. 26(1):139–140.
- Robinson MD, Oshlack A. 2010. A scaling normalization method for differential expression analysis of RNA-seq data. Genome Biol. 11(3):R25.
- Salmena L, Poliseno L, Tay Y, Kats L, Pandolfi PP. 2011. A ceRNA hypothesis: the Rosetta Stone of a hidden RNA language? Cell. 146(3):353–358.
- Schneider JA, Logan SK. 2018. Revisiting the role of Wnt/beta-catenin signaling in prostate cancer. Mol Cell Endocrinol. 462(Pt A):3–8.
- Shaikhibrahim Z, Offermann A, Braun M, Menon R, Syring I, Nowak M, Halbach R, Vogel W, Ruiz C, Zellweger T, et al. 2014. MED12 overexpression is a frequent event in castration-resistant prostate cancer. Endocr Relat Cancer. 21(4):663–675.
- Shannon P, Markiel A, Ozier O, Baliga NS, Wang JT, Ramage D, Amin N, Schwikowski B, Ideker T. 2003. Cytoscape: a software environment for integrated models of biomolecular interaction networks. Genome Res. 13(11):2498–2504.
- Situ J, Zhang H, Jin Z, Li K, Mao Y, Huang W. 2020. MicroRNA-939 directly targets HDGF to inhibit the aggressiveness of prostate cancer via deactivation of the WNT/beta-catenin pathway. OTT. Volume 13:4257–4270.
- Song J, Wu X, Ma R, Miao L, Xiong L, Zhao W. 2019. Long noncoding RNA SNHG12 promotes cell proliferation and activates Wnt/beta-catenin signaling in prostate cancer through sponging microRNA-195. J Cell Biochem. 120(8):13066–13075.
- Sticht C, De La Torre C, Parveen A, Gretz N. 2018. miRWalk: an online resource for prediction of microRNA binding sites. PLOS One. 13(10):e0206239.
- Tang Y, Li M, Wang J, Pan Y, Wu FX. 2015. CytoNCA: a cytoscape plugin for centrality analysis and evaluation of protein interaction networks. Biosystems. 127:67–72.
- Tawfic S, Yu S, Wang H, Faust R, Davis A, Ahmed K. 2001. Protein kinase CK2 signal in neoplasia. Histol Histopathol. 16(2):573–582.
- Thomson DW, Dinger ME. 2016. Endogenous microRNA sponges: evidence and controversy. Nat Rev Genet. 17(5):272–283.
- Wang Y, Han B, Wang Y, Wang C, Zhang H, Xue J, Wang X, Niu T, Niu Z, Chen Y. 2020. Mesenchymal stem cell-secreted extracellular vesicles carrying TGF-beta1 up-regulate miR-132 and promote mouse M2 macrophage polarization. J Cell Mol Med. 24(21):12750–12764.
- Wang Y, Hou J, He D, Sun M, Zhang P, Yu Y, Chen Y. 2016. The emerging function and mechanism of ceRNAs in cancer. Trends Genet. 32(4):211–224.
- Yang T, Miao X, Bai Z, Tu J, Shen S, Niu H, Xia W, Wang J, Zhang Y. 2020. A novel mRNA-miRNA regulatory sub-network associated with prognosis of metastatic clear cell renal cell carcinoma. Front Oncol. 10:593601.
- Yeh Y, Guo Q, Connelly Z, Cheng S, Yang S, Prieto-Dominguez N, Yu X. 2019. Wnt/beta-catenin signaling and prostate cancer therapy resistance. Adv Exp Med Biol. 1210:351–378.
- Yi Y, Zhao Y, Li C, Zhang L, Huang H, Li Y, Liu L, Hou P, Cui T, Tan P, et al. 2017. RAID v2.0: an updated resource of RNA-associated interactions across organisms. Nucleic Acids Res. 45(D1):D115–d118.
- Zaman MS, Johnson AJ, Petersingham G, Muench GW, Dong Q, Wu MJ. 2019. Protein kinase CK2 is involved in zinc homeostasis in breast and prostate cancer cells. Biometals. 32(6):861–873.
- Zhang Y, Wang Z, Gemeinhart RA. 2013. Progress in microRNA delivery. J Control Release. 172(3):962–974.
- Zhou Q, Chen S, Lu M, Luo Y, Wang G, Xiao Y, Ju L, Wang X. 2019. EFEMP2 suppresses epithelial-mesenchymal transition via Wnt/beta-catenin signaling pathway in human bladder cancer. Int J Biol Sci. 15(10):2139–2155.
- Zhu M, Yu X, Zheng Z, Huang J, Yang X, Shi H. 2020. Capsaicin suppressed activity of prostate cancer stem cells by inhibition of Wnt/beta-catenin pathway. Phytother Res. 34(4):817–824.