
Abstract
The assessment of epigenetic profiles in sperm is sensitive to somatic cell contamination, which can influence methylation signals at gene promoters. This contamination is particularly problematic in the assessment of DNA methylation in samples with low sperm counts, where fractional amounts of somatic cell DNA can lead to significant shifts in measured methylation state. In this study, a new method of detecting possible somatic cell contamination is proposed through two multi-region bioinformatic models: a traditional differential methylation analysis and a machine learning logistic regression model. These models were trained on publicly available sperm (n = 489) and blood (n = 1029) DNA methylation array data and tested on a contamination set, wherein the sperm of four donors with normal sperm counts were run on a 450k methylation array with four permutations each, including pure blood, half blood and half sperm by DNA concentration, half blood and half sperm by cell count, and pure sperm (n = 16). The DMR and logistic regression model classified the contamination testing set with 100% and 94% accuracy, respectively. These new methods of detecting the effects of somatic cell contamination allow for more accurate differentiation between epigenetic profiles that contain a biological somatic-like shift and those that have somatic-like signatures because of contamination.
Introduction
Tissue specific epigenetic profiles are of interest in virtually all fields of human health. Because specific tissues have unique gene expression patterns, epigenetic signatures are distinct across cell types (Qi and Teschendorff Citation2022). As a result, it is imperative that tissue heterogeneity in cell specific epigenetic research is avoided. This is particularly important in the study of human sperm, as the sperm epigenome is highly distinct from all other somatic cell types (Gannon et al. Citation2014). All semen samples, regardless of total sperm count, have the potential for somatic cell contamination. However, due to an increased somatic to sperm cell ratio, contamination becomes increasingly more impactful in epigenetic profile assessment of semen samples as sperm count decreases. Individuals with a normal sperm count have enough germ cells to minimize the effect of contamination. The same is not true for men with oligozoospermia (Jenkins et al. Citation2018).
Interestingly, several studies have cited imprinted genes as being commonly perturbed epigenetically in the sperm of men with low sperm counts (Kobayashi et al. Citation2007; Tang et al. Citation2018); however, it is difficult to elucidate the actual cause of this perturbation since, by definition, sperm and somatic cell DNA methylation profiles differ at these positions. Thus, it is possible that the pattern observed could either be due to an altered somatic: sperm ratio driven by low sperm count or a by somatic-like epigenetic signatures in abnormal sperm. In fact, methylation at the maternally imprinted/paternally expressed DLK1 gene has previously been used to qualitatively identify contamination (Jenkins et al. Citation2016). To estimate DLK1 methylation, methylation levels are measured at 14 CpG probes located around the DLK1 gene promoter, and a mean beta value (which closely correlates to mean methylation across region CpG sites) is calculated. A high mean beta value suggests the presence of somatic DNA in a sample. However, there is no established cutoff for DLK1. Some have suggested using beta values of 0.2–0.25, but most inferences are made visually using a heatmap (Miller et al. Citation2023). DLK1 is further limited by the fact that it only detects methylation perturbations at a single locus, and it is not known if similar, somatic-like patterns could be seen in abnormal sperm and not just in somatic tissue. Thus, a broader assessment of the epigenome is warranted to distinguish contamination from actual epigenetic perturbations in the sperm.
Two multi-region bioinformatic analyses have been created to identify samples that may contain somatic cell derived DNA: a more traditional pipeline that uses differentially methylated regions (DMRs) and a logistic regression machine learning model. Though machine learning approaches have been used to predict sperm motility, concentration, and the best gametes for fertility treatments, machine learning has not yet been used to identify somatic-like signatures within sperm samples (Hicks et al. Citation2019; Lesani et al. Citation2020; You et al. Citation2021). These models will allow for better differentiation between epigenetic profiles indicative of biological somatic-like signatures and contaminated samples. The pipelines created in this study can be accessed at https://github.com/jenkins-lab-byu/Somatic_Cell_QC_Pipeline.
Results
Differential methylation analysis and contamination detection
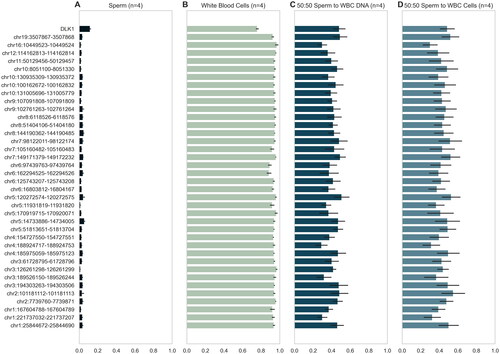
The USEQ Methylation Array Scanner and the Enriched Region Maker applications were used to identify and score windows of differential methylation between blood and sperm. Blood was used as a reference for somatic cells because leukocytes are frequently found in semen samples (Fedder Citation1996) and have been frequently studied for their impact on fertility (Ricci et al. Citation2000). The analysis revealed a total of 128,131 DMRs between blood and sperm samples EPIC Illumina methylation data with a Phred-scaled FDR of ≥40 (p value .0001). One thousand and seventeen of these DMRs had beta values with an absolute difference above 0.87, including both hypomethylated and hypermethylated regions. For a traditional DMR algorithm, 63 DMRs (and DLK1) with a positive difference in beta values between sperm and blood exceeding 0.9 were selected (hypomethylated sites in sperm), of which 38 have CpGs that are also included on the Illumina 450K array (). Of these DMRs, one overlapped with the gene promoter of DMRTC1B, a member of the DMRT gene family, which has been implicated in male sexual differentiation (Kopp Citation2012). No other DMR overlap with gene promoters was identified.
Figure 1. Profiles of regional methylation in contamination set. Regional methylation for each of the four contamination sets, with mean methylation and SD shown for each group (n = 16). The 38 differentially methylated regions from the Illumina 450k DMR pipeline are shown. (A) Beta values of pure sperm samples (post somatic cell lysis) at the DMRs used by the traditional DMR analysis. Note consistent hypomethylation with minimal variability. (B) Beta values of WBC samples (extracted from buffy coat) at DMRs of interest. Note consistent hypermethylation with minimal variability. (C) Beta values of a sample that is half somatic cell by DNA ratio at DMRs of interest, indicated how an extremely contaminated sample would appear using the traditional DMR analysis. (D) Beta values of a sample that is half somatic cell by cell count at DMRs of interest, further illustrating the signature of a contaminated sample.
The DMR pipeline was then validated on a contamination test set (n = 16) which consisted of samples with varying levels of spiked somatic cells. The model demonstrated 100% accuracy in identifying contaminated samples.
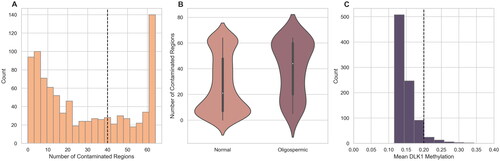
Recognizing that samples with low sperm levels pose challenges in purification, the impact of sperm count on contamination rates was investigated among the FAZST patients. The analysis revealed a significantly higher rate of region methylation in samples from men with oligozoospermia than in samples from those with normozoospermia (). These findings highlight the necessity for caution when purifying and extracting sperm DNA from patients with low sperm counts. It should also be noted that a subset of patients with normozoospermia also had a high number of contaminated regions, suggesting that these sperm samples are either contaminated or underwent other significant epigenetic perturbations.
Figure 2. DMR contamination score and DLK1 methylation. (A) The number of contaminated loci, determined by the traditional DMR pipeline, is shown. Samples with somatic-like methylation at 40 regions and DLK >.2 are considered contaminated. (B) A comparison of total contaminated loci in oligozoospermic and normozoospermic samples shows that samples with a low sperm count are more likely to be marked as contaminated than those with a normal sperm count using the DMR analysis. p Value from an independent t-test between the two groups is shown. (C) The mean beta values at the DLK1 locus of the FAZST data set (n = 897) are shown. Traditionally, samples above a beta value of ∼0.2 would be considered contaminated.
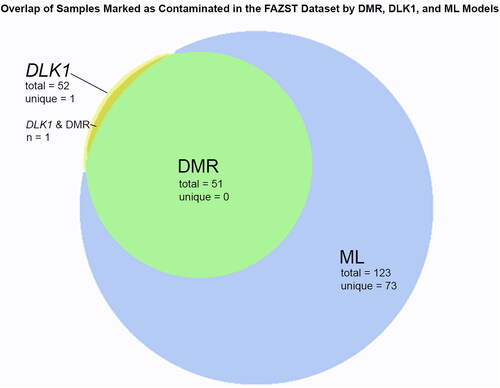
To assess the performance of the multiple loci DMR model in identifying somatic cell contamination, it was compared to the historically used single site of DLK1. When the model was applied to the entire Folic Acid and Zinc Supplementation Trial (FAZST) dataset minus the 489 used in training (n = 897), it predicted that 5.7% of samples (n = 51) were highly likely to be contaminated () (Schisterman et al. Citation2020). DLK1 identified 5.8% of samples as contaminated (n = 52, ).
Figure 3. Overlap of samples identified via tested models. A Venn diagram showing the overlap of samples determined to be contaminated with DLK1, the DMR pipeline, and the machine learning (ML) model.
Machine learning and contamination detection
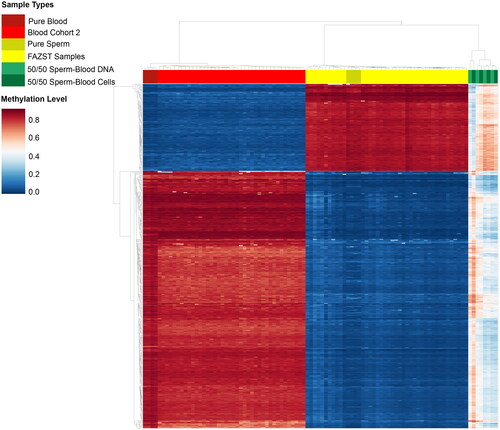
To enhance the identification of somatic cell contamination, a machine learning model was created in addition to the traditional DMR model. A heatmap of the 1017 DMRs used as features for model building at a subset of uncontaminated sperm and blood samples is included in . Logistic-regression based, recursive feature elimination (Pedregosa et al. Citation2011) was used to identify the 250 regions in the training set most correlated with contamination status (Supplemental Table 2). Some of these regions were found to overlap with genes SLC30A10, ZNF316, C1QTNF4, INCENP, RASAL3, GTPBP3, and MOB3A (specific gene regions of overlap are noted in Supplemental Table 2). Following parameter tuning, a logistic regression model achieved a sensitivity of 86% and specificity of 93% when classifying contamination in the validation cohort of DLK1 pass/fail samples (DLK1 ≥ 0.2, and DLK1 < 0.15, n = 200), outperforming all other machine learning models tested (see Supplemental Table 1). Subsequent testing on the contamination set (n = 16) resulted in 94% accuracy in classifying samples as either pure sperm DNA or DNA contaminated by somatic cells (a single pure sperm sample was improperly classified as contaminated). Samples with a probability of 99.999% or higher of being uncontaminated were classified as such.
Figure 4. Unsupervised clustering of sperm, blood, and contaminated samples. Heat map showing unsupervised clustering of sperm, blood, and contaminated samples at generated DMRs. For easier comparison, a limited number of samples from the blood (n = 50) and FAZST (n = 50) are shown alongside the testing set (n = 4, n = 4, n = 4, n = 4).
When the machine learning model was applied to the entire dataset of FAZST data minus the 489 samples used in training (n = 897), it predicted that 13.7% of samples were highly likely to be contaminated (n = 123). Notably, the model identified 96% (50/52) of the samples previously identified as contaminated by DLK1, in addition to 73 samples that DLK1 and the DMR model failed to detect (). To facilitate wider use, a publicly available version of this model for analyzing 450K and EPIC Infinium array data is accessible at https://github.com/jenkins-lab-byu/Somatic_Cell_QC_Pipeline.
Comparison of differential methylation and machine learning analyses
DLK1 identified 52 samples in the FAZST dataset as contaminated; the DMR analysis identified 51. All samples identified by the DMR analysis were also identified by DLK1. The machine learning model identified 123 samples as contaminated, 50 of which were also identified by DLK1. Only one of the samples identified by the DMR analysis was not identified by the machine learning model (). This sample was classified as contaminated by both DLK1 and the DMR analysis.
Correlation analysis
To identify any significant differences between DLK1 pass and DLK1 fail samples, five factors were compared between the two groups: race, age, BMI, sperm count, and whether the individual had previously fathered a live birth (Supplemental Table 3). The only significant difference between the two groups was sperm count (p value: 2.3 × 10⁻⁷). This suggests that DLK1 hypermethylation may be correlated with oligozoospermia.
Discussion
Samples with low sperm counts are sensitive to contamination. Though overt somatic cell contamination can occur in both normozoospermic and oligozoospermic individuals, the presence of somatic cells has a much greater effect on oligozoospermic signatures, making their contamination much more prevalent. With precaution, it is possible to negate the effects of somatic cell contamination in samples with little to no germ cells. High volume washes are recommended, along with caution in performing somatic cell lysis and the use of various checkpoints to ensure the cleanliness of the sample.
The assessment of DNA methylation at imprinted genes in sperm is also particularly susceptible to issues of contamination because their epigenetic signatures arise in a parent-of-origin manner. In germ cells, imprinted genes are either totally methylated or totally unmethylated, depending on the parent-of-origin, but in somatic cells they are always half methylated, consisting of two copies of the same gene: one fully methylated from one parent and one fully unmethylated from the other. Any contamination causes the germline sample’s methylation patterns to look more somatic-like at imprinted sites, shifting the percent methylation from an extreme to a more intermediate value. Multiple studies have made claims about aberrant methylation at imprinted genes in men with oligozoospermia (Marques et al. Citation2004; Kobayashi et al. Citation2007; Song et al. Citation2022). Though some of these imprinted genes may be genuine contributors to male factor infertility, many of these somatic-like shifts could be caused by somatic cell contamination. However, if real modifications are occurring at these sites and are not due to contamination, these data could explain the etiology of some cases of male infertility. Some samples exhibited somatic-like shifts at a small number of regions. These regions may be associated with infertility and should be researched further.
DLK1, a maternally imprinted gene, has previously been used as a checkpoint for contamination. DLK1 is highly differentially methylated in sperm and somatic cells (Jenkins et al. Citation2018). This paper presents two bioinformatic pipelines for identifying somatic cell contamination using DLK1 and additional regions. The traditional DMR model includes 64 DMRs and determines sample contamination based on hypermethylation compared with uncontaminated sample means at these regions. This model also generates a report of methylation plots that demonstrate methylation at each DMR. The machine learning model examines the methylation patterns in 250 DMRs, which are either hypomethylated or hypermethylated in uncontaminated samples. The model estimates the probability of contamination in new samples using a logistic regression. Samples with an estimated probability of 99.999% or higher of being uncontaminated are classified as uncontaminated.
The traditional DMR model relies on a comparison between a sample’s methylation and established cutoff values at a specific locus. It utilizes this differential methylation to identify contamination. While it has only been tested on a small testing set, it may provide subtle information in generated plots that is not visible in the binary output of the logistic regression pipeline. Naturally, as it relies on DLK1 methylation as a requirement for contamination, it did not identify any additional samples as contaminated, but it does provide more information about methylation at other sites across the epigenome. Some samples for example, had aberrant methylation at only a fraction of DMR sites, which implies that those changes were not the result of contamination (which impacts methylation across selected DMR sites).
The logistic regression pipeline classified many more samples as contaminated in the FAZST testing set than DMR analysis or DLK1 did. These data suggest that this model may detect more contaminated samples; however, it did inaccurately classify one sample in the contamination testing set. Another important limitation of this machine learning model is that some of the samples used in the validation set to adjust the contamination threshold percentage (99.999%) were also present in the FAZST testing set. In the future, a similar machine learning model may be able to determine the amount of contamination within a sample; however, the model is currently limited to a binomial output since the training data were inherently binary (pure blood and pure sperm). A continuous model, trained on a large contamination set, would provide insight into the impact of contamination on overall sample methylation, and may inform post-processing adjustments in methylation analyses of partially contaminated samples.
As these models are used on additional datasets, they can be refined to offer more accurate recognition of samples that are contaminated with somatic cells and expanded to predict the percent contamination within a sample. In addition, future contamination profiles could better model typical somatic cell contamination by using smaller percentages of somatic cells. Additional research in this field should also identify areas of differential methylation that are unique to oligozoospermic samples after stringent purification and computational checkpoints for somatic contamination. In future, these models can be expanded to detect contamination from non-blood derived cells, such as immature sperm.
Conclusions
Because sperm cells have an epigenetic profile distinct from somatic cells, purification of sperm DNA is essential in sperm methylation studies. This is particularly true for samples with a low sperm count and/or while studying imprinted genes. The bioinformatic models illustrated herein demonstrate a novel approach to identifying somatic cell contamination within sperm samples. Understanding the inherent risk of contamination and identifying it where possible will allow more accurate identification of truly biologically distinct epigenetic profiles.
Materials and methods
Power analysis
A double-sided t-test power analysis was performed to inform the size of the model training sets. Assuming an effect size of 0.5 for contamination and selecting for power of 95% with a significance level of .05, the analysis determined a minimum of 105 samples were needed.
Public data collection
Sperm DNA methylation signatures were obtained from Infinium MethylationEPIC Array data from 1468 patients seeking fertility care from multiple physicians. This dataset, which comes from the FAZST and is referred to as the FAZST samples, was collected as part of a clinical multi-site study that was published by Jenkins et al. (GSE185920).
Blood DNA methylation data were included as a positive control. Two publicly available Gene Expression Omnibus (GEO) datasets were utilized for this purpose. The first dataset, hereafter blood cohort 1, consisted of Infinium MethylationEPIC Array data from 471 normal-control patients involved in an Alzheimer’s study (GSE153712). The second dataset, hereafter blood cohort 2, consisted of Infinium MethylationEPIC Array data from 558 normal-control patients participating in a schizophrenia study (GSE152026).
Contamination set establishment
To establish contamination profiles, the sperm of four different sperm donors with normal sperm counts were analyzed using an Infinium HumanMethylation450 array. Somatic cell lysis, sperm isolation, DNA extraction, and bisulfite conversion were performed as described by Aston et al. The bisulfite converted sperm DNA was hybridized to Illumina Infinium HumanMethylation450K microarrays at the University of Utah and run as recommended by the manufacturer (Bibikova et al. Citation2011). Unpaired blood samples were collected via venipuncture, and white blood cells were isolated with buffy coat extraction. White blood cell DNA was extracted using Qiagen’s DNeasy Blood and Tissue kit (Hilden, Germany) and bisulfite was converted using Zymo’s EZ DNA Methylation kit (Irvine, CA). All procedures were performed according to the instructions of the manufacturer.
Four permutations were run on each sample, including pure blood, half blood and half sperm by DNA concentration, half blood and half sperm by cell count, and pure sperm (n = 16). Concentration was normalized using a spectrophotometer. A Makler cell counting chamber was used to count white blood cells and sperm, which were then normalized in a 1:1 ratio. Data are publicly available on GEO (GSE246935).
Data preprocessing
Raw methylation array data from all samples were preprocessed using the minfi R package (Aryee et al. Citation2014). SWAN normalization was used to produce beta values for each cytosine-guanine dinucleotide (CpG). Density plots of the beta values of each sample were examined to ensure the distribution of beta values followed a bimodal distribution with prominent peaks between 0.0–0.2 and 0.8–1.0 and flat valleys from 0.2 to 0.8. Any samples not following this distribution were removed and the remaining samples were renormalized using the same procedures previously outlined.
Identification of differentially methylated regions
A sliding window analysis was used to identify regional methylation differences between blood cohort 1 and a randomized 1/3 of the FAZST samples (n = 489). This analysis was performed through the USEQ bioinformatics software package with the Methylation Array Scanner and the Enriched Region Maker applications (Nix et al. Citation2008). This software utilizes a sliding window approach to identify the boundaries of regional differential methylation between two groups. The regions of differential methylation (both hypomethylation and hypermethylation) were identified based on a Wilcoxon signed rank analysis and determined to be significant if they had a phred-scaled false discovery rate (FDR) of ≥40 (corresponding with a corrected p value of ∼.0001) and ≥3 CpGs in any significant window. DMRs with a phred-scaled FDR of ≥40 and an absolute methylation difference of ≥0.9 between sperm and blood methylation were selected for DMR analysis, while regions with a phred-scaled FDR of ≥40 and an absolute methylation difference of ≥0.87 were selected for the machine learning analysis. The absolute methylation difference size was chosen arbitrarily to select appropriate feature numbers.
Cutoff generation and traditional DMR pipeline
To identify contaminated semen samples, a set of 63 of the 121 DMRs were selected. These were chosen because they were highly methylated in blood and highly unmethylated in sperm. These 63 sites were used in combination with DLK1, a region commonly used to detect contamination. Cutoff values for each DMR were calculated as the mean methylation across all 1468 semen samples included in the study at that locus. To account for many confounding factors and establish a robust cutoff, these samples varied in batches, sperm count, BMI, overall fertility, age, and race. Samples that had a mean methylation above the respective cutoff at least 40/64 regions and had DLK1 methylation over .2 were then identified as contaminated. Only the sites highly methylated in blood and highly unmethylated in sperm were used as part of the contamination analysis.
Machine learning model
DMRs that had an FDR of ≥40 and a large absolute methylation difference (≥0.87) between sperm and blood samples were selected for machine learning analysis. A subset of the FAZST sperm samples (n = 489, 33%) was then used to generate hypermethylated and hypomethylated cutoffs for these DMRs.
A training set was created (n = 1010) by combining the FAZST sperm subset with blood cohort 2. The logistic regression-based feature selection from Scikit-learn (Pedregosa et al. Citation2011) was used to identify the 250 most discriminatory DMRs (both hypermethylated and hypomethylated in sperm) and trained several machine learning models (including logistic regression, random forest, neural network, K-nearest neighbor, gradient boosting classifier, and support vector machine) on these regions (Abraham et al. Citation2014).
Models were validated using a separate set of DLK1 pass and DLK1 failed FAZST sperm samples (n = 200) and hyperparameters (including threshold and class weight) were tuned to improve performance. The performance of each model can be seen in Supplemental Table 1. Finally, the model with the highest sensitivity and specificity (logistic regression) was tested on the contamination set of purified sperm, mixed sperm/blood, and blood samples (n = 16) to assess its accuracy in classifying these samples based on their methylation profiles.
Correlation analysis
To identify any significant differences between DLK1 pass and DLK1 fail samples, differences in race, age, BMI, sperm count, and whether the individual had previously fathered a life birth were analyzed. Chi-squared tests were used for categorical variables (race, previous live birth) and t-tests were used for continuous variables (age, BMI, sperm count).
Ethics approval
All research was performed in accordance with the guidelines found in the Declaration of Helsinki. Samples used for the contamination dataset were obtained using an IRB approved through Brigham Young University.
Authors’ contributions
Conceived and designed experiments: TJ, CP, KA; Performed experiments: TJ, CP, CN; Analyzed data: CP, CN; Contributed reagents/materials: TJ; Wrote manuscript: KS, CP, CN; Final edit of paper: KS, CN, CP, KA, TJ.
| Abbreviations | ||
| DMR | = | differentially methylated region |
| DLK1 | = | delta like non-canonical notch ligand 1 |
| CpG | = | 5′—cytosine—phosphate—guanine—3′ |
| FDR | = | false discovery rate |
Supplemental Material
Download MS Word (16.4 KB)Supplemental Material
Download MS Word (44.8 KB)Supplemental Material
Download MS Word (16 KB)Acknowledgments
The analyses performed in this study can be accessed at https://github.com/jenkins-lab-byu/Somatic_Cell_QC_Pipeline.
Disclosure statement
No potential conflict of interest was reported by the author(s).
Data availability statement
The blood cohorts used as controls in this study are available on GEO (GSE152026 and GSE153712). The sperm datasets are available at (doi: 10.1016/j.fertnstert.2015.08.019, doi: 10.1001/jama.2019.18714, and doi: 10.3389/frph.2022.1043904). The contamination set data are available on GEO, accession number GSE246935.
Additional information
Funding
References
- Abraham A, Pedregosa F, Eickenberg M, Gervais P, Mueller A, Kossaifi J, Gramfort A, Thirion B, Varoquaux G. 2014. Machine learning for neuroimaging with scikit-learn. Front Neuroinform. 8:14. doi: 10.3389/fninf.2014.00014.
- Aryee MJ, Jaffe AE, Corrada-Bravo H, Ladd-Acosta C, Feinberg AP, Hansen KD, Irizarry RA. 2014. Minfi: a flexible and comprehensive Bioconductor package for the analysis of Infinium DNA methylation microarrays. Bioinformatics. 30(10):1363–1369. doi: 10.1093/bioinformatics/btu049.
- Bibikova M, Barnes B, Tsan C, Ho V, Klotzle B, Le JM, Delano D, Zhang L, Schroth GP, Gunderson KL, et al. 2011. High density DNA methylation array with single CpG site resolution. Genomics. 98(4):288–295. doi: 10.1016/j.ygeno.2011.07.007.
- Fedder J. 1996. Nonsperm cells in human semen: with special reference to seminal leukocytes and their possible influence on fertility. Arch Androl. 36(1):41–65. doi: 10.3109/01485019608987883.
- Gannon JR, Emery BR, Jenkins TG, Carrell DT. 2014. The sperm epigenome: implications for the embryo. Adv Exp Med Biol. 791:53–66. doi: 10.1007/978-1-4614-7783-9_4.
- Hicks SA, Andersen JM, Witczak O, Thambawita V, Halvorsen P, Hammer HL, Haugen TB, Riegler MA. 2019. Machine learning-based analysis of sperm videos and participant data for male fertility prediction. Sci Rep. 9(1):16770. doi: 10.1038/s41598-019-53217-y.
- Jenkins TG, Aston KI, Hotaling JM, Shamsi MB, Simon L, Carrell DT. 2016. Teratozoospermia and asthenozoospermia are associated with specific epigenetic signatures. Andrology. 4(5):843–849. doi: 10.1111/andr.12231.
- Jenkins TG, Liu L, Aston KI, Carrell DT. 2018. Pre-screening method for somatic cell contamination in human sperm epigenetic studies. Syst Biol Reprod Med. 64(2):146–155. doi: 10.1080/19396368.2018.1434838.
- Kobayashi H, Sato A, Otsu E, Hiura H, Tomatsu C, Utsunomiya T, Sasaki H, Yaegashi N, Arima T. 2007. Aberrant DNA methylation of imprinted loci in sperm from oligospermic patients. Hum Mol Genet. 16(21):2542–2551. doi: 10.1093/hmg/ddm187.
- Kopp A. 2012. Dmrt genes in the development and evolution of sexual dimorphism. Trends Genet. 28(4):175–184. doi: 10.1016/j.tig.2012.02.002.
- Lesani A, Kazemnejad S, Moghimi Zand M, Azadi M, Jafari H, Mofrad MRK, Nosrati R. 2020. Quantification of human sperm concentration using machine learning-based spectrophotometry. Comput Biol Med. 127:104061. doi: 10.1016/j.compbiomed.2020.104061.
- Marques CJ, Carvalho F, Sousa M, Barros A. 2004. Genomic imprinting in disruptive spermatogenesis. Lancet. 363(9422):1700–1702. doi: 10.1016/S0140-6736(04)16256-9.
- Miller RH, DeVilbiss EA, Brogaard KR, Norton CR, Pollard CA, Emery BR, Aston KI, Hotaling JM, Jenkins TG. 2023. Epigenetic determinants of reproductive potential augment the predictive ability of the semen analysis. F S Sci. 4(4):279–285. doi: 10.1016/j.xfss.2023.09.001.
- Nix DA, Courdy SJ, Boucher KM. 2008. Empirical methods for controlling false positives and estimating confidence in ChIP-Seq peaks. BMC Bioinformatics. 9(1):523. doi: 10.1186/1471-2105-9-523.
- Pedregosa F, Varoquaux G, Gramfort A, Michel V, Thirion B, Grisel O, Blondel M, Prettenhofer P, Weiss R, Dubourg V, et al. 2011. Scikit-Learn: machine learning in Python. J Mach Learn Res. 12:2825–2830.
- Qi L, Teschendorff AE. 2022. Cell-type heterogeneity: why we should adjust for it in epigenome and biomarker studies. Clin Epigenet. 14(1):31. doi: 10.1186/s13148-022-01253-3.
- Ricci G, Presani G, Guaschino S, Simeone R, Perticarari S. 2000. Leukocyte detection in human semen using flow cytometry. Hum Reprod. 15(6):1329–1337. doi: 10.1093/humrep/15.6.1329.
- Schisterman EF, Sjaarda LA, Clemons T, Carrell DT, Perkins NJ, Johnstone E, Lamb D, Chaney K, Van Voorhis BJ, Ryan G, et al. 2020. Effect of folic acid and zinc supplementation in men on semen quality and live birth among couples undergoing infertility treatment: a randomized clinical trial. JAMA. 323(1):35–48. doi: 10.1001/jama.2019.18714.
- Song B, Chen Y, Wang C, Li G, Wei Z, He X, Cao Y. 2022. Poor semen parameters are associated with abnormal methylation of imprinted genes in sperm DNA. Reprod Biol Endocrinol. 20(1):155. doi: 10.1186/s12958-022-01028-8.
- Tang Q, Pan F, Yang J, Fu Z, Lu Y, Wu X, Han X, Chen M, Lu C, Xia Y, et al. 2018. Idiopathic male infertility is strongly associated with aberrant DNA methylation of imprinted loci in sperm: a case-control study. Clin Epigenet. 10(1):134. doi: 10.1186/s13148-018-0568-y.
- You JB, McCallum C, Wang Y, Riordon J, Nosrati R, Sinton D. 2021. Machine learning for sperm selection. Nat Rev Urol. 18(7):387–403. doi: 10.1038/s41585-021-00465-1.