Abstract
The increased competition in the global market-place is forcing industrial manufacturers to develop their production systems by increasing flexibility, improving quality and lowering production costs. With the help of simulation techniques, the understanding of manufacturing systems can be enhanced and alternative solutions can be tested. Simulation has, therefore, played an important role in industrial development in recent years. At the same time, energy-related costs have been neglected by Swedish industry due to historically low energy costs in Sweden, in comparison with such costs in other European countries. The developments in the energy market, with uncertainty concerning future prices, have increased the need for energy efficiency. The research described in this paper focuses on methodologies developed to enhance the efficient analyses of energy systems in manufacturing plants by using discrete event simulation. The focus is on electricity use. The paper briefly presents the main features of the methodologies and describes the results from four case studies carried out in the Swedish foundry industry. The methodology improves efficiency by identifying those processes that are important, the activities that must be undertaken and the types of analyses that can be undertaken.
1. Introduction
1.1 Energy use
The continuous economic growth in the industrial countries have helped increase the energy use globally, a trend that is still existent (Jean-Baptiste and Ducroux Citation2003). A significant amount of the total energy used today originates from fossil fuels. Since fossil fuels have an impact on the global warming, the most effective way to mitigate global warming is to improve energy efficiency. Energy efficiency have already helped slow down the increase in energy use and in industrial countries, there is a decrease in energy intensity, if expressed as tonne of oil equivalent per dollar of gross domestic product (Kamal Citation1997). Geller et al. (Citation2006) say that, without the energy efficiency improvements carried out during the last 30 years, the OECD countries would have used 49% more energy in 1998 than they did.
The European electricity market was deregulated in 2004. Due to that there has been a dramatic increase to the electricity prices in Sweden, since Sweden historically has had comparably low prices. The total price is still low due to the low tax for industrial electricity buyers. Other means of control have therefore played a larger role for the electricity efficiency work in Sweden and a lot of work has instead been done to decrease the use of fossil fuels and not electricity.
1.2 Computer simulation
Discrete event simulation (DES), which is the simulation type used in this research, has been used since the 1960s. It is most commonly used in manufacturing and logistics but is also growing in areas such as health care, military applications and agriculture. Simulation is used for describing complex systems and to mimic these systems in computer models. DES can help verifying investments, increase utilisation, remove bottlenecks and increase productivity in systems. It can also be a suitable tool for educational purposes. Since DES is commonly used, there are several commercial programs available today and there is also common methodologies described that are widely used in the simulation community, such as in Banks et al. (Citation2005).
1.3 The project and related work
DES is a powerful tool for analysing manufacturing systems, from several aspects. Energy optimisation methodologies, such as method for analysis of industrial energy system (MIND), is powerful for analysing energy systems. Recent publications by the authors of this paper have shown that both simulation and optimisation provided benefits to companies by reducing the use of energy, from different energy carriers and lowering power levels of electricity. The focus of this paper is on the methodologies for using DES to reduce energy use. The paper describes how data can be collected, categorised and used in the simulation model. Research has also been conducted in the area of combining DES and MIND, for which a software-aided, data collection system was developed. This is described in Section 2.3. However, the use of energy optimisation methodologies will not be further discussed in this paper.
The research presented in this paper was conducted in two different research projects called virtual energy efficiency and integration of energy optimisation and discrete event simulation (INTENS) and is also the main work described in a PhD thesis from the first of the two projects (Solding Citation2008).
2. Data collection
One of the most important stages in advanced manufacturing analyses, such as studies using modelling, simulation and optimisation, is data collection and analysis of the input data. If adequate input data is not available when needed, the project will be delayed and the quality of the results will suffer. There are a number of factors which can result in longer data collection time, for example, inaccurate problem formulation, lack of clear definition of project objectives, high complexity of the system, high level of model detail and poor data availability (Liyanage and Perera Citation1998). Data collection is a time consuming process and most simulation practitioners agree that the collection and analysis of input data takes an extremely long time, typically more than one third of the project time (Liyanage and Perera Citation1998). There are many types of data that might need to be collected (Kelton et al. Citation2004), as most models require a substantial amount of information that involves delays: processing times, travel times, operator work schedules, etc. The amount of data that needs to be collected is highly dependent upon the project objectives and concerns about the credibility of the analysis.
In order to collect data effectively and to carry out the project successfully, it is important to develop a plan at the beginning of the project. Thorough project planning is generally a great advantage, as it saves both time and resources in the long run. Even though a great deal has been written about project management and data collection in relation to simulation and optimisation projects (Reklaitis et al. Citation1983, Robinson Citation1994, Law Citation2003, Lundgren et al. Citation2003, Banks et al. Citation2005), the fact remains that efficient project management, planning and data collection are still highly dependent upon the skill and experience of the project manager.
2.1 Energy auditing
Energy audits often play a vital role in energy efficiency work. Often energy audits are conducted to find ‘easy fixes’ but more thorough energy audits can act as a steady base for further analysis of the energy systems. Common things that are found in more simple energy audits are finding leaks in compressed air systems, analyses of existing engines and pumps, idling losses and other losses due to poor guidelines, and hence inefficient working methods. A more thorough analysis can give a database of energy related data collected from the system and information about the interaction of the parts of the system.
In this research, energy auditing has worked as a first phase of collecting information about the system under consideration. Further data collection was necessary and as described in Section 2.3, a specialised software was developed during the later stage of the research to enable data to be collected in an easier, faster and more standardised way than before.
2.2 Monitoring and measuring
The monitoring and measurement of energy use is a vital part of data collection that ensures a correct representation of the energy system connected to the production system under consideration. There are several commercial solutions available for the monitoring and collection of energy data. Most systems are concerned with electricity use and electricity is the focus of this research.
Load management systems (LMS) are used for the monitoring and control of energy systems. In heavy load applications, LMS are often used for managing the peak loads. This is done by instantaneously reducing the power when necessary. The power to one, or a few parts of the system, is reduced or shut down resulting in a more even peak load. These systems can be used to manually identify the reasons that peaks occur but are not often used to analyse those interactions between equipment in the production system that cause the peaks to occur. This lack of predictive analysis is the main disadvantage of such systems.
2.3 Software aided data collection
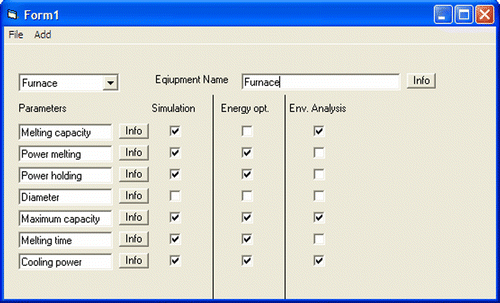
On the basis of the problems discussed, a software tool was developed with the aim of aiding the data collection phase in simulation and optimisation projects. The software is good for assisting experienced project managers in collecting, organising, visualising and sharing data and information. The tool can help the project manager to ask the process owner the right questions and to identify the data needed. There is a simple visualisation of the manufacturing resources and their correlations with each other, which will allow the important pieces of equipment to be identified more easily. Furthermore, there is a simple interface making it easy to add more equipment and parameters, see Figure . In the view in Figure , it is seen that the tool is built to be used for several categories of projects. In this case, there are simulation, energy optimisation and environmental analysis projects. A database is used for storing the data. The main function of the software is the provision of hints and guidelines for data collection. The main advantage is that it forces the project manager to carry out the project in a structured and standardised way, thereby minimising the risk of overlooking important steps. If the software tool is used throughout the project, it can be used as a communication platform, preventing the misunderstandings between the process owner and the project manager. The outcome of using the software should be improved efficiency and a reduced need for complementary data collection activities.
Figure 1 One view in the software that aids data collection.
The software developed has been used for simulation and optimisation projects conducted in research at Swerea SWECAST and Linköping University. However, further development is needed and is continuous. More information can be found in Petku et al. (Citation2008).
3. Using energy data in a simulation model
The key issue when trying to include energy aspects in an analysis of a production system is finding a way to use the data in an efficient way. Data can be available with different levels of detail and the analysis can also be conducted with different levels of detail. A general approach to managing energy related data in a DES model was developed.
3.1 Categorising energy using equipment
It was discovered quite early in the research that it was necessary to decide how input data should be modelled and used in the model. In relation to this, it was also necessary to decide how output data should be represented. Unlike traditional input data, such as cycle times, set-up times and down-times, electricity data is continuous and more complex from a modelling perspective. Energy audits and measurements provided considerable energy data, but after thorough analysis, the data was found to vary significantly between resources. A few patterns were found in the data and hence, there were several ways in which the energy data could be represented. Four main categories were identified in the vast amount of data analysed from the four case studies conducted. Short descriptions of these different categories and examples of how they look when visualised in graphs are provided elsewhere by the authors (Solding Citation2008, Solding et al. Citation2009). The categories were specific to the foundry industry case studies conducted for this research; there might be other processes within other types of businesses that can be categorised in other ways. The four categories considered in this research were:
| 1. | A stochastically represented load when working, while idling and while off, see Figure .
Figure 2 Example of category 1. 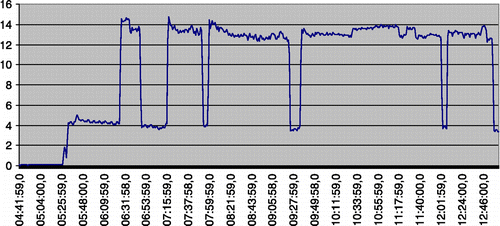 | ||||
| 2. | One stochastic representation during simulation, see Figure .
Figure 3 Example of category 2. 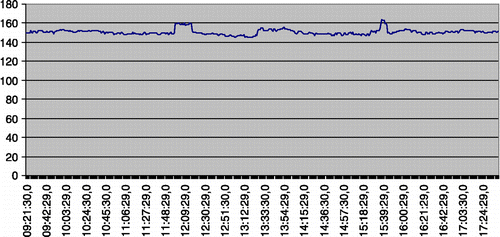 | ||||
| 3. | A parameter which varies over time and/or with the situation, see Figure .
Figure 4 Example of category 3. 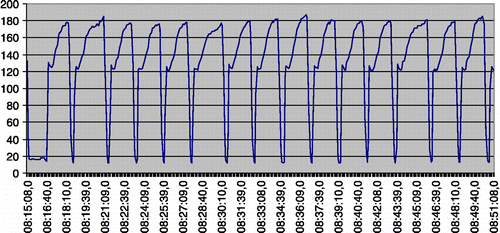 | ||||
| 4. | A special logic, due to special or complex use of the resource which does not fit into the first three categories, see Figure .
Figure 5 Example of category 4. 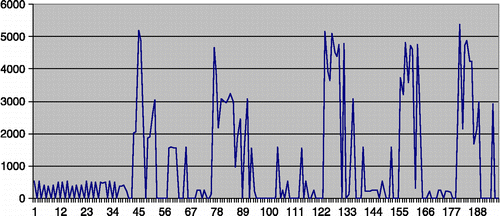 | ||||
3.2 Using states when modelling
The control for different levels of power use is handled in the modelling phase by assigning a power use for the different states that the resources are in. The three most used states are: working, idling and off. However, more states are needed for modelling some of the processes. For example, the melting process might have a special holding state and there might be an infinitely variable power load curve when ramping up the furnace. Often, there are two furnaces connected to the same power source, so called twin furnaces, which limits the maximum power that can be drawn when using the two furnaces at once. Using defined and thoroughly controlled states makes it easier to keep a general approach to the modelling and handling of input and output data. When some adjustments have to be made for some process, as for the twin furnace operation, these are made by adding extra states in the model. This working procedure makes it important to have a good knowledge of the DES program used. Different programs have different predefined states. Some programs have none and some several. This is especially important when using predefined logic for handling events in the model, resources can enter states that are not expected, resulting in false results. Hence, the modeller should always keep track of which state the resource is in. One way of keeping track of this is by categorising all predefined states into those three groups described earlier, i.e. working, idling and off. Another way is to only use states defined by the modeller and not use predefined logic.
The states, both predefined and added, are used when showing power use of the processes during and after a simulation run. It is impossible to show power use continuously due to the large amount of data it would create. Instead different time intervals, Δt, are decided on which an average power load is calculated. A short enough Δt will give a sampling interval that will resemble a continuous behaviour. However, a very short Δt is not often necessary. Most electricity subscriptions for Swedish foundries are based on the highest average power for one hour during the previous year. Therefore, it is not often necessary to have a Δt that is shorter than one hour. However, when a more detailed analysis of the behaviour of the system is needed or if a LMS is emulated, a smaller range is preferable.
During one Δt, it is possible for a process to be in more than one state. Therefore, the time the process has been in a specific state has to be calculated for all states and for all Δt during the run. For calculating, the average load for a process during one Δt and for the most common states working, idle and down, Equation (Equation1) can be used.
Where the power load for each process is a constant, this constant is used directly in the formula. However, when input data is more detailed, so that each state is represented by a stochastic distribution, the distribution is used. But the distribution cannot be used directly in the formula due to the possible large variations of output from a distribution sample. Instead a mean of several distribution samples is used for longer sample lengths. In this solution, each state during a Δt is multiplied with at least one sample from a stochastic distribution. However, when the length of Δt is longer there are several distribution samples for each Δt, which evens out possible samples that are close to the edge values for a distribution. The calculation will then look like Equation (Equation2).
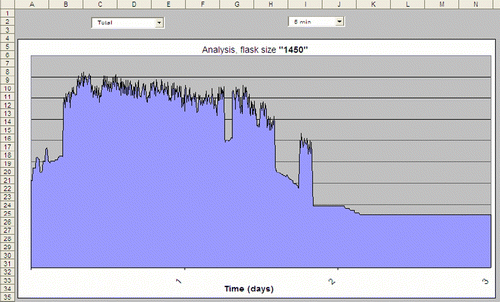
Figures and illustrate how different values of Δt affect the visualisation of the output data in the graphs. The two graphs show the result from the same run but with sample lengths of 1 h and 5 min, respectively.
Figure 6 Average energy use for intervals of 1 h.
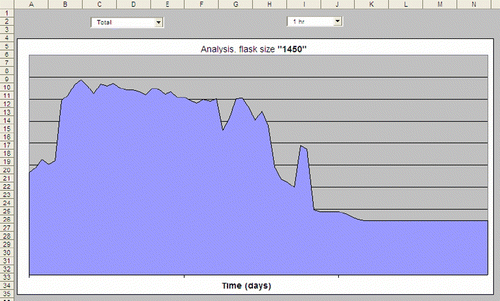
Figure 7 Average energy use for intervals of 5 min.
3.3 Altering data for analysis of the system's energy efficiency
Certain parameters are more vital than others when analysing energy use and these parameters need to be changeable. The parameters that need to be changeable are:
| • | The power use of processes. Can be changeable either manually or automatically. To do it automatically, may be a way to simulate the LMS of the facility but one has to be aware that the simulation model will not behave exactly as the system at any particular moment. It can therefore be more harmful than beneficial to simulate the behaviour of the LMS since the restrictions the LMS puts on the facility's processes will change other parameters, in a way that is unpredictable. | ||||
| • | The electricity prices. These may vary during the day, the month or the year depending on the type of subscription and market fluctuations. To be able to alter electricity prices, alternative production schedules or alternative shifts can be simulated and analysed. For example, if the price is higher during the day, it might be economically beneficial to melt during the night and morning and hold it during the day. | ||||
| • | The tax levels and other related costs such as costs related to the EU ETS (Citation2009) and the ECS (SEA Citation2006). As in the previous example, this can be used to evaluate how different taxes and costs will affect the total cost of running the production system. | ||||
| • | The length of the output interval. Depending on the use of the model different levels of detail are needed for the graphs that represent power use. Since most subscriptions are based on the highest average for an hour, that interval is usable in many cases. This was described in more detail in Section 3.2. | ||||
4. Industrial applications
4.1 The Swedish foundry industry
The case studies performed in this research were conducted within the Swedish foundry industry. This industry, with almost 200 companies and some 10,000 employees, has an aggregate domestic turnover of 1.3 billion Euros. Swedish foundries produce some 354,000 tonnes of castings annually of which 74% are iron castings, 19% nonferrous castings and 7% steel castings (Swerea SWECAST Citation2006). By way of comparison, the total production of castings in Europe in 2005 was 16,557,000 tonnes (CAEF Citation2006). Germany is the largest producer in Europe with 5,108,000 tonnes followed by Italy with 2,541,000 tonnes. The largest producer in the world, China, produced 22,420,000 tonnes in 2005 and the second largest, US, produced 12,314,000 tonnes (CAEF Citation2006).
The foundry industry is considered to be an energy and electricity intensive industry. The companies are together with companies in other energy-intensive industries, particularly, sensitive to higher electricity prices. This is due to their large electricity consumption, their large relative use of electricity compared to the aggregated energy use and very high shares of energy costs, 5–15%, in relation to the added value (Thollander et al. Citation2005).
4.2 Energy intensive processes
Processing is the principal use for energy in foundries, in particular, the melting and holding of molten metal (Thollander et al. Citation2005). The quantity of energy used to melt metal is approximately proportional to the amount of molten metal. The casting yield (the total weight of good castings in relation to the total weight of molten metal) varies from 85 to 95% for simple and heavy grey iron castings from 40 to 50% for the production of small ductile iron castings in mechanised volume production (DETR Citation1999). Improving the yield will immediately reduce the energy use per time unit. The reduction of scrap is another important issue, which has two effects. First, the energy required for melting is reduced and second, material use, the use of other consumables and the personnel needed are reduced, thus increasing overall capacity and improving efficiency. Apart from production processes, such as melting and holding, energy use in the support processes, such as ventilation, lighting and space heating, has often received less attention. One reason for this is the previously mentioned historically low electricity prices (Trygg and Karlsson Citation2005).
4.3 Load prescription and other factors
The subscription costs for a foundry roughly consist of three parts: variable electricity cost, grid costs and taxes. The variable electricity cost is based on the actual electricity use during a period of time. The grid cost is set by the owner of the grid and is difficult to change since the market is a monopoly. The grid cost itself consists in turn of three parts. One part is based on the actual electricity use and works like a variable cost, though charged instead by the owner of the grid. The second part is the amount of power subscribed by the company. The third and last part is based on the power used by the company the previous year, where the highest peak load (mean of one hour) decides the cost. The electricity taxes are currently approximately 55 Eurocents per MWh. Due to the deregulation of the electricity market the foundries are now able to choose where they buy their electricity from. They can now buy from the spot market directly, from a power company or from other actors in the market.
Due to the way the electricity cost is structured, there are incentives not just to keep the actual use to a minimum, but also to keep the peak power loads as low as possible. Keeping the peak power loads down will not only reduce the subscription level for the following year, it will also reduce the risk of being fined for breaching the subscribed amount for the current year. This scheme for electricity subscription is the most common in Sweden today but may vary between companies. With increased integration into the European market there may also be changes in how electricity and power are subscribed. Variations may then also occur daily, which is not currently the case in Sweden. This is because the electricity system in Sweden is energy-dimensioned as opposed to large parts of continental Europe's electricity systems, which are power-dimensioned. In continental European countries, the prices are both higher and vary more during the day. Since the Nordic market is small compared to the rest of the markets in Europe, it is most likely that the Nordic countries will adapt to European conditions, resulting in higher prices and more variations.
4.4 Overview of the case studies
The foundries in the study are sand moulding foundries. These foundries use more energy than pressure die casting foundries. This is mainly because the metal used is iron and steel, which demands more melting energy than, for example, aluminium which is the metal most used in pressure die casting. The companies in the study range from small (less than 50 employees) to medium-sized (between 50 and 250 employees).
The design of each case study varied as each study's focus was informed by the foundry's manufacturing complexity and the level of detail in the electricity data available.
In the four companies studied, the knowledge of use of both simulation and energy efficiency work varied considerably. There was one company that had worked with energy efficiency intensively for a long time using advanced data collection, monitoring and control and with a well-structured approach to investing in energy efficient equipment. Another company had also worked with energy efficiency for a long time, but with less data monitoring and control. One company had used simulation for a period with good results. In general, people had more knowledge about energy use than about the use of simulation (Table ).
Table 1 Companies selected for case studies.
Two different simulation programs were used: AutoMod from Applied Materials (Citation2009); and ED from Incontrol Enterprise Dynamics (Citation2009). These two programs were not chosen for any particular reason, the methodology described and the work undertaken was independent of the simulation program used. A common feature of each of the case studies was that all the data was stored in an intermediate database or in a spreadsheet. This simplified data alteration and enabled easy analysis of multiple runs. To fit distributions to data, a program specially made for the purpose, ExpertFit (Citation2008), was used.
It should be noted that all simulation models were built individually for the purpose of this research. All processes are programmed to behave in the way that they behave in reality, using the built in programming languages of the programs used. Not all information behind every model can be or is shown here due to the vast amount of programming code used. Only the information vital for describing the use of the methodology proposed is presented here.
4.4.1 Case 1 – medium sized iron foundry
The main objective of this case study was to identify, if the plant was run in the most efficient way and to find possible improvements in the way the company works in terms of electricity use.
The company has a track record of energy efficiency work and is considered a pioneer in the Swedish foundry industry. The company has a well-defined energy and environmental policy and has a long history of measurement and improvement work. They have a well-defined and extensive manufacturing supervision and control system, which was used to draw electricity data from. Not all processes in the plant were modelled. The processes that were modelled account for 75–80% of the total electricity use in the foundry. The furnace accounts for most of the electricity use. The model considered five different states of which the two most common states were melting and holding. Information about the electricity system was given by the energy expert in the foundry's maintenance department. Production data was also collected from the supervision system as well as from the business system. The experts in the maintenance department the production planner and the foundry manager also gave vital information about the system.
Simulations and analyses showed that the moulding, core mounting, pouring, initial cooling, knockout and mould changing work together in a line, and are therefore fairly sensitive to interruptions. An analysis of historical data for the furnaces showed that they were occasionally in the holding state for a long time. This mainly happened when problems had occurred somewhere in the line, but also at times when the melting was working too fast for the line. Reasons for the furnaces working too fast could for example be that smaller parts were produced and less molten iron was needed. The times that the line had to wait for the furnaces were few. With this knowledge, alternative solutions for improvements were proposed and modelled. From the simulation, it was established that an increase in the information flow from the moulding process to melting would enable melting to better schedule metal requirements and furnace start times. It turned out that holding times could be decreased from 58 to 21% of the total time during active production which was a reduction of 64%. A certain amount of holding is always necessary due to testing times and the pouring time when emptying the furnace.
4.4.2 Case 2 – small iron foundry
The main objective of this study was to reduce the maximum total power load of the plant through improved planning of activities.
The foundry process is concentrated in one moulding line and two furnaces, one of which is in operation most of the time. Only occasionally are both in operation, but when they are both in use this presents an interesting problem with regard to power use. The main activity that results in simultaneous furnace operation occurs every ten days, when the most frequently used furnace is rebuilt and sintered. The sintering process requires the rebuilt furnace to be subjected to a progressive load during a period of approximately 8 h. This process is required to get the best performance from the furnace. During the sintering process, the second furnace is used for melting. The process of sintering is normally started early in the morning. After the furnace is up and running again, usually around lunch-time, both furnaces are used during the rest of the day.
All processes in the foundry were modelled and it was possible to look at the actual peak power loads of the company. The main parts of the production-related information used when building the simulation model, as well as the electricity related information, are based on documentation, interviews and observations. Most of the detailed scheduling information was given by the production planner, but additional information was collected from other personnel. Order lists are based on historical production.
The solution to the need to reduce maximum total power load for the plant was achieved by conducting the sintering operation at a time of day when it was unnecessary to operate the second furnace. The simulation model showed that by doing this the peak power loads could be decreased by 8%.
4.4.3 Case 3 – medium sized iron foundry
The objective of this case was to analyse the effect of production planning on foundry productivity and electricity use. The intention was to evaluate different alternatives in planning strategies with the help of the simulation model. The objective was to see how alterations to the way production was run might improve planning of the melting, holding and moulding operations, and their interactions, to reduce holding losses due to gaps between melting and moulding. The company was also interested in comparing the performance of its existing furnaces with that of a new set of modern furnaces.
As a starting point an extensive energy audit had been conducted. Additional measurements were made during the project to add to the data in the energy audit reports and to update older figures. Production parameters were gathered from the business systems and from the production personnel, who described the complex planning of furnaces and alloys for the different castings in the different lines. The model considered only the furnaces (melting and holding furnaces), the moulding lines and the ladles that are used to move metal from furnaces to moulding lines.
Studies showed how different production plans affect productivity and electricity use in the foundry. There is generally a connection between efficient production and efficient electricity use. One representative example is when two moulding lines request the same alloy from the same holding furnace at the same time. When this occurs, the production is inefficient and results in excessive electricity use. In some instances, electricity use is indirectly affected by production efficiency. One example is the interaction between the melting and holding furnaces. Generally, the holding furnaces are completely filled during the night. The amount of molten metal that is used during production varies greatly. Sometimes the need for molten metal is too small, so the molten metal is set on hold for a long time, sometimes for more than 24 h. The moulding lines also have to stop at times due to a lack of metal. Both these issues can be addressed through better planning. If the moulding lines are planned to reduce the number of overlaps, the problem of waiting for metal is reduced. The second problem could be addressed by planning production, so that the amount of metal needed during the day is controlled. The planning will be more predictable, if historical data for the different products is used. Alternate plans were tested in the simulation model, based on the solutions discussed, which showed that there are alternative ways in which to plan the production so that less energy is used.
The second question, regarding the benefits of investing in a new set of furnaces, was not solved using simulation. Instead mathematical energy optimisation was used, using the MIND method. It was found that it was not economically beneficial to invest in new furnaces, this is discussed by Thollander et al. (Citation2009).
4.4.4 Case 4 – medium sized steel foundry
The objective of this case study was to build a detailed production-planning model. The model would be built to produce detailed schedules from a set of predefined rules. From the schedules, the electricity system would be analysed to see how well the best schedules from a productivity point of view relate to electricity use.
The method used in this foundry is based on the vacuum-sealed, moulding process in which the moulding sand is vacuum packed in a method analogous to the vacuum packaging of dry goods like coffee. This method demands that the vacuum be continuous to prevent the moulds from collapsing. The most important processes in the model are the furnace and the vacuum system, and the processes that are modelled account for more than 80% of the total electricity use in the foundry. Production parameters were gathered from the company business system. It was important to be able to easily import a preliminary schedule from the business system to a spreadsheet to minimise the manual work required. This was achieved by a thorough analysis of the data available in the system and the structure of the business system. Standardising the way data was exported from the business system made it easy to import data sets to the spreadsheet without additional manual work.
The main conclusion derived from this case study was that the simulation model generally generated more efficient schedules than manual planners, due to the fact that the model made every decision along the way based on the, at the time, current situation on the shop floor. When planning manually, it is impossible to look ahead and predict exactly what the situation will be like before every new event in the future. Using the schedules generated by the simulation model achieved a more efficient use of the furnace. More finished batches were produced during the same period than before. According to the production technicians responsible for using the simulation model, productivity could be increased by 10–15% by using plans generated by the simulation model. In tests, in which the productivity (number of details produced) was constant, the electricity use could be reduced by 5%. The mix of products was also better in the later stages of the manufacturing chain, for instance when undertaking cleaning and heat treatment. The overall load on the equipment, as well as on the personnel, was levelled out and reduced. Due to the more even workload, the work environment was improved and the wear on the equipment reduced. It was also shown that electricity use was levelled out over the day.
5. Concluding summary
This paper has presented methodologies for including analyses of production systems and their corresponding energy systems in the same model using DES. A way of categorising energy-related data and using it in a simulation model has been described. Four case studies were conducted that showed that it is possible to lower energy use, peak power loads and their corresponding costs. With the aid of a newly developed software, it was easier to collect data that are shared between two different applications. This software, as well as the other methodologies, is being enhanced in ongoing research projects. The analysis of energy use, as described in this paper, will first of all help companies to lower both their energy use and peak power loads. Secondly, it will help companies increase their competiveness through lower production costs, especially since energy prices have increased considerably and are likely to increase further in the future.
6. Future work
The research presented has proven that DES is a well-suited tool for analysing energy use in industrial facilities. Some future work and improvements have been identified. The methodology can be improved by adding optimisation possibilities to the simulation model. The way the simulation models are built can be improved by adding more automation to the data collection and data management parts, so that more information can be collected automatically from the plant and fed into the model. Also integrating the simulation model with existing load/energy management system can enhance the results.
Furthermore, there is a need for testing the methodology in other businesses than the foundry business to identify similarities and differences and make the methodology even more generic. The Swedish foundry industry is electricity intensive which is not necessarily the case in other businesses. If looking at the electricity produced in Sweden the emissions are fairly low due to the fact that most electricity comes from water power and nuclear power plants. If looking in a European perspective, the electricity generates a lot of emissions since there are lots of power plats run on fossil fuels. So, the energy efficiency and emission reduction potential in the rest of Europe, and the rest of the world, is significant.
Acknowledgements
The authors would like to thank the Swedish Energy Agency for their sponsorship of the research projects Virtual Energy Efficiency and Integration of Energy Optimisation and Discrete Event Simulation (INTENS).
References
- Applied Materials, 2009. Available from: www.appliedmaterials.com (http://www.appliedmaterials.com) [Accessed 7 April 2009]
- Banks , J. 2005 . Discrete-event system simulation , 4th ed. , International Series in Industrial and Systems Engineering Upper Saddle River, NJ : Prentice-Hall .
- Department of the Environment, Transport and the Regions (DETR) . 1999 . Good practice guide 17. Achieving high yields in iron foundries , Harwell : DETR .
- EU ETS, 2009. Available from: http://ec.europa.eu/environment/climat/emission.htm [Accessed 7 April 2009]
- ExpertFit, 2008. Available from: http://www.averill-law.com/ExpertFit-distribution-fitting-software.htm [Accessed 7 April 2009]
- Geller , H. 2006 . Polices for increasing energy efficiency: thirty years of experience in OECD countries . Energy Policy , 34 ( 5 ) : 556 – 573 .
- Incontrol Enterprise Dynamics, 2009. Available from: www.incontrol.nl (http://www.incontrol.nl) [Accessed 7 April 2009]
- Jean-Baptiste , P. and Ducroux , R. 2003 . Energy policy and climate change . Energy Policy , 31 : 155 – 166 .
- Kamal , W.A. 1997 . Improving energy efficiency – the cost-effective way to mitigate global warming . Energy Conversion and Management , 38 ( 1 ) : 39 – 59 .
- Kelton , W.D. , Sadowski , R.P. and Sturrock , D.T. 2004 . Simulation with ARENA , 3rd ed. , Series in Industrial Engineering and Management Science New York : McGraw-Hill .
- Law, A.M., 2003. How to conduct a successful simulation study. Proceedings of the winter simulation conference, New Orleans, LA, USA
- Liyanage, K. and Perera, T., 1998. Rapid data modelling techniques in simulation of manufacturing systems. Proceedings of the 12th European simulation multiconference on simulation, Manchester, UK
- Lundgren , J. , Rönnqvist , M. and Värbrand , P. 2003 . Optimeringslära [Optimization] , 2nd ed. , Lund : Studentlitteratur . (in Swedish)
- Petku, D., Mardan, N. and Solding, P., 2008. Software aided data collection methodology. Proceedings of the 18th international conference on flexible automation and intelligent manufacturing, Skövde, Sweden
- Reklaitis , G.V. , Ragsdell , K.M. and Ravindran , A. 1983 . Engineering optimization methods and applications , New York : Wiley-Interscience .
- Robinson , S. 1994 . Successful simulation: a practical approach to simulation projects , Berkshire : McGraw-Hill .
- Solding, P., 2008. Increased energy efficiency in manufacturing systems using discrete event simulation – applied studies on the swedish foundry industry, Thesis (PhD). Faculty of Computer Sciences and Engineering, De Montfort University, Leicester, UK
- Solding , P. , Thollander , P. and Moore , P.R. 2009 . Improved energy efficient production using discrete event simulation . Journal of Simulation , Accepted for publication
- Swedish Energy Agency (SEA), 2006. Renewable electricity through electricity certificates, Report Number ET2006:54, Energimyndighetens förlag [online]. Available from: www.energimyndigheten.se/web/biblshop.nsf (http://www.energimyndigheten.se/web/biblshop.nsf) [Accessed 4 September 2007]
- Swerea SWECAST, 2006. 2006 – ett nytt rekordår för de svenska gjuterierna – Gjuteribranschen fortsatt het. [2006 – A new record year for the Swedish foundries – The foundry industry is still hot], (in Swedish), [online]. Available from: http://www.gjuteriforeningen.se/aktuellt/pressrelease0703.pdf [Accessed 19 December 2008]
- The European Foundry Association (CAEF) . 2006 . The European foundry industry 2005 , Dusseldorf, Germany : CAEF .
- Thollander , P. 2005 . Reducing industrial energy costs through energy efficiency measures in a liberalized European electricity market – case study of a Swedish iron foundry . Applied Energy , 81 ( 2 ) : 115 – 126 .
- Thollander , P. , Mardan , N. and Karlsson , M. 2009 . Optimization as investment decision support in a Swedish medium-sized iron foundry – a move beyond traditional energy auditing . Applied Energy , 86 ( 4 ) : 433 – 440 .
- Trygg , L. and Karlsson , B. 2005 . Industrial DSM in a deregulated European electricity market – a case study of 11 plants in Sweden . Energy Policy , 33 ( 11 ) : 1445 – 1459 .
