Abstract
This paper addresses sustainable benefits of remanufacturing tyres. An agent-based simulation approach is used to tackle this research problem by identifying different agents such as tyre, collector, recycler and remanufacturer. Details related to every agent are provided to show the decisions taken by these agents and the impact that may have on tyres' remanufacturing industry. Relying on input data from published reports and papers by academics and professional organisations, experiments are conducted on various scenarios to show the benefits of increasing the retread percentage of passenger car tyres. The results show that retreaded tyre can capture almost 25% of replacement (sales) market, resulting in significant reduction in scrap tyres and raw material consumption. This percentage can further be increased by increasing the number of retreads per used tyre and the life of tread rubber. The output results help in finding the profit break‐even point at various levels of retread. The results also show other decision-making implications, particularly related to rejection rate and ways to reduce it.
1. Introduction
Governments' legislations imposed on manufacturing industries for environmental sustainability and the inherent business opportunity have led to an increasing interest in reverse logistics/remanufacturing during the last two to three decades. A variety of products such as automobiles, electronic equipments, printer cartridges and tyres contain valuable parts even after the end of their service life. In many cases, the remanufacturing of these products is one of the best ways to recover this value. Numerous models have been developed to assist organisations in streamlining the reverse flow of products and to make it economically attractive. Similar to this would be the case of tyres. Based on the recent data in the USA, on an average, 290 million passenger tyres and light truck tyres are sold each year for original equipment (OE) and replacement (RE) tyres market, and similarly about 20 million tyres for medium and heavy trucks. OE tyres are those installed on brand new cars, and RE tyres are those sold to replace the worn OE tyres. After its use, all of these tyres become a massive solid waste. To control the amount of scrap tyres produced, government imposes strict laws for their proper disposal. Tyre itself is not hazardous, but if stockpiled in large quantity it poses a threat of fire and breeding of other disease-carrying insects in the rainwater that is collected in the curve of tyres.
Fortunately, a used tyre is not completely useless because during the service life only the outer part or the tyre tread is worn out where, in most cases, the tyre casing would remain intact. In the production process, casing receives almost 60% of all the value-added process (Ferrer Citation1997); therefore, it becomes necessary to reclaim as much value from a used tyre as possible. Depending on the condition of casing, a used tyre can either be remanufactured (retreaded) or be sent to scrap where it may be used to produce energy (burning as a fuel) or rubber (sporting grounds, moulded parts, mixing with asphalt, etc.).
By far, retreading is the best option available as it extends the useful life of tyre, decreases the number of scrap tyres generated each year and, above all, it reduces the amount of natural resources and energy used in producing a new tyre. Many research works are underway to reduce gas emissions and make electrical cars more marketable. However, no matter how efficient the fuel is or emission-free a car can be, it has to have at least four tyres. This fact will also be well reflected by the increasing number of cars in emerging and very populated countries such as China where car sale has jumped from 6.3 million in 2007 to 10.3 million in 2009 (Organisation Internationale des Constructeurs d'Automobiles, OICA Citation2009) and it is expected to increase by 20% yearly. This has increased the demand for rubber and crude oil required in the production process of tyres so that making retread much more crucial.
The advantages of retreading have long been realised by commercial truck fleets and especially by military. As a result, 90% of all heavy truck tyres and other off-the-road tyres (OTR) are retreaded whenever possible. According to modern tire dealer (MTD) – a private organisation that collects data on North American tyre market – most of truck tyre retreading market in the USA is represented by major RE tyre manufacturers. Trucking industries and the brand owners have developed tyre management programme to optimise the life of tyre by properly maintaining it under use and retreading it before the casing is damaged.
Despite all the facts, the number of passenger car tyres retreaded is still minimal. The reason may be the misconception about the quality of retreaded tyres in customer mind as observed by the survey titled Customers' Tire Buying Habits and Their Knowledge of Tire Maintenance, Recycling and Disposal (CIWMB Citation2003). Also, customers tend to buy new tyres if the price difference is not significant, especially when the prices of some imported tyres are even cheaper than the retreaded ones. Tyre manufacturers are willing to adapt this sustainable way of production, but for passenger car tyres low return on investment in retreading due to higher labour cost required and low demand makes it economically less viable. A number of awareness campaigns are trying to establish the quality of retreaded tyres; therefore, if the retreads become acceptable to customers, it is important to assess this fact with regard to the tyre industry and sustainability.
In this paper, an agent-based simulation model is developed to study the environmental benefits of increasing the percentage of retreads and the effects on key players involved in remanufacturing of tyres, namely OE manufacturers (OEM) and RE tyre manufacturers, retreading plant, collectors, haulers (transporters) and rubber recyclers. The aim of this paper is to help find a way where tyre retread acceptance and use may be assessed from a different point of view by emphasising the importance of sustainability and the conservation of natural resources rather than focusing strictly on economical factors. Also, the model presents some scenarios to help sensitising government regulators to offer some incentives to retread remanufacturers as tyre remanufacturing may contribute to preserving natural resources and reducing greenhouse emissions.
The remaining of this paper is organised in the following manner: Section 2 presents a review of the literature related to reverse logistics issues/methodologies and more specifically, about the remanufacturing of tyre industry. Section 3 discusses the life cycle of tyre and highlights the key end-of-life (EOL) alternatives. Section 4 presents a detailed description of the simulation model. Discussions of the results and conclusions are presented in Sections 5 and 6, respectively.
2. Literature review
The profitability of remanufacturing has been realised and reported by a number of organisations and authors. Researchers have also considered many factors that may affect the decision of remanufacturing. For example, Ferrer and Swaminathan (Citation2006) developed a model for an infinite horizon in duopoly environment to optimise price and quantity of product mix. They also suggested the conditions to maximise the profit from remanufacturing product. Ferrer and Ayres (Citation2000) showed the economical impact of remanufacturing.
Several studies related to a particular industry have also been published. For example, Fleischmann (Citation2001) discussed IBM machine and part recovery process, and Barros et al. (Citation1998) provided a case study on the design of logistics network for recycling sand from construction waste. Different models for carpet recycling network are presented by Louwers et al. (Citation1999) for European market and by Ammons et al. (Citation1999) for the USA. Recently, Biehl et al. (Citation2007) have suggested many managerial actions to increase the return rate and recyclability of carpet. They analysed overall carpet market through reverse logistics (RL) parameters such as return rates, information technologies and product design by performance of inventory levels' backlogs and production cushion. As tyre remanufacturing is the focus of this paper, the literature survey on this topic is given below.
Several authors have given examples of tyre remanufacturing (retreading) to illustrate their reverse logistics models (Ferrer and Ayres Citation2000, Beullens Citation2004). Two important analyses of tyre remanufacturing were conducted by Lebreton and Tuma (Citation2007) and Ferrer (Citation1997). The latter evaluated the economical aspect of retreading. He provided details of value-added processes in production and remanufacturing of tyres. This paper suggests retreading and incineration as first and second best recovery alternatives, respectively. It also gives the maximum number of retreads for tyres based on the expected cost, revenue and yields.
Lebreton and Tuma (Citation2007) used data from European tyre market to approximate the revenue generated by retreading. In their model, they considered the production and remanufacturing of three types of tyre (summer, winter and truck tyres). They also introduced key parameters for reintegration potential and customer perception for different demand segments. Through their linear programming (LP) model, they showed that retread market for truck tyre is already at a saturated state, whereas car tyre remanufacturing is not economically attractive due to customers' unwillingness to purchase retreaded tyres.
The earlier studies on tyre remanufacturing show that authors have focused either on environmental or on economical effects of retreading in present market condition, but not on the effects of increasing the number of retreads on RE market. As we know that each retreaded tyre shall replace a new RE (NRE) tyre; Therefore, with the increase in remanufacturing, the revenue of tyre industry may decline. In this paper, agent-based simulation techniques are used to model tyre industry. The simulation model is then used to study changes that tyre manufacturers will encounter by starting remanufacturing on a large scale, particularly for passenger car tyres, and highlights the extent of environmental benefits we may get by increasing retread sale. The simulation model considers the proportion of RE market that can be captured by various degrees of retread and the massive reduction in natural resources' consumption, which is one of the many motivating factors of this study.
3. Tyre industry
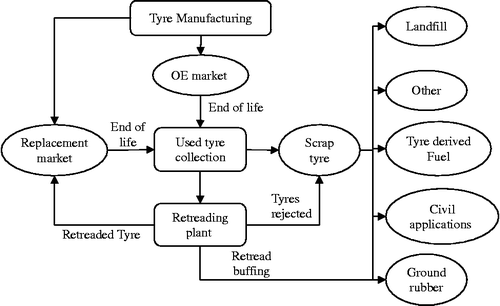
To create a better understanding of tyre industry, this section gives a brief insight into the current situation and discusses the tyre's life cycle and various options available for the recovery of its remaining value. The key steps of tyre industry and the flow of tyre through the different stages of its useful life are shown in Figure . Tyre manufacturers are responsible for fulfilling the demand for OE market, which is driven by sales of new vehicles. Once the tyre completes its life, it is collected by retailers or specific collection sites. From there, retreadable tyres are sent to retreading plants, whereas scrap tyres are distributed to various scrap markets according to their demand. Rejected tyres from retreading facilities and ground rubber produced in the tyre buffing process are also sent to scrap market. Successfully retreaded tyres are sold in RE market, whereas rest of the demand is covered by NRE tyres.
Figure 1 Overview of tyre industry.
The tyre industry may be divided into two large groups on the basis of tyre sizes and market characteristics: passenger/light (P/L) vehicle tyre and medium/heavy (M/H) truck tyre, which also includes other OTR tyres. According to statistics provided by ‘MTD’ for the USA tyre shipments (MTD Citation2010), the total production of P/L tyres in 2007 was almost 300 million units, which is comprised of about 80% of RE tyres and 20% of OE tyres. Similarly, the total shipment of M/H tyres was 22.76 million, with 74% of RE and 26% of OE tyres. The life expectancy of a P/L vehicle is 9.6 years (Polk Citation2009), and that of P/L tyre is 2–3 years. Therefore, it is reasonable to estimate that on an average, each OE tyre is replaced four times (the maximum is five times) with RE tyre before the vehicle reaches its EOL. This is also evident from the fact that in the USA, RE market is almost four times larger than the OE market for passenger tyres. In the case of M/H tyre, although the tyre life is much shorter than the P/L tyre and the expected vehicle life is longer than a passenger car, the number of RE tyres sold is not as large as expected. This is due to better tyre maintenance and larger number of retreads, which represents 50% of the RE market.
Typically, a new tyre contains 45% rubber (natural and synthetic), 26% carbon black, 16% steel and 13% of other materials (RMA Citation2009a). The composition of material used in tyre is proportional to the size of the tyre. A used P/L tyre weighs on average 22.5 lb which is considered one passenger tire equivalent (PTE), whereas an M/H tyre is 120 lb or 5 PTE. During the useful life, a tyre loses 10% of its weight on the road (Ferrer Citation1997). This loss is mostly from the tread rubber, while the casing remains almost unaffected. As the tyre casing requires 80% of energy input from the production process (Ayers et al. Citation1997), it is essential to properly recover this important value.
When a tyre reaches its end-of-service life, it faces several options in the recovery process of its remaining value. The well recognised and best option available is retreading, but unfortunately not every tyre may be suitable for retread. When a tyre is scrapped, it can be recycled/used in other applications such as tyre-derived fuel (TDF), civil applications and other tyre-derived aggregate (TDA) products. A brief review of these uses is discussed in Section 3.1.
3.1 Tyre retread
Tyres are being retreaded for a long time. By reapplying the tread, the life of a tyre can be extended. The benefit of tyre remanufacturing is recognised for commercial vehicles as well as military and airline fleets. As mentioned earlier in the case of passenger cars, retread is still not popular due to two basic reasons: first, there is a general perception that remanufactured tyres are not as safe as new tyres; and second, the marginal price difference between low budget tyre and retreaded one pushes customers away from this market. Some of the basic facts about retreaded tyres are provided in the web site of the Tire Retread Information Bureau (TRIB Citation2010).
3.1.1 Retread facts
| • | Trucking companies in North America save about 3 billion dollars annually using tyre retreading. | ||||
| • | Retreads are also environmentally friendly. Production of new truck tyre requires approximately 22 gallons of oil. As most of this oil is found in the casing, which is reused in the retreading process, it therefore takes 7 gallons, approximately, of oil to produce a retread. | ||||
| • | Except steer axle of buses hauling passengers, retreaded tyres can be driven wherever new tyres can be driven. The restriction on steer axle of buses is imposed by the Federal Motor Carrier Safety Regulations under Title 49, Part 393.75, Paragraph (D). | ||||
| • | Passenger, light pickup and 4 × 4 retreaded tyres have the same quality standards established by the US Department of Transportation as any comparable new tyres. The quality of truck retreads is driven by market competition. The average life is 75–100% of new tyres. This depends on driving conditions and retread depth. | ||||
3.1.2 Environmental benefits
Retreading of tyre requires less energy and natural resources. Based on raw material and energy analysis by Ferrer (Citation1997), the tread contains about 40% of the total rubber and carbon black present in tyre. Thus, by reusing the tyre casing, up to 60% of rubber utilisation may be saved. As the major raw material for the production of synthetic rubber is crude oil, this can lead to significant amount of reduction in oil consumption. In terms of energy and according to Boustani et al. (Citation2010), the manufacturing of a new tyre requires 1036 MJ, whereas a retread only takes 352 MJ of energy, which translates to a saving of about 68%. Similarly, based on a research conducted in the ‘Centre for Remanufacturing and Reuse’ by Best Foot Forward (Citation2008) on carbon footprint of a retreaded tyre process, it shows that it has 30% less CO2 emission (60.5 kg CO2 emission instead of 86.9 kg CO2 for 17.5 in. tyres). Furthermore, the steel required in steel-belted tyres and bead of tyres are also conserved. Scrap tyres are widely used as fuel in place of coal due to their higher thermal value, 16.8 MJ/kg of tyre rubber compared with 14.77 MJ/kg of coal. This contributes in reducing greenhouse gas emissions. Retreading can extend the life of tyres and save natural resources such as crude oil and rubber. As tyres can get a finite number of retreads, the casings will eventually go to scrap from where they can still be used for incineration purposes as TDF or in other recycling methods.
3.1.3 Retread process
There are two main methods of retreading: pre-cure process, used by 80% of retreading plants, and mould cure process. When a used tyre arrives, the casing is inspected for damages either visually or with special instrument such as shearography, and tyres with excessive damage to wall or tread are rejected. After an initial inspection, the worn tread is removed from casing by buffing process. The ground rubber generated during the buffing process (almost 10% of total tyre weight) is sold for use in other rubber industries.
In mould cure method, the uncured tread rubber is applied to casing and placed in a full-circle mould which has the tread design on its inside wall. The tyre is inflated in the mould and the complete tread is cured. In the case of pre-cured process, the tread is already moulded, cured and applied only to the outer surface of the tyre with the help of cushion gum.
Once the tyre is cured, a visual inspection is made to check for proper installation of tread and shape deformation. If the tyre passes the inspection successfully, finishing operations such as trimming of excess rubber and labelling are performed.
3.2 Scrap tyre
Tyres that are no longer in service are considered scrap tyres. In the production of a tyre, as indicated earlier, most of the cost and energy are spent in making its casing. Therefore, different methods are used to recover this value from the scrapped tyre. Furthermore, governments have imposed strict laws against stockpiling of scrap tyres in large quantity as it poses serious threat to the environment. As a result, in 2007, 4.595 million tons of scrap tyres were generated in the USA, out of which 4.105 million tons were utilised in different applications (RMA Citation2009b). Figure shows the distribution of scrap tyres among different markets.
Figure 2 2007 Scrap tyre market (RMA Citation2009b).
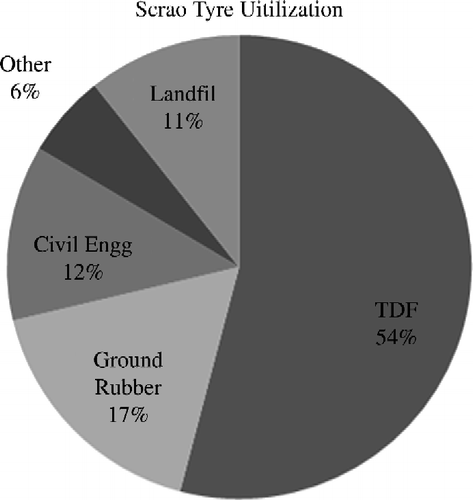
The largest consumption of scrap tyre is used as fuel. Many industries especially pulp and paper industry and cement industry use scrap tyres in large quantity. Tyre can be used either as a whole or in shredded form depending on the type of combustion chamber. The ground rubber is produced either by processing scrap tyre or as a by-product from tyre retread, which satisfies almost 50% of market demand. Ground rubber is used in moulded/extruded products, sports surfacing, playgrounds, automotive parts and rubber-modified asphalt (rubber asphalt concrete). Tyres in shredded form commonly known as TDA have uses in civil projects such as lightweight fill, drainage layers for landfills and land reclamation. Scrap tyres are also used by cutting, punching or stamping products from tyre carcasses.
The following section describes the methodology used to study the effects of remanufacturing tyres on tyre industry. Previously, authors have used quantitative models to evaluate the economical outcome of retreading with respect to current market only. Therefore, to understand the environmental benefits of increasing the demand of retread as well as changes expected in role and responsibilities of each stakeholder, a simulation model is developed to show interactions and decisions taken and to capture this type of challenging and sustainable industry. The results obtained with the help of this model are presented in Section 5, which shows the effects of higher rate of retread on
| • | RE tyre market share, | ||||
| • | environmental benefits (natural resources and solid waste), | ||||
| • | economy of retread (revenue and production cost) and | ||||
| • | reverse logistics issues (reintegration potential, collection and transportation). | ||||
4. Methodology: simulation model
In any reverse logistics operations, there are number of key players such as OEM, customer/user, collector, transporter, gatekeeper, dismantler, remanufacturer and recycler. Using agent-based modelling and simulation (ABMS), each of these players can be seen as agents and modelled separately. The agents can interact with each other while carrying out their respective operations. Therefore, with the help of ABMS, the overall performance of the industry and the effects of decisions made by individual agents on one another can be studied in detail. Another advantage of ABMS is that it provides modelling flexibility within each agent. Agents can be modelled as a simple representation of a particular player or it can be further developed into a complex decision-making tool. For example, an agent representing a collection centre may be a single agent who collects data on quantity, quality and the type of parts received and sends the part downstream on the basis of a simple rule. On the other hand, the same agent can be replicated and placed strategically at various geographical positions, thus creating a collection network. The duties of an agent can also include factors such as inventory level, return rate forecast, rebate policies and so on.
To represent tyre manufacturing/remanufacturing industry in terms of agent-based simulation, the overview of industry as shown in Figure is divided into four agents, namely TYRE, COLLECTOR, RETREADER and RECYCLER. The simulation takes OE tyre demand for both P/L truck and M/H truck tyres as an input and based on RE tyre criteria and other factors such as tyre life, tyre condition and decisions from various agents, it determines the market of RE tyres and retread tyres. The TYRE agent called TYRE is considered the central agent, which represents the physical unit of a tyre that undergoes different states through the life cycle. Briefly, new replicated TYRE agents are generated based on the OE and RE demands. After the EOL, they go to collection centre represented by collection agent or COLLECTOR. Based on the decision of the collection agent, tyres are either sent to recycling agent (RECYCLER) or to retreading agent (RETREADER). If recycled, the TYRE agents are removed from the system and a demand for new tyres is filled by NRE tyre ‘TYRE’ agents (replicated agent). When successfully retreaded, the tyres are sold in secondary market as retread tyres. After the second EOL, tyres again reach collection agent and face the previous set of decisions from other agents.
In the case of retreaded tyre, the customer decision of purchasing is largely based on price and quality perception of retreaded tyre, which can be represented as retread acceptance level (A) on a scale of 0–1. Therefore, instead of developing separate customer agents, customer preference is incorporated in the collection agent where it decides what fraction of returned tyres shall go to retreading facility. Another important point in the model is that tyre manufacturers are not defined as a separate agent. This is based on the assumption that manufacturers do not attempt to influence the decision of retreading to increase sales of new OE/RE tyres. The responsibility for creating new TYRE agents, based on the demand generated as the outcome of other agent's decisions, the responsibility for creating new TYRE agents is incorporated in the simulation model. It also coordinates communications among all agents and records the output of the simulation model.
4.1 Tyre
Two types of tyres are considered throughout the simulation modelling: P/L truck tyres and M/H truck tyres. Furthermore, tyres in each category are divided into OE tyres, which are installed in new vehicles, and RE tyres, thus creating four subagents of TYRE which is shown in Table .
Table 1 TYRE agent categories.
The TYRE agent determines the life cycle of tyres in terms of states. The states may be considered the presence of a tyre at a particular location in the industry such as OE market, collection centre, retreading plant, recycling plant and RE market. The tyre remains at its current state until a transition condition becomes true. For the purpose of description of the TYRE agent, the states or the rounded rectangles are labelled with alphabets (a)–(h), and decision steps or diamonds are labelled with numbers, as shown in Figure .
Figure 3 TYRE agent.
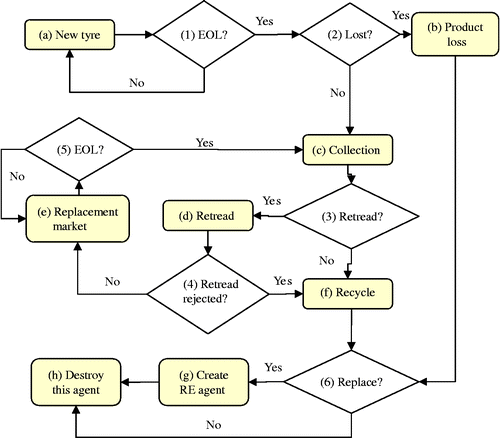
In reference to Figure , the description of each state and the conditions of transition between different states are as follows:
| 1. | When a new TYRE agent is created, it starts its life in state (a) as ‘New Tyre’. | ||||
| 2. | When the tyre reaches the end of its useful life (EOL), continuously monitored by condition (1), it leaves ‘New Tyre’ state. | ||||
| 3. | Decision box (2) determines the small possibility of not returning the tyre. This accounts for tyre's roadside dumping, which has the probability of 0.1 of all used tyres. If the tyre is considered lost from the system, it enters state (b) ‘Product Lost’ from where the agent is forwarded to decision box (6). | ||||
| 4. | If the tyre is not lost, it reaches state (c) or Collection. TYRE agent sends data related to tyre's conditions to the collection agent (COLLECTOR), which decides whether to retread the tyre or recycle it. Decision box (3) checks the result from COLLECTOR agent and sets TYRE agent to states (d) ‘Retread’ or (f) ‘Recycle’. | ||||
| 5. | When the tyre is selected for retread (state (d), ‘Retread’), related data are sent to RETREADER agent, which returns the decision of either, rejecting the tyre (4) and sending it to state (f) Recycle, or selling it to state (e) RE market after retreading. | ||||
| 6. | Again after EOL (5), which is 75–90% of a tyre's original life (TRIB Citation2010), the tyre is sent to state (c) or collection where it again faces the same set of decisions. Tyre casings can be retreaded a finite number of times, that is once for P/L tyre and twice for M/H tyres. | ||||
| 7. | When TYRE reaches recycle state (f) either through (3) or (4), RECYCLER agent is contacted and decides the method of recycling. | ||||
| 8. | The TYRE agent instantly leaves the ‘Recycle’ state and enters decision (6). At this stage, decision (6) determines the number of times an OE tyre is already replaced by a NRE tyre or retreaded tyre which is set to four on an average, as a vehicle before its EOL generally uses four and five sets of tyres. This method of replacement is responsible for generating the demand for RE. | ||||
| 9. | Based on the above decision, the TYRE agent is either sent to state (g) ‘Create NRE tyre’ to create a NRE TYRE agent as replacement and then removed from the system by sending it to (h) ‘Destroy this Agent’, or it is removed instantly by skipping state (g) and going directly to state (i). | ||||
| 10. | When a NRE TYRE agent is generated by state (g), it carries the information about previous number of replacements already made. | ||||
4.2 Collector
The COLLECTOR agent is contacted every time the TYRE agent reaches state (c) ‘Collection’ point 4 of Section 4.1. Figure along with the explanations gives a detailed description of the decisions and steps considered in collection.
| 1. | The agent receives the information about tyre type and checks if it is a P/L or M/H tyre.
Figure 4 COLLECTOR agent. 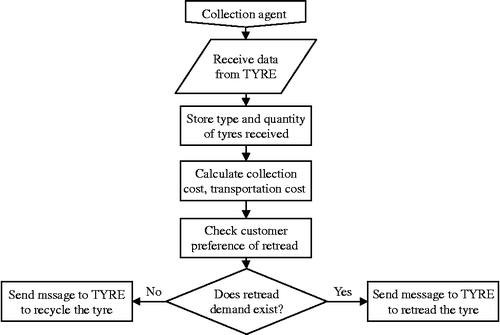 | ||||
| 2. | For both types, it separately records the number of tyres received and the corresponding cost of collection and transportation. | ||||
| 3. | The agent then decides whether to send the tyre for retread or recycle based on the level of acceptance (A) of retreaded tyre by the customer. This level of acceptance, A, is a key parameter that defines the likeliness of any individual to buy a retreaded tyre instead of NRE tyre. | ||||
| 4. | After completing the process, the agent sends its decision back to the TYRE state (c). | ||||
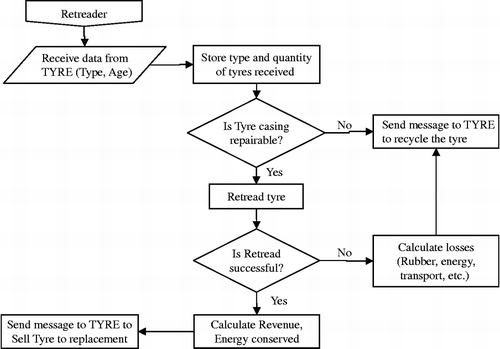
4.3 Retreader
This agent is called when TYRE reaches state (d) ‘Retread’, which is shown in Figure . It receives the type and age information from TYRE agent. After recording the type and number of tyres received, it performs the three major steps of retreading process:
Initial inspection. To check whether the casing is suitable for the retreading process, the inspection criteria are adopted from Lebreton and Tuma (Citation2007). They used the following functions to predict the reintegration of tyre casings:
Retread. To determine the retreading cost, the amount of ground rubber produced and the oil consumed in the retread process are considered.
Final inspection. If the tyre is rejected at final inspection, the cost incurred as well as the quantity of oil consumed is considered waste and the tyre is sent to Recycler.
When retread process is successfully completed, the agent sends a message to TYRE agent (state (d) in TYRE agent) to sell the tyre in RE Market. Figure illustrates these steps.
Figure 5 RETREADER agent.
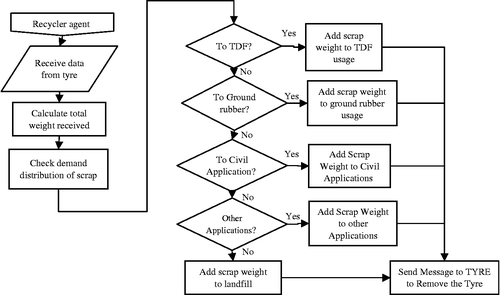
4.4 Recycler
The RECYCLER agent receives the tyre when TYRE agent reaches state (f) ‘Recycle’ either directly from state (c) ‘Collection’ or after rejection from state (d) ‘Retread’ (Figure ). First, it converts the tyre received to weight (P/L tyre weighs 10 kg, whereas M/H is 50 kg) as scrap tyres are used in terms of weight rather than in units. The weight received is then distributed to different recycling markets according to demand distribution based on Table . Finally, a message is sent to TYRE agent to remove the tyre from the system. These steps or decisions are presented in Figure .
Figure 6 RECYCLER agent.
4.5 Model validation and parameter settings
The simulation model represents tyre industry worldwide as there is no significant difference in the manufacturing process from one manufacturer to another. However, to validate the model, data related to market demand and prices are taken from the USA tyre market. The data are collected from two main sources: MTD for tyre shipments and Rubber Manufacturers Association (RMA) for scrap market.
MTD gathers statistics about major tyre manufacturers in North America and provides total quantity of tyres shipped to OE and RE during the last 20 years (Table ). The figures presented are available for P/L and M/H tyres in millions units shipped. As P/L truck tyres share the same market segment and the use pattern is also similar, therefore for simulation purposes, the number of units for P/L truck tyres is added to attain combined shipment quantities. Due to global economical crisis, there is a sudden drop in shipments for the last 2 years. To represent the actual market conditions, shipment quantities till the year 2009 are considered.
Table 2 Tyre shipments in million units.
Table shows median prices for common category of tyres in passenger and commercial tyre markets. The price for a major brand tyre is 10–15% above the median price, whereas the price of low cost radials is 10–15% less than the median price. Some low-end tyres such as P175/70R13 are even cheaper at $47.44. Detailed price structure of passenger tyre retread is not available as statistics are compiled for truck tyres only. Table provides retread and casing price for commonly used truck tyres. Information regarding the total number of tyres retreaded (NRet) in different categories is rarely available as currently no organisation is collecting these data. In one of the paper reviewed (Bender Citation2007), we found the quantity of passenger and truck tyres retreaded during 2004 with reference to RMA publication Tire Industry Fact book. Table shows these figures along with the proportion of RE market currently captured by retreaded tyres.
Table 3 New tyre price in US dollar.
Table 4 Truck tyres retread prices in US dollar.
Table 5 Quantity of retreads and replacement.
The data on scrap generation and utilisation are taken from reports on scrap tyres published by RMA through the years 1990–2007. The data available for 1990–2005 provides quantities of tyres scrapped and their usage in various scrap markets in terms of million units (Figure ). Since 2007, RMA has started collecting the data in terms of weight instead of number of units (Table ). Due to this change in the method of collection, it is not possible to express 1990–2005 scrap utilisation in terms of weight or vice versa. To relate the two sets of data, Figure shows the percentage of utilisation in various applications for years 1990–2007. The percentage consumption for 2007 is used in simulation to generate empirical distribution for allocating scrap tyres among the applications.
Figure 7 Scrap tyres utilisation from 1990 through 2005 (RMA Citation2009b).
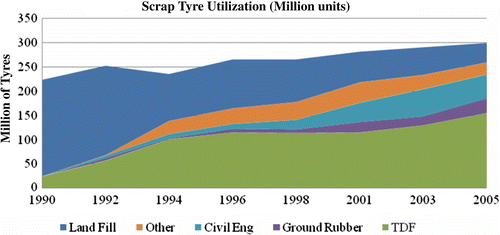
Table 6 Scrap market 2007.
Figure 8 Scrap tyre utilisations (in percentage from 1990 through 2007).
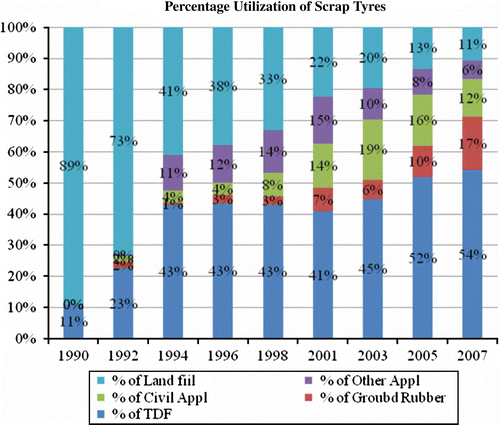
Table gives the summary of other parameters used in the model. It is difficult to express the life of tyres in terms of years/months as it highly depends on road conditions, driving habits, tyre inflation and average yearly mileage. Therefore, the above estimate (see first row in Table ) is based on a warranty provided by tyre manufacturers, i.e. 40,000 miles or approximately 64,000 km and average mileage of vehicles, which is about 11,786 miles per year (US Highway Stats). Another assumption in row 3 of Table is regarding the number of retreads a particular tyre may get in life. It is set to one retread for P/L tyres as currently retreads are less popular among consumers and also due to poor maintenance of tyre throughout the life, it is less likely that casing remains in good condition for a second retread.
Table 7 Summary of other parameters used in the simulation model.
As mentioned earlier, the simulation model is designed to take OE tyre demands for P/L and M/H tyres as input; and based on replacement conditions and other parameters defined in Table , it generates the demand of RE. Goodness-of-fit tests have been conducted on OE shipments for both P/L and M/H tyres for years 1989–2009 to determine the respective input distributions. The initial level of retread acceptance (A) is set with the help of Table . The model is then run for a total of 125 time periods (1 period = 1 year). Using Welch graphical method for transient removal (Law Citation2007), the first 25 periods are considered the warm-up period. The model is replicated five times. The data gathered after each experiment run include quantities of RE and retreaded tyres sold in each period along with other performance measures, i.e. number of used tyres transported, tyres successfully retreaded or rejected by retread facility and distribution of scrap tyres among various markets.
5. Experiments
The simulation model is designed to assess changes in tyre industry with respect to the environment and economical factors by the increase in the utilisation of retread tyres, particularly for passenger cars. In order to analyse the sensitivity of the factors considered and their effects, a number of experiments are conducted. First, the acceptance level of retread tyre is incremented gradually. As the acceptance level is mainly responsible for generating the demand of retread tyres, it is possible to observe how the industry reacts to higher demands. Second, an experiment is carried out by changing the rejection rate of used tyre, which actually represents the limits to the supply of retreaded tyres. Finally, another experiment is carried out by increasing the demand of OE tyres to reflect the global industry. The following sections discuss the results obtained from these experiments in detail.
5.1 Retread acceptance level
For this purpose, an experiment is conducted by creating scenarios by varying the level of retread acceptance, A. Starting with the current retread proportion of 0.002 for P/L truck tyres as observed in Table , then, the level is increased in increments of 0.1. Following this level, a 0.1 increment is considered up to level 1.0, which represents the ideal case in which all used tyres are considered for retreading. The retread level of M/H truck tyre is kept constant at 0.9.
Table shows the summary of these experiments in millions of units sold for different categories of tyre in both OE and RE markets. The acceptance level, A, of P/L tyre retread is increased and a different market share is observed at each level. As P/L tyres and M/H tyres are addressed separately throughout the simulation, the changes in acceptance of P/L tyres do not affect the market of M/H tyres; therefore, the results and analysis are focused only on P/L truck tyres.
Table 8 Number of P/L sold for all acceptance levels of retread (million units).
5.1.1 RE tyre market share
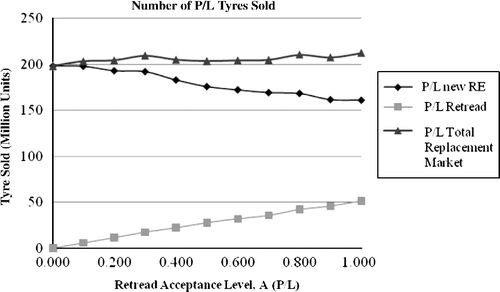
Figure shows that the total number of P/L tyres sold in RE market increases slightly with higher level of retread (197–212 million), which is due to the shorter life cycle of retreaded tyres. In the case when every tyre is diverted for possible remanufacturing, the retreaded tyre captures up to 24% of the total units of RE tyres sold. This is due to the limitation in the fraction of tyres rejected in the process. Thus, the percentage can be increased further by improving the durability/life of tyre casings and reducing the rejection rate. This issue of rejection is addressed in more detail in Section 5.2.
Figure 9 Number of P/L tyres sold under various degrees of retread acceptance levels.
5.1.2 Environmental benefits
5.1.2.1 Natural resources
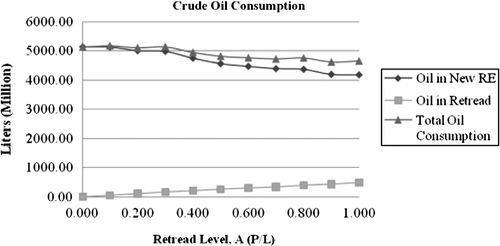
Reduction in oil consumption. The reduction in the consumption of crude oil is perhaps the most important environmental benefit of increasing the NRet. The estimated amount of oil that may be consumed by all degrees of retread is calculated as follows:
Figure 10 Oil consumption at various levels of P/L retreads.
Reduction in natural rubber consumption. A new passenger tyre contains about 41% of rubber (27% synthetic and 14% natural rubber) (RMA Citation2009a). The casing of tyre contains nearly 67.4% of this rubber. Therefore, the estimated amount of natural rubber in a new passenger tyre weighing 25 lb is 2.36 lb or 1.07 kg (25 × 0.14 × 0.674). With this calculation, it is suggested that by reducing the production of one casing by retread, 1 kg of natural rubber can be approximately conserved. Therefore, more than 50 million kg of natural rubber can be saved at 100% retread level.
5.1.2.2 Waste generation
Reduction in scrap tyre generated. The number of tyres scrapped per year may also decrease with higher level of retreads because the casing is reused. According to the simulation results, the volume of scrap P/L tyres can be reduced by 57.2 million (Figure ), which translates to approximately 572,000 tons of scrap in terms of weight as a single P/L tyre is usually approximately 10 kg of scrap.
Figure 11 Number of scrapped tyres (million units).
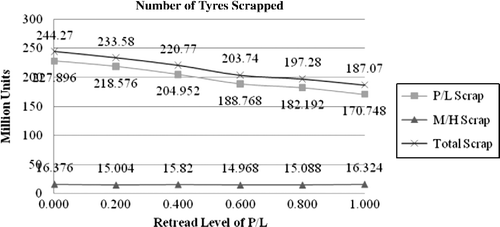
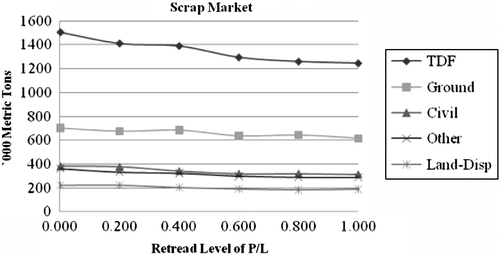
Figure shows the distribution of the scrap generated among various scrap tyre markets with the help of the RECYCLER agent. It suggests that an increase in the number of P/L tyre retreads will have the greatest effect on the TDF market. According to Ferrer (Citation1997), TDF produces 33 MJ/kg when burned as compared with 27 MJ/kg from coal. Thus, each ton of scrap rubber replaces 1.22 tons of coal. With retread at A = 0.9, the reduction in TDF is almost 259,360 tons, which corresponds to 316,000 tons of coal. A portion of this demand, about 189,000 tons of scrap tyres, can be covered by diverting scrap from landfill to TDF applications.
Figure 12 Distribution of scrap tyre to various scrap markets (P/L and M/H).
Reduction in CO2 emission. As per Best Foot Forward (Citation2008) in relation to the comparison of carbon footprint for new and retreaded tyre, it is mentioned that by retreading a 17.5 in. tyre once, CO2 emission can be reduced from 87.2 to 60.7 kg. Considering the same proportion, retreading once a passenger tyre (a 14 in. tyre) may reduce 15 kg of CO2. This translates to a reduction of almost 551 million kilograms of CO2 at retread level, A = 0.5.
5.1.3 Economy of retread
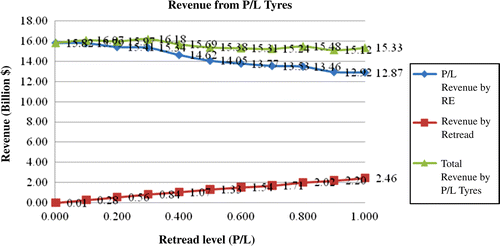
The retail price of retreaded tyres is generally 30–50% less than a new tyre (CitationGreen California). Therefore, considering $80 as an average price of a new tyre, the price of retreaded tyres shall be almost $48 (0.6 × $80). On the one hand, with these prices the retreaded tyres will generate a revenue of over 2.46 billion dollars; on the other hand, tyre manufacturers will observe a total reduction of almost 0.5 billion dollars in revenue due to low volume of NRE (Figure ).
Figure 13 Revenue generated from the sales of new and retreaded P/L tyres.
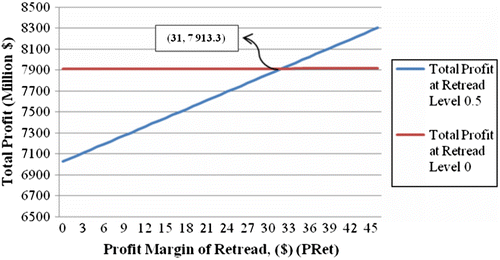
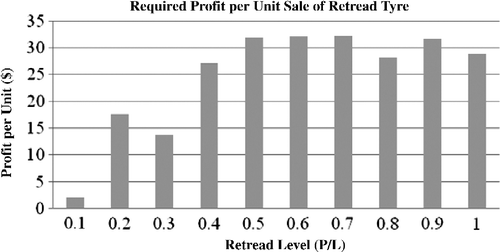
With the knowledge of profit/unit of new replacement tyre (PRE), the number of NRE and the NRet, the minimum profit required by unit retread (PRet) to break-even can be calculated by
Figure 14 Profit required per unit sale of retreaded P/L tyre to achieve break-even at retread level of 0.5.
Equating Equations (Equation3) and (Equation4
) and rearranging, we obtain the PRet as follows:
Figure 15 Profit required per unit sale of retreaded P/L tyre to achieve break-even (all retread levels).
5.1.4 Reverse logistics issues
5.1.4.1 Collection
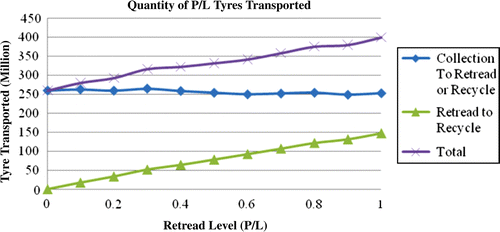
The average number of tyres collected annually does not change much at various levels of retreads. The reason may be that the total volume of tyres sold remains almost the same at all levels of retread. On the other hand, the total transportation cost will increase owing to the fact that extra trips are required from retread facility to recycle plant for the rejected tyres (Figure ).
Figure 16 Number of P/L tyres transported.
5.1.4.2 Retread facility
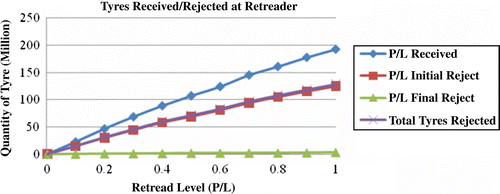
At the retread facility, the key information recorded by the simulation model are the number of tyres received, rejected at initial or final inspection and that retreaded successfully. Table shows a sample of data collected for 20 periods at acceptance level of 0.5. For complete experiment runs at all levels of retread, the initial rejection rate observed is almost 60%, as shown in Figure , this results in very high transportation and labour costs. These costs can be reduced to some extent if proper guidelines are provided at the collection centre to filter out any unnecessary transportation to the retread facility. As mentioned earlier, the rejection rate can be decreased by improvements in durability of the casing, proper tyre care such as regular inflation and pressure checks.
Table 9 Sample of data collected from RETREADER agent at  (in millions).
Figure 17 Average number of tyres received and rejected at initial and final inspections.
5.2 Rejection rate
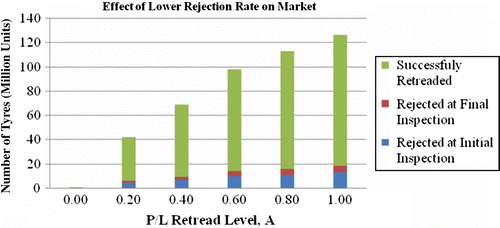
The above-mentioned initial inspection criteria are based on Equations (1) and (2) proposed by Lebreton and Tuma (Citation2007). On the other hand, the rejection rate at initial inspection as proposed by Ferrer (Citation1997) is 0.10. Using this rate, Figures and demonstrate this change in terms of RE market and retread facility, respectively. Although the increase in the number of retreaded tyres shown by Retread (low) in Figure is much more appealing, the previous rate is supported by the realistic usage pattern of passenger car tyres.
Figure 18 Effect of lowering initial rejection rate on RE.
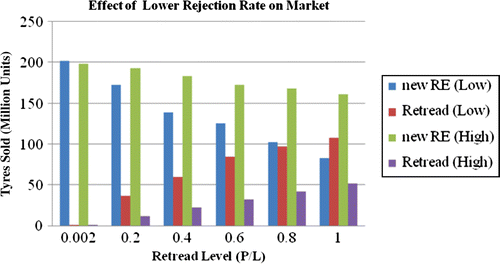
Figure 19 Effect of lowering initial rejection rate on retread facility.
5.3 Global vehicle market
Although global car production shrank greatly due to the recent economical crisis, some Asian countries such as India and China witnessed a rise in vehicle sales. By the end of 2009, sales in China reached more than 10 million cars, which is an increase of over 45% on a year-to-year basis. With the enormous increase in car sales, the demand for tyres also peaked, making China a world's leader in rubber tyre production as well as in consumption. According to the global new vehicle registration data provided by R.L. Polk & Co. (Citation2010) (Table ), about 40% of new cars are sold in Asian countries which may also increase in the coming years. Aggressive campaigns from both governments and private businesses are required to promote retreaded tyres and reduce the consumption of natural recourses wherever possible. Moreover, introducing retread for passenger tyres shall be much more feasible in these countries due to lesser labour cost.
Table 10 New registrations of passenger vehicles (in millions).
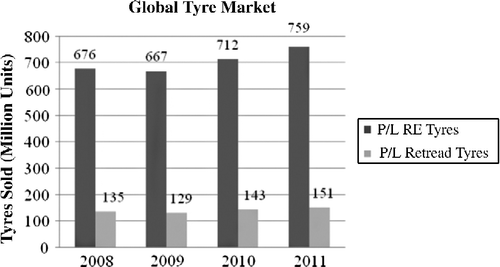
Figure shows the simulated results of globally increasing retread level to 0.5. The yearly input demand for OE is taken from the world sales data in Table , e.g. in 2008 the total passenger cars sold were 56.879 millions. Therefore, it generates a demand of at least (56.879 × 4) 227.516 million OE tyres. Similarly, with expected sale of 63.63 million passenger vehicles in 2011, the OE demand shall be 253.324 million tyres. From Figure , in 2011, if global retread level of passenger tyres is raised to A = 0.5, 151 million tyres can be retreaded, thus reducing the production of new tyres and also the consumption of crude oil by about 2.5 billion litres.
Figure 20 Simulation results for global RE tyre market at 0.5 retread level.
6. Conclusions
This paper addressed the current status of tyre manufacturing and proposed sustainable views to better make use of scrapped tyres through the implementation of tyre remanufacturing or tyre retread. An agent-based simulation model is presented to study the impact of increasing the number of passenger tyres retreaded. Here the modelling approach considered tyre, the product of interest, as a central agent instead of customer. The model represents in a comprehensive manner, the entire tyre industry and the functions of key players involved in tyres' remanufacturing. The model considered many relevant agents such as TYRE, COLLECTOR, RETREADER and RECYCLER. The interactions among the various agents were addressed by taking into consideration the decision-making process at each agent's level of responsibility. The results obtained from the simulation model show that by increasing the level of acceptance of retreading P/L truck vehicle tyres, about 24% of RE market can be satisfied by retreading. As a consequence of tyre retread, the results also show a significant decrease in raw material consumption and in scrap rate.
As retreaded tyres replace NRE, therefore, a decrease in annual revenue of tyre manufacturers is observed. Hence, with limited demand, the remanufacturing of passenger tyres is economically challenging. This is also supported by current market status and the results obtained by other authors. On the other hand, the substantial environmental benefits in terms of natural resources conservation and waste reduction are evident from high degree of retreads. An economical analysis is conducted to show the profit break-even point for any level of tyre retread.
Auto industry plays a very important role in the world economy. Therefore, during the recent crisis, governments all over the world have provided auto manufacturers stimulus packages in some forms to boost the sales. In China, the subsidised price on smaller passenger cars has almost doubled the sales in the last 2 years and created a new market leader in auto industry. With global economy improving and new markets emerging in this industry, the annual demand of cars and thus tyres will climb higher and, in turn, prompts a rapid consumption of natural resources.
Government policies in North America and Europe aim at diverting tyres from landfills to recycling. Some governments have introduced policies that include a minor recycling fee at the time of purchasing new tyres. These fees can then be used as incentives to promote recycling and to develop new methods to address scrap tyre issues. Unfortunately, enough focus is not given onto retreading tyre. As mentioned earlier, the greatest hurdle in tyre remanufacturing is a poor customer perception and a low-profit margin. Governments shall also take some motivating steps to educate consumers about environmental benefits of retreading tyres and to develop better standards for passenger tyre retreads to gain their confidence in the terms of quality.
The agent-based approach presented in this paper may be used as a basis for developing more complex models of reverse logistics and remanufacturing environment. The simulation model used here can be extended to include details such as capacity constraints at manufacturing sites or collection centres, production lead time as well as distribution network.
Acknowledgements
The authors are very thankful to the Editors Professor Rahimifard and Dr Clegg for their help and attention during the evaluation process of the paper. The authors acknowledge the constructive comments made on the paper by three anonymous referees. They also acknowledge the Natural Sciences and Engineering Research Council of Canada (NSERC) for the financial support during the tenure of this project.
Related Research Data
References
- Ammons , J.C. 1999 . Carpet recycling: determining the reverse production system design . The Journal of Polymer–Plastics Technology and Engineering , 38 ( 3 ) : 547 – 567 .
- Ayers , R. , Ferrer , G. and Van Leynseele , T. 1997 . Eco-efficiency, asset recovery and remanufacturing . European Management Journal , 15 ( 5 ) : 557 – 574 .
- Barros , A.I. , Dekker , R. and Scholten , V. 1998 . A two-level network for recycling sand: a case study . European Journal of Operational Research , 110 : 199 – 214 .
- Bender, D.L., 2007. Tire retreading – the rationale and review of technologies. Rubber World Magazine, September 2007. Available from: www.rubberworld.com
- Best Foot Forward, 2008. Carbon Footprints of Tyre Production – New v Remanufactured. Prepared for Center of Remanufacturing and Reuse
- Beullens , P. 2004 . Reverse logistics in effective recovery of products from waste materials . Reviews in Environmental Science and BioTechnology , 3 : 283 – 306 .
- Biehl , M. , Prater , E. and Realff , M.J. 2007 . Assessing performance and uncertainty in developing carpet reverse logistics systems . Computers and Operations Research , 34 ( 2 ) : 443 – 463 .
- Boustani , A. 2010 . Tire Remanufacturing and Energy Savings, Environmentally Benign Manufacturing Library, Sloan School of Management . MITEI-1-h-2010, January 28, 2010
- California Integrated Waste Management Board (CIWMB), 2003. Consumers' tire-buying habits and their knowledge of tire maintenance, recycling, and disposal. November. Publication # 622-03-004
- Ferrer , G. 1997 . The economics of tire remanufacturing . Resources Conservation and Recycling , 19 : 221 – 255 .
- Ferrer , G. and Ayres , R.U. 2000 . The impact of remanufacturing in the economy . Ecological Economics , 32 : 413 – 429 .
- Ferrer , G. and Swaminathan , J.M. 2006 . Managing new and remanufactured products . Managment Sciences , 52 ( 1 ) : 15 – 26 .
- Fleischmann, M., 2001. Reverse logistics network structures and design. ERIM Report Series, ERS-2001-52-LIS
- Green California, Vehicle Transportation, Best practices manual – retread tires. Available from: http://www.green.ca.gov/EPP/vehicles/RetreadedTires.htm [Accessed 28 July 2010]
- Law , A.M. 2007 . Simulation modeling and analysis , 4th ed , 509 – 510 . New York : McGraw Hill .
- Lebreton , B. and Tuma , A. 2007 . A quantitative approach to assessing the profitability of car and truck tire remanufacturing . International Journal Production Economics , 104 : 639 – 652 .
- Louwers , D. 1999 . A facility location allocation model for reusing carpet materials . Computers & Industrial Engineering , 36 ( 4 ) : 855 – 869 .
- Modern tire dealer (MTD), 2010. Research and Stats. Available from: http://www.moderntiredealer.com/Stats/ [Accessed 25 June 2010]
- OICA, 2009. Production Statistics 2008-2009. International organization of motor vehicle manufacturers. Available from: http://www.oica.net/category/production-statistics/ [Accessed 28 July 2010]
- R.L. Polk & Co, 2010. Global Passenger Vehicle Market – Monthly Forecast, Global Forecasting Dashboard. Available from: http://www.polk.com/forecast/ [Accessed 29 July 2010]
- Rubber Manufacturers Association (RMA), 2009a. Scrap tire characteristics. Available from: http://www.rma.org/scrap_ tires/scrap_tire_markets/scrap_tire_characteristics/ [Accessed 25 June 2010]
- Rubber Manufacturers Association (RMA), 2009b. Scrap tire markets in the United States. 9th Biennial Report, May 2009. Available from: http://www.rma.org/scrap_tires/ [Accessed 25 June 2010]
- The R.L. Polk Co. (Polk), 2009. US Vehicle Median Age Increased in 2008, According To Polk. Available from: http://usa.polk.com/News/LatestNews/ [Accessed 29 July 2009]
- Tire Retread and Repair Information Bureau, 2010. Retread Facts. Available from: http://www.retread.org/Facts/ [Accessed 25 June 2010]