Abstract
Two types of sign substrate material used for road signs and road safety markers, one constructed of reclaimed e-waste plastic and the other of the most commonly used aluminium, are compared in the context of life cycle assessment methodology. This paper also compares the different types of tools available, and determines a suitable tool for use in calculating the carbon footprint (CF) of the two types of sign substrate material. An estimate for the CF of each type of sign substrate material is calculated as the carbon dioxide equivalent. After calculating the CF of each type of sign substrate, a sensitivity analysis is conducted. The ultimate aim of the analysis was to indicate which parameters of the substrate manufacturing system have the strongest influence on the CF results in order to find ways for lowering the environmental impact such as climate change potential. The main finding of this study is that blank signs constructed of reclaimed e-waste plastic materials are more attractive in climate change potential than those made of aluminium. Also, this paper documents a quantity assessment method for the climate change potential of using sign substrate material constructed of reclaimed e-waste plastic in roadside applications instead of conventional aluminium.
1. Introduction
Highway signs are essential in communicating information to drivers. The sign blank, or sign substrate, is the structural element on which the information is presented. Most sign blanks are made from aluminium materials, similar to those shown in Figure , and are currently in use throughout the USA. However, costs of sign blanks that are made of aluminium are increasing significantly, and aluminium signs are often prone to theft for the economic value in the reclaimed metals market. Additionally, production and disposal of these materials are contributing to environmental problems such as emission of pollutants, energy and resource depletion and so on (Roschke and Harrison Citation2000).
Figure 1 Aluminium sign substrate used in the USA.

Substitute materials for sign substrate such as plywood and various recycled plastic materials are often studied and are sometimes used by US state departments of transportation. The physical and mechanical properties of these materials are tested to certify that they have similar properties like aluminium (Roschke and Harrison Citation2000). However, the environmental impact of those materials is seldom mentioned. ‘Carbon footprint (CF)’ is fairly a new term used to quantitatively describe climate change and other environmental problems. Calculating CF has garnered increased interest from public institutions, businesses and consumers. It is also considered an effective method to assess the climate change potential of an enterprise or product. There are many CF tools available for use, but not all of these tools are reliable, and those that are reliable, may involve costly assessment processes. This paper compares the different types of tools available and determines a suitable tool to calculate the CF of sign substrate materials. Based on the calculation results, effective measures can be obtained to reduce the CF. This provides a tool to support the environmental policy of the manufacturing company.
2. Carbon footprint
‘CF’ evolved from the ecological footprint developed by Wackernagel and Rees (Citation1996). This concept and calculation takes into account many environmental elements such as land, resource use, global warming and so on. The expression ‘CF’ was used in the media as early as 2001, but it was not used in scientific literature until 2005 (Moss et al. Citation2008). The popular definition of ‘CF’ as a measure of the total amount of carbon dioxide emissions that are directly and indirectly caused by an activity or are accumulated over the life stages of a product was first posited by T. Wiedmann and J. Minx in 2007 (Wiedmnn and Minx Citation2008).
Based on this definition, many CF calculation methods were developed by the industry, the standards organisations and the scientific community. These include tools such as The Public Access Specification (PAS) 2050 (BSI Citation2008), Greenhouse Gas Protocol (GHG) Corporate Standard, ISO 14067 (Carbon Footprint of Products; Anon Citation2010), Project Carbon Footprint (PCF), Environmental Input–Output (EIO) Analysis (Wiedmann et al. Citation2006) and so on. These methods can be classified into two categories based on the analysis direction. One is the process sum life cycle assessment (LCA) based on the life cycle and process analyses such as PAS 2050. The other is the economic input–output (IO) LCA based on the EIO analysis. The process sum LCA method is suitable for understanding the environmental impacts of individual products from cradle to grave. However, the precision of the results depends on the data quality and reasonable system boundary definition. When the data for the product or process are difficult to accurately acquire, the economic IO LCA method can provide an effective complement.
With the improvement of the CF methodology, various tools were developed to support the CF calculation. For example, there are about 77 carbon calculators online (Andrews Citation2009), some of which are listed in Table . Analyses of these calculators indicate the following: 52 were used to calculate the CF of individuals and households; 12 were used to calculate the CF of industries; 10 were used to calculate the CF of companies and offices and three were used to calculate the CF of products such as GaBi, SimaPro and CleanMetrics. Most of the CF calculators are used to calculate the CF of individuals, households, industries and companies, which are considered from a rather macroscopic perspective and not adaptable for the CF calculation of a detailed product. GaBi 4 software results from more than 10 years of intensive activity in life cycle analysis (LCA)/life cycle engineering (LCE) research and collaborative industrial projects at Institut für Kunststoffprufuug (IKP) and PE international (PE) (Spatari et al. Citation2001). Its abundant database and convenient process model are effective for calculating the CF of a product based on the bottom-up method. Therefore, this paper will use the LCA method and GaBi tools to calculate the CF of sign substrate material made from recycled e-waste plastic.
Table 1 CF calculators.
3. Case study
The LCA methodology was used to define the CF of reclaimed materials composed of 75% secondary plastic (spent printer cartridges), and 25% primary plastic (plastic housings harvested from end-of-life computers and printers) noted as dirty recycled material (DRM), made by Image Microsystems (Austin, TX, USA). Spent printer cartridges and plastic housings of computers are most commonly made from acrylonitrile butadiene styrene (ABS). In addition, they may contain high impact polystyrene. However, printer cartridges also contain traces of ink as well as copper and gold (in the printed circuit board on the head), as well as foam that is used inside the cartridges to maintain constant ink levels. For printer cartridges, polymers must be separated from the foam and then can be used as the reclaimed material component, which is called ‘secondary’ plastic. The plastic housings of computers and the printers can be used directly because the component of plastic housings is almost the polymers, which is called ‘primary’ plastic.
LCA is a standardised scientific method for systematic analysis of flows (e.g. mass and energy) associated with the life cycle of a specific product, a technology, a service or manufacturing process systems. The approach in principle aims at a holistic and comprehensive analysis of the items including raw materials acquisition, manufacturing, use and final disposal. Therefore, CF analysis consists of four phases: (1) goal and scope (framework and objective of the CF), (2) life cycle inventory (LCI, IO analyses of mass and energy flow from operations along the products supply chain), (3) CF calculation and (4) interpretation (Curran Citation1996).
3.1 Goal definition and scope
The goal of this study is to identify the CF associated with the manufacture of recycled e-waste plastic sign substrate. Additionally, the environmental impact of producing e-waste plastic sign substrate will be compared to that of aluminium sign substrate. Thus, the main targets of our study are
| 1. | Calculation of the CF of creating sign substrate material made from recycled e-waste plastic during the various phases of the material's life cycle. | ||||
| 2. | Comparison of the environmental impact of the manufacture of sign substrate material made from e-waste plastic to that of aluminium substrate material – most commonly used for traffic and way-finding signage. | ||||
The impacts of the recycled plastics should begin when the electronic products are ready for recycling, and the flow diagram of the recycled plastic manufacturing process is shown in Figure . The main steps that would typically be included are (1) transport of electronic products to recycling centre; (2) physical disassembly, either manually or by shredding and subsequent sorting machines to sort the various plastic types; (3) mixing two different types of recycled material together, as necessary; (4) forming the mixed recycled material into the signage substrate; (5) transport to signage location. As the raw material of the plastic sign substrate is recycled from e-waste plastic and can then be recycled and reused at its end-of-life, the recycle phase will not be considered in this study. In addition, the accurate durability of the recycled material is not sure when it is used as sign substrate; so assumption is indicated that the recycled materials have the same durability with aluminium, which is about 10 years. The other assumptions for the study are as follows:
| 1. | Relationship to nature: focus of the study will be on the large quantity of traffic signs in use.
Figure 2 Manufacturing process flow diagram of recycled e-waste plastic material. 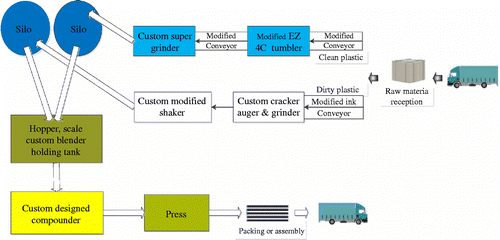 | ||||
| 2. | Geography: USA. | ||||
| 3. | Lifecycle phases: material extraction, manufacturing and transportation. | ||||
| 4. | Functional unit: the functional unit of the traffic signs = the area = 1 m2-year. | ||||
| 5. | Cut-off criteria: the recycle phase. | ||||
3.2 Inventory analysis
The inventory analysis, also known as LCI, consists of quantifying energy and raw material requirements, atmospheric emissions, waterborne emissions, solid wastes and other releases for the entire life cycle of the sign substrate. Following are the steps for performing the inventory analysis:
| 1. | Collect data. | ||||
| 2. | Create a computer model. | ||||
| 3. | Evaluate the environmental loads related to each option under investigation. | ||||
3.2.1 Data sources
At the outset of this study, the level of specificity must be decided. In some cases, the level will be obvious from the application or intended use of the information. In other instances, there may be several options to choose from, ranging from a completely generic study to one that is product-specific in every detail. Most studies fall somewhere in between. Thus, the data requirements are analysed as follows:
| 1. | The goal of this study is the comparison of recycled plastic sign substrate and aluminium sign substrate and their different manufacturing processes. The specific data should be identified from the manufacturing process for the quantified results. Thus, the manufacturing data should be collected in detail to meet the needs of this study. | ||||
| 2. | For other data, such as electricity generation and transportation, the database currently available within academia will be referenced. | ||||
Based on the above considerations, several data stores are selected for our data collection:
| 1. | Company documents: specific manufacturing process data. | ||||
| 2. | LCA database: statistical average data (transportation, energy generation, etc.). | ||||
According to the above data stores, the data collection results of the DRM and aluminium substrates are shown in Tables and .
Table 2 Data collection results of the DRM substrate.
Table 3 Data collection results of the aluminium substrate.
3.2.2 Modelling
Referencing the analysis and boundary shown above, the LCA model of recycled e-waste plastic and aluminium substrate can be built by using GaBi 4 software. The interface for modelling the systems within GaBi provides a visual map of system boundaries and all flows associated with the system. In addition, the flow and process can be modified for different requirements by the user.
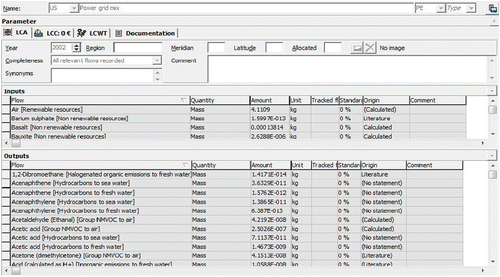
Based on the actual manufacturing process for recycled e-waste plastic provided by the manufacturing company, some basic processes are built by the software. Each basic process contains several IO flows that can either be found in the database or specifically defined. For example, in the process of ‘blending and compounding’, clean ABS plastic and electrical power are the inputs, the mixed DRM is the output. Also, the amount of each IO is based on the actual data, which is shown in Figure . Other system processes such as the power grid, transport and so on can be obtained from the GaBi database. Figure shows the process model of the power grid mix in the USA, using data obtained from the US Electric Power Annual (Citation2008).
Figure 3 IO of the blend process model.
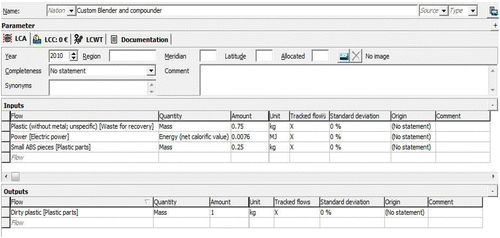
Figure 4 IO of the US power grid model.
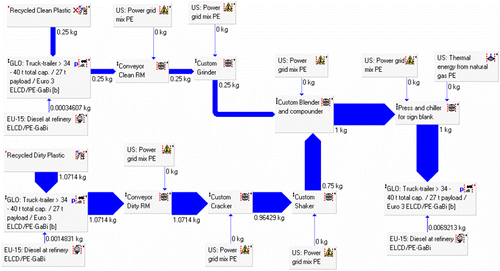
Based on the actual basic processes and the system processes, the LCA analysis of the recycled material is modelled by the flow diagram, which is shown in Figure . The blue arrow represents the substance flow direction and also the IO of the tracked flows. The width of the arrow and the number below it represent the quantity of the IO. The LCA analysis model of the aluminium substrate can also be achieved by the same method. The data for the aluminium substrate are obtained from the research conducted by the Mining Life-Cycle Center at the University of Nevada (Zyl Citation2006).
Figure 5 LCA model for the recycled material.
Results of the inventory analysis for each material option under evaluation are shown in Table .
Table 4 Inventory analysis results of the DRM and aluminium substrates.
3.3 CF calculation
Based on the LCI results, the CF calculation can be conducted by the following steps: (1) classification, i.e. assigning LCI results to the ‘kilogram carbon dioxide equivalent’ (kg eq.); (2) characterization, i.e. expressing LCA results in a way that can be compared and calculating the overall CF; (3) evaluation, i.e. estimating the CF and identifying the most suitable material.
The overall CF can be calculated after all the environmental loads within a category are characterised and aggregated using the following equations:
In other words, the environmental loads of the substances grouped in a category are expressed in terms of kg
eq. by multiplying them by a characterisation factor
, which describes the relative harmfulness of environmental loads
within the CF. The resulting impact indicators of
were then aggregated to give an overall
(Equation (Equation2
)). In this study, the characterisation factors
are reported by Hauschild and Potting (Citation2004).
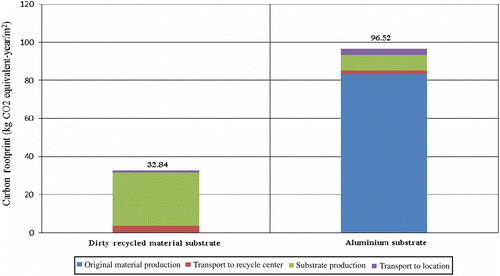
Figure shows the results of CF calculation for 1 m2 DRM and aluminium substrates. It can be seen that the DRM appears to have a lower CF than the aluminium substrate, as the CF generation is three times smaller than the amount generated by the aluminium substrate. It should be noted that this result, i.e. the difference between the CFs of the two materials under investigation, could involve variability due to uncertainty in input data.
Figure 6 Total CF of various materials.
3.4 Interpretation
The objective of interpreting the results is to analyse the results, reach conclusions based on the findings of the preceding phases of the LCA and make recommendations for improving the manufactory process of recycled e-waste plastic substrate.
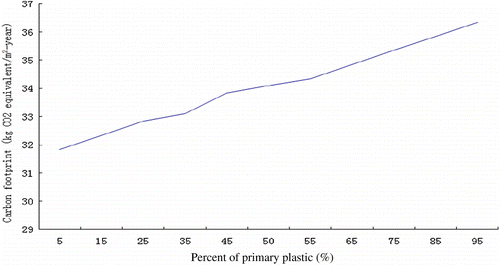
Based on the CF calculation results and the LCA model of the e-waste plastic shown above, the sensitivity analysis can be completed in the GaBi system. The process of blending and compounding is more sensitive than the other processes, because primary and secondary plastic mixed together with different ratios will affect the final CF. The relationship between the ratio of primary plastic used and the CF is shown in Figure . Based on this, the more primary plastic (plastic housings harvested from end-of-life computers and printers) used, the higher CF becomes. Therefore, given similar requirements for mechanical properties, the use of less the primary plastic is a better strategy for the company to reduce the total CF.
Figure 7 CF curve with the ratio of primary plastic.
4. Conclusion
The recycled e-waste plastic material and aluminium sign substrate were compared in the context of CF. The results suggest that the aluminium sign substrate uses more resources and emits a larger quantity of greenhouse gases, which is three times greater than the recycled plastic. Conversely, the recycled plastic substrate uses fewer resources, as well as has a lower climate change effect. Sensitivity analysis is then conducted to find alternatives and suggest some changes in the processes involved for lowering the CF. This study, within the confines of its boundary conditions and modelling assumptions, concludes that reducing the amount of primary plastic being used in the manufacturing process can effectively lower the carbon emission.
Acknowledgement
The authors would like to acknowledge Image Microsystems, Inc., for the input data offered during the preparation of this paper.
References
- Andrews, S.L.D., 2009. A classification of carbon footprint methods used by companies, Thesis. M Eng in Logistics. Massachusetts Institute of Technology, Engineering Systems Division
- Anon, 2001. Greenhouse gas protocol [online]. World Resources Institute (WRI) and World Business Council for Sustainable Development (WBCSD). Available from: http://www.ghgprotocol.org/
- Anon, 2008. Electric power annual (USA). U.S. Energy Information Administration
- Anon . 2010 . Iso 14067: carbon footprint of products , Geneva, Switzerland : International Standards Organization .
- BSI, 2008. Pas2050-assessing the life cycle greenhouse gas emissions of goods and services, British Standards, National Standards Body (NSB) for the UK
- Curran , M.A. 1996 . Environmental life-cycle assessment , New York : McGraw-Hill .
- Hauschild , M. and Potting , J. 2004 . Spatial differentiation in life cycle impact assessment – the edip2003 methodology Environmental News, No. 80
- Moss , J. , Lambert , C.G. and Rennie , A.E.W. 2008 . Sme application of lca-based carbon footprints . International Journal of Sustainable Engineering , 1 ( 2 ) : 132 – 141 .
- Roschke , P.N. and Harrison , B.F. 2000 . Recycled content sign blanks . Journal of Transportation Engineering – ASCE , 126 ( 5 ) : 434 – 439 .
- Spatari , S. 2001 . Using gabi 3 to perform life life cycle engineering cycle assessment and life cycle engineering . The International Journal of Life Cycle Assessment , 6 ( 2 ) : 81 – 84 .
- Wackernagel , M. and Rees , W.E. 1996 . Our ecological footprint: Reducing human impact on the earth , Gabriola Island, BC; Philadelphia, PA : New Society Publishers .
- Wiedmnn , T. and Minx , J. 2008 . A definition of carbon_footprint , Hauppauge, NY : Nova Science Publisher .
- Wiedmann , T. 2006 . Allocating ecological footprints to final consumption categories with input-output analysis . Ecological Economics , 56 ( 1 ) : 28 – 48 .
- Zyl , D.V. 2006 . Life cycle of aluminum , Reno : Mining Life-Cycle Center, University of Nevada .