Abstract
Sustainable development is the development that meets the needs of the present generation without compromising the ability of future generations to meet their own needs. Sustainability assessment is an important part of the decision process in organisations. Sustainability is difficult to define or measure because it is a complex concept. To assess the sustainability level of an organisation, a unique attempt has been made using fuzzy-based Kano model based on the stakeholders' satisfaction. The Kano model is a customer satisfaction assessment tool that must be precise, and it is incorporated with fuzzy logic because it has the capability to replicate the human perceptions. In this context, the approach is used to assess the sustainability by using the stakeholders' satisfaction for different criteria and it provides information regarding improvement in sustainability.
1. Introduction
Sustainability can be assessed by analysing the company's relative position from the stakeholder's perceptions. Kano et al. (Citation1984) have developed a diagram for characterising customer requirements, which is usually called the Kano model. Sustainability assessment is a tool that can help decision-makers and policy-makers to decide what actions they should take and should not take in an attempt to make society more sustainable (Devuyst Citation2001). To present the current approaches to analyse sustainability, appropriate scales and time horizons must be chosen. The preconditions and quantification of sustainability must be clearly explained and the most common triple bottom line (TBL) or the three pillars of sustainable development, economic, environmental and social aspects, have to be clearly defined. This is consistent with the underlying definitions that are focused on economic, ecological and social aspects. In order to measure or predict the sustainability of an organisation as a whole, one must consider the problems of chance analysis of complex systems. Kano's model shows the relationship between the customer satisfaction and the performance of a product or service. In this model, sustainable assessment is subject to value judgement. Sustainability assessment is not pure, neutral, objective science, but rather reflects these implicit value judgements. This kind of sustainability assessment is not only a scientific methodology, but also a value articulating method. This valuation method uses trustworthy data, processing and aggregation procedures. The outcomes are influenced by how the stakeholders are invited to contribute to the valuation, information is provided and questions are stated and it describes the way of handling inevitable uncertainties. This approach of using fuzzy Kano model for sustainability assessment has proved to be effective in the process of analysing the sustainability level of the case study organisation and the result shows the area where the improvement can be made in order to improve the sustainability.
The study begins with the literature review on sustainability assessment and application of Kano model towards identifying the criteria for sustainability assessment. This is followed by the identification of customer's outlook on sustainability of the product. The next step is to evolve a Kano questionnaire followed by data collection, quality attribute judgement and stakeholder satisfaction coefficient calculation. In the consecutive step, the gap analysis was performed for the identification of improvement areas towards improvement of the sustainability of the case organisation.
2. Literature review
The literature review was carried out from the perspective of sustainability assessment using the fuzzy theory and the application of the Kano model approach. The conduct of literature could enable us to better understand the pros and the cons of fuzzy theory-based studies and Kano model.
2.1 Sustainability assessment using fuzzy theory
Vinodh (Citation2011) has used the multi-grade fuzzy approach for assessing sustainability in a manufacturing organisation from three perspectives such as economic, environmental and social and used three levels consisting 37 attributes and 12 criteria. The author has also discussed the industrial implications of the case study. Phillis and Andriantiatsaholiniaina (Citation2001) developed a model called sustainability assessment by fuzzy evaluation (SAFE), which provides a mechanism for measuring development sustainability. It deals with the human and ecological factors as individual inputs; with the aid of fuzzy logic they obtained an overall measure of sustainability. They performed computation from eight secondary and two primary linguistic variables and this model is modular as it permits introduction, deletion or modification of indicators according to changes in reality. Tony (Citation2007) has discussed the non-stochastic, stochastic and fuzzy logic methods for ranking the management alternatives where the ecosystem is unsustainable. They compared these three methods and concluded that the fuzzy logic provides a framework for assessing and managing the sustainability and provided an overview of advantages and disadvantages of these three methods by comparing each other. Hincu (Citation2011) discussed a modelling approach based on fuzzy sets related to the SAFE, a model that provides a mechanism for measuring development sustainability and presented a quantitative methodology to assess the potential sustainability of urban development in terms of adequacy. The approach is formulated based on the multi-criteria and uncertainty by using fuzzy set logic.
2.2 Kano's model
Llinares and Page (Citation2011) used Kansei Engineering, a product development tool used to identify users' perceptions and to find quantitative relationships between their subjective responses and design features and proposed the use of Kano's model to analyse the impact of different subjective attributes on consumers' purchase decisions. With Kano's model, they classified the attributes into basic, excitement and performance factors. Lee and Huang (Citation2009) applied an approach of fuzzy questionnaire to modify Kano's 2D questionnaire and developed a mathematical calculation according to the quality classification of Kano's 2D fuzzy mode to enhance the 2D quality attributions in questionnaire linguistic scale. Chen and Chuang (Citation2008) proposed an integrated approach using Kano's model into a robust design approach that guides the prioritising of multiple criteria and conducted a design experiment for mobile phone to verify the benefits of using the proposed integrative approach and the result shows that the generated optimal mobile phone design can effectively enhance overall aesthetic performance and customer satisfaction. They explained that the proposed method can be further used as a universal robust design approach for enhancing customer satisfaction and product quality. Huiskonen and Pirttilg (Citation1998) analysed the customer service requirements by using Kano's model and described the potential of the method by applying it for a logistics customer service planning process. Lee et al. (Citation2008) included fuzzy mode with Kano's model to make it more objective in the course of weighing and presented an integrative approach by incorporating the Kano model with fuzzy mode into the matrix of quality function deployment (QFD). Matzler and Hinterhuber (Citation1998) have explained that the customer retention strategy can be more effective than the market strategy and the former strategy can be achieved by analysing the customer satisfaction. They explained that the projects can be more successful by integrating Kano's model of customer satisfaction with the QFD. Kim et al. (Citation2008) presented a methodology for a new service creation by finding out the shape and the dimension parameter by applying conjoint analysis and used the Kano model to evaluate the type of alternatives. The proposed approach is expected to help service designers in real service creation processes ranging from the generation of ideas to the evaluation of alternatives.
2.3 Research gap
The authors have attempted the assessment of sustainability by fuzzy approaches and some general ways with the three sustainable perspectives. There exists no simple stakeholder-related assessment for assessing the sustainability. The review has also shown that the traditional Kano's questionnaire will result in a particular value or it will show the result in a particular range but the complexity in human mind has not been taken into account and it is found that most interviewees have not only single feeling but also have multi-feeling with difference (Lee and Huang Citation2009). This complexity can be handled by introducing fuzzy Kano questionnaire; therefore, the inputs for the analysis should be collected in the fuzzy mode.
3. Case study
The case study has been carried out in an automotive component manufacturing organisation located in Trichy, Tamil Nadu, India (hereafter designated as ABC). ABC is the manufacturer of hydraulic power rack and pinion steering gear assembly, integral power steering and power steering pump assembly. ABC aspires to measure the existing sustainability level of their organisation and showed a great interest towards the conduct of this study involving all levels of their management.
4. Kano's model of customer satisfaction in terms of sustainability
Sustainability assessment for the case organisation was carried out using the fuzzy-integrated Kano model. The Kano model was developed in 1980 by Professor Noriaki Kano, based on the concept of customer quality. It is used to analyse and rank the voice of the customer data. It is mainly used for project selection, new product development, and new service development and to determine market strategies. The conventional Kano model does not take into account the uncertainty in human perceptions in order to overcome that problem, fuzzy-based Kano model is introduced in this context. This study presents a novel approach for assessing the sustainability. First, the sustainability enablers such as economic, environment and social are considered and their respective criteria are taken, then survey is conducted and analysed with Kano model to make the requirements more objective when weighing the requirements by fuzzy mode.
4.1 Identification of the criteria for sustainability assessment
The first step in constructing the Kano model for sustainable assessment is the listing of the sustainability criteria associated with the organisation. Vinodh (Citation2011) listed out 12 criteria for sustainability assessment using multi-grade fuzzy approach based on the TBL of sustainable development such as financial health, economic performance, potential financial benefits, trading opportunities, air resources, water resources, land resources, mineral and energy resources, internal human resources, external population, stake holder participation and macro-social performance.
4.2 Identification of the customer's outlook on sustainability of the product
In general, if the stakeholders were given an option to command about the sustainability features of the organization, then the advantageous features will not be revealed because their expectations in achieving sustainability will be more and that kind of survey will be disadvantageous for the case organisation. So in order to reveal the hidden views about the organisation, the questionnaire should include all kind of choices. In this context, in this case study, the options are constructed such that the stakeholders can give their negative vision as well as positive vision about the organisation. In this context, the stakeholders have to choose from five alternatives such as Like, Must-be, Neutral, Live-with and Dislike in a questionnaire.
4.3 Construction of the Kano questionnaire
The questionnaire is based on two forms of the organisation; the first one is the functional form and the other one is the dysfunctional form. The functional form deals with the perception/desire of the customer about the criteria if it functions properly. The dysfunctional form deals with the perception/desire of the customer about the criteria if it functions improperly. By combining the functional and the dysfunctional forms for criteria, the Kano evaluation table is created. The main objective of the Kano models was to reveal, organise and combine five categories of stakeholders' needs and attributes into a matrix. The Kano model of stakeholders' satisfaction divides the product attributes into five categories (Zultner and Mazur Citation2006) and the sixth one (Q) indicates Questionable:
| • | Attractive quality attribute (A): additional attribute that will enhance the stakeholder's satisfaction. | ||||
| • | 1D quality attribute (O): the attributes which are directly proportional to the stakeholder's satisfaction. | ||||
| • | Must-be quality attribute (M): the basic attributes that must be present in order to make the product/service successful. | ||||
| • | Indifferent quality attribute (I): the attribute cannot be assessed as satisfactory or not. | ||||
| • | Reverse quality attribute (R): the attributes which are indirectly proportional to the stakeholders satisfaction. | ||||
The model is represented in a (x, y) graph and it is shown in Figure .
Figure 1 Kano's model and five categories of quality attribute (Kano et al. 1984).
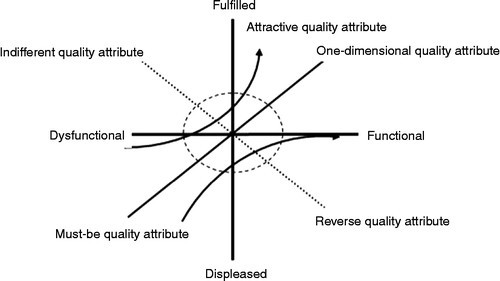
X-axis, represents how good the customer's outcome can be achieved. Y-axis records the customer's level of satisfaction after achieving the perceived level. Pre-preparation for assessing the functional aspects (F) and dysfunctional aspects (D) by obtaining the values, respectively, for Like, Must-be, Neutral, Live-with, Dislike in the form as
The sum of the values should come as one and Kano's 2D fuzzy relation is obtained using the following equation:
4.4 Methodology
A panel consisting of five stakeholders from all levels of the organisation was framed and an orientation programme was conducted towards the assessment of the sustainability level of the case organisation. The questionnaire is framed with respect to 12 criteria for assessing the sustainability level of the organisation and it is given in Table . The questionnaire framed was subjected to severe scrutiny by an external consultant team and all the comments were taken into consideration.
Table 1 Questionnaire for the decision-makers.
4.4.1 Step 1: data collection
The first step was to collect the input for those 12 criteria from five different stakeholders, i.e. every criterion is assessed by enquiring five different members, totally 60 trials were evaluated for both functional and dysfunctional forms. In this survey, the stakeholders are asked to answer with one of the following responses: Like, Must-be, Neutral, Live-with and Dislike for both functional and dysfunctional aspects. The excerpt of the calculation shows the procedural steps involved in the assessment by showing the financial health criterion calculation. Evaluation table for financial health criterion marked by the five interviewees is given in Table .
Table 2 Evaluation table for financial health criterion.
4.4.2 Step 2: matrix formation
As presented in Table , the functional and dysfunctional values are acquired from the five interviewees. Stakeholder I views about the functional and dysfunctional forms of financial health criterion is taken as F = {0.3, 0.3, 0.2, 0, 0} and D = {0, 0, 0, 0.6, 0.4} from Table , then the values are manipulated as matrix elements as F′ and D.
4.4.3 Step 3: computation of evaluation table
After achieving Z-value, compute the evaluation table for the respective criteria using Kano evaluation table as given in Table .
Table 3 Kano evaluation table.
The computation of the evaluation table mainly deals with combining the functional and dysfunctional forms. The computational values are formulated for the respective criteria by each interviewee as given in Table .
Table 4 Evaluation table for financial health criteria by Interviewee 1.
Summing up the values of corresponding attributes of the evaluation table in Z matrix leads to the formulation of the values in Table . Likewise for the remaining interviewees' response, the evaluation table will be created for the financial health criteria and it is presented in Table . In our case, we arrived at 12 tables (by combining the 5 stakeholders' response for 12 criteria).
Table 5 Total level of quality attribute of five interviewees.
4.4.4 Step 4: quality attribute judgement
In order to have an accurate assessment, two threshold values have been chosen and set in consultation with the top management by considering the values achieved in the total level of quality attribute of five interviewees. After analysing the levels of the quality attributes, the top management have set two threshold values such as 0.2 and 0.3. The consensus values are set by replacing the values which are greater than the threshold value as one and less than the threshold value as zero. Then the frequency for all criteria has been calculated by summing up the five interviewees' responses for a criterion (Tables and ).
Table 6 Classification of five interviewee's common consensus for threshold value of 0.2 of financial health criterion.
Table 7 Classification of five interviewee's common consensus for threshold value of 0.3 of financial health criterion.
Frequency of all criteria is formulated and is given in Table .
Table 8 Frequency data of all criteria for threshold value of 0.2.
4.5 Stakeholder satisfaction coefficient calculation
Stakeholder satisfaction coefficient deals with how the criterion is being satisfied in case of fulfillment of the stakeholder and how the criterion is not being satisfied in case of non-fulfillment of the stakeholder desire. The average impact of satisfaction and dissatisfaction are calculated using the equations given below (Matzler and Hinterhuber Citation1998):
5. Results and discussions
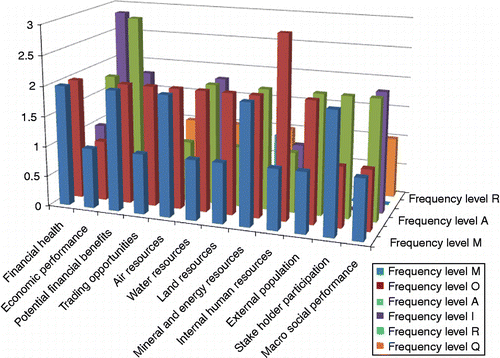
Overall frequency of all criteria is given in Table . By marking those values, the frequency level chart is obtained and it is shown in Figures and to depict the most recurring choice in overall assessment and it is clearly obtained that the criteria follows the order as M>O>A>I>R>Q for the threshold value of 0.2, whereas for the threshold value of 0.3 O>A>M>Q>I>R. The Must-be quality attribute is taken for granted, it should be sufficient and it leads to more satisfaction and when the attractive and 1D quality attribute elements are sufficient, the stakeholders feel satisfactory. The other two attributes, indifferent and reverse, state that the satisfaction depends upon the sufficiency and non-satisfaction will be present when there is insufficiency. Hence, by analysing these attributes, it is judged that M should be higher and R should be lower. Therefore, the prioritising order shows that the organisation is more sustainable for the value of 0.2 and for the value of 0.3, since for value 0.2, M resided in the higher position. In order to improve the sustainability further, the extent of satisfaction and dissatisfaction can be used. This clearly shows which criterion has gained satisfactory result and which criterion has to be improved in order to improve the sustainability.
Figure 2 Frequency level chart for threshold value 0.2.
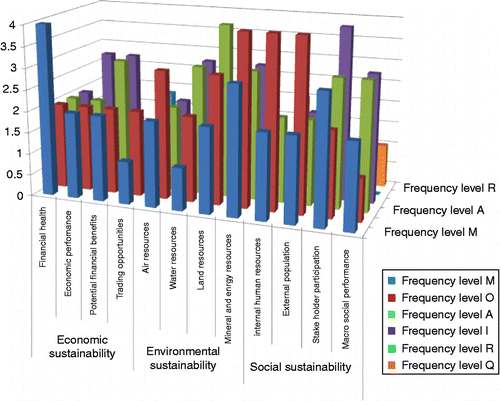
Figure 3 Frequency level chart for threshold value 0.3.
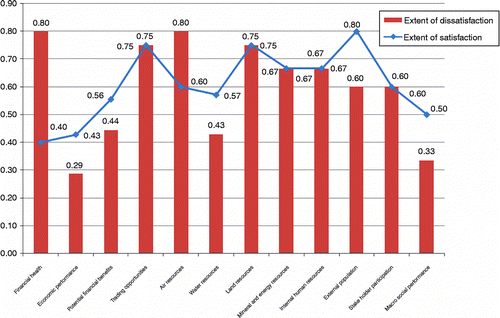
The comparison between the extent of satisfaction and dissatisfaction in Figures and shows that the financial health has to be improved. It also shows that other criteria have also contributed to the dissatisfaction, concluding that the dissatisfactory criteria have to be improved first in order to improve the overall sustainability of the case organisation.
Figure 4 Comparison of satisfaction and dissatisfaction for threshold value of 0.2 for all criteria.
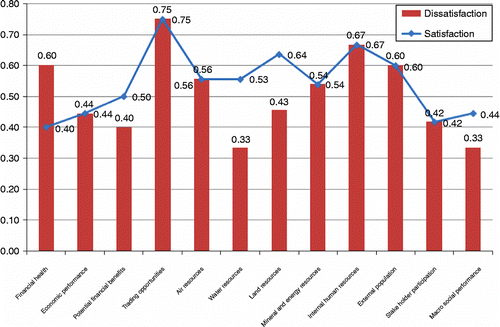
Figure 5 Comparison of satisfaction and dissatisfaction for threshold value of 0.3 for all criteria.
6. Conclusion
The increasing competition has been forcing the manufacturing organisation to recognise the importance of sustainability phenomena. Sustainability focuses on TBL (Pope et al. Citation2004). The contemporary organisations are forced to evolve sustainable products which are environmental conscious. In this context, the assessment of sustainability gains vital importance. The sustainability assessment of ABC implies that ABC is a sustainable organisation. But there still exists scope for sustainability improvement of ABC. In this regard, the target areas for sustainability improvement of ABC have been identified. This kind of sustainability assessment exercise would enable the contemporary organisation to survive in the competitive market scenario for achieving world-class status. The concept model for sustainability assessment has been test implemented in a single manufacturing organisation and fuzzy Kano model method has been used for sustainability evaluation. In the future, more number of studies could be conducted for several organisations as a process of validation.
Acknowledgements
The authors express their special thanks to the Department of Science and Technology (DST), New Delhi, India, for the financial support extended towards the implementation of project titled ‘Development of a model for ensuring sustainable product design in automotive organizations’ (Ref No. SR/S3/MERC-0102/2009). This research study forms a part of this principal research project.
Related Research Data
References
- Chen , C.C. and Chuang , M.C. 2008 . Integrating the Kano model into a robust design approach to enhance customer satisfaction with product design . International Journal of Production Economics , 114 : 667 – 681 .
- Devuyst , D. 2001 . Introduction to sustainability assessment at the local level. How green is the city? Sustainability assessment and the management of urban environments , 1 – 41 . New York : Columbia University Press .
- Hincu , D. 2011 . Modellling the urban sustainable development by using fuzzy sets. Theoretical and empirical researches in urban management . Econpapers , 6 ( 2 ) : 88 – 103 .
- Huiskonen , J. and Pirttilg , T. 1998 . Sharpening logistics customer service strategy planning by applying Kano's quality element classification . International Journal of Production Economics , 56-57 : 253 – 260 .
- Kano , N. , Seraku , N. , Takahaashi , F. and Tsuji , S. 1984 . Attractive quality and must-be quality . Hinshitsu: The Journal of the Japanese Society for Quality Control , 14 : 39 – 48 .
- Kim , C. , Choe , S. , Choi , C. and Park , Y. 2008 . A systematic approach to new mobile service creation . Expert Systems with Applications , 35 : 762 – 771 .
- Lee , Y.C. and Huang , S.Y. 2009 . A new fuzzy concept approach for Kano's model . Expert Systems with Applications , 36 : 4479 – 4484 .
- Lee , Y.C. , Sheu , L.C. and Tsou , Y.G. 2008 . Quality function deployment implementation based on Fuzzy Kano model: An application in PLM system . Computers and Industrial Engineering , 55 : 48 – 63 .
- Llinares , C. and Page , A.F. 2011 . Kano's model in Kansei Engineering to evaluate subjective real estate consumer preferences . International Journal of Industrial Ergonomics , 41 : 233 – 246 .
- Matzler , K. and Hinterhuber , H.H. 1998 . How to make product development projects more successful by integrating Kano's model of customer satisfaction into quality function deployment . Technovation , 18 ( 1 ) : 25 – 38 .
- Phillis , Y.A. and Andriantiatsaholiniaina , L.A. 2001 . Sustainability: an ill-defined concept and its assessment using fuzzy logic . Ecological Economics , 37 : 435 – 456 .
- Pope , J. , Annandale , D. and Saundersb , A.M. 2004 . Conceptualising sustainability assessment . Environmental Impact Assessment Review , 24 : 595 – 616 .
- Tony , P. 2007 . Assessing ecosystem sustainability and management using fuzzy logic . Ecological Economics , 61 : 171 – 177 .
- Vinodh , S. 2011 . Assessment of sustainability using multi-grade fuzzy approach . Cleaner Technology Environment Policy , 13 ( 3 ) : 509 – 515 .
- Zultner , E.R. and Mazur , G.H. 2006 . “ The Kano model recent developments ” . In The eighteenth symposium on quality function deployment , Austin, TX. Ann Arbor, MI : QFD Institute . 2 December