Abstract
This paper presents a case study about the optimal allocation of a solar photovoltaic (PV) system in a rural area network using genetic algorithms. After developing a power flow model based on the available network data, the system performance is studied in terms of power losses for different scenarios. Using loss minimisation as an objective function, the optimal location and size of the solar PV system can be found. In addition, fuel saving, loss reduction and environmental benefits of the proposed solar PV system size at the optimal location are quantified. The results show that the optimal location of the planned 100 kW solar PV system will reduce power losses by 5.7%. Furthermore, at a 30% penetration level, the optimal location of the solar PV system will reduce the losses by 13.4%.
Introduction
The Sultanate of Oman is located in southwest Asia on the extreme south-eastern coast of the Arabian Peninsula, sharing its borders with three countries: the Republic of Yemen, the United Arab Emirates and the Kingdom of Saudi Arabia (UN 2004). The total land area of the country is 309,500 square km with a total population of about 3 million (MONEOman Citation2013). Most of the electrical power produced is based on natural gas. Moreover, in some remote rural areas, the load is limited to small communities, and therefore these remote communities are powered by diesel fuel generators (AER Citation2012).
Although Oman is located in a region where solar energy potential is excellent, solar energy applications have been mainly limited to street lighting, traffic lights, telephone services in remote areas and cathodic protection of pipelines. However, it has been realised that renewable resources are essential components of Oman's national energy supplies, as well as a global strategic option for both extending the life of oil and gas reserves and reducing carbon dioxide emissions to combat climate change. The Authority for Electricity Regulation in Oman has confirmed a shortlist of six renewable energy pilot projects, of which four are solar projects (Johansson and Turkenburg Citation2004).
Solar photovoltaic (PV) systems are classified under renewable-based distributed generation (DG) resources. Despite the benefits of renewable-based DG (Elhadidy and Shaahid Citation2009; Al-Badi and Bourdoucen Citation2011), their presence in distribution systems alters the power flow and may have technical and economic impacts on the systems. Therefore, it is important to optimally allocate DG units in distribution systems (Atwa and El-Saadany Citation2010; Abu-Mouti and El-Hawary Citation2011). In this study, the impact of solar PV systems on system losses will be investigated. The size and location of the solar PV system will be optimised to minimise the losses. Genetic algorithm (GA) will be used to solve the optimisation problem.
This paper is divided into several parts. Section 2 presents the system data. Section 3 describes the model of the system under study. Section 4 presents the results and discussions. The final section presents a summary of the main conclusions.
System data
Rural areas electricity company
The Rural Areas Electricity Company SAOC (RAECO) is a closed Omani joint stock Company registered under the Commercial Companies Law of Sultanate of Oman. The company is primarily undertaking electricity generation, transmission, distribution and desalination projects in rural areas under a license issued by the Authority for Electricity Regulation, Oman (RAECO Citation2012). The six renewable energy pilot projects announced by the Authority for Electricity Regulation are being implemented within the RAECO networks. These projects offer economic benefits in the form of avoided costs of diesel fuel generation and other potential benefits such as the transfer of knowledge and experience to Oman, as well as capacity building within the RAECO and other Oman entities and companies (Al-Badi et al. Citation2011). One of these projects is a 100 kW solar PV system carried out in Hijj in Al Wosta Governorate.
Hijj network
The Hijj network consists of two main feeders from one power station with 94 buses, as shown in Figure . There are four sizes of 11 kV/415 V transformers as listed in Table . Details of loading on these transformers are not available. The RAECO recommended the assumption of 56% loading with a 0.85 lagging power factor on each transformer to match the recorded power generation data. Line data (types and lengths) are provided by the RAECO.
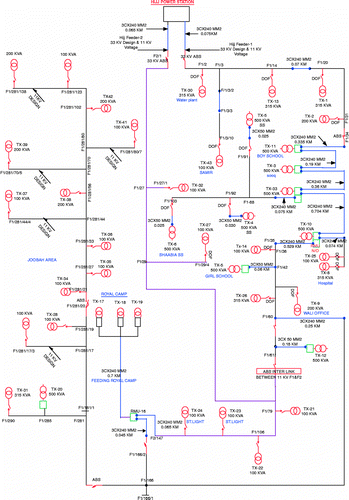
Table 1 11 kV/415 V transformer data.
PV data
In this study, the proposed PV plant is modelled on the basis of its average output or its capacity factor (CF). To calculate the CF of the proposed PV plant, RETScreen software is used (NRCA 2010). Solar irradiation data are obtained from the RETScreen weather database. For the calculation of the CF, 100 kW Mono-Si cell data are obtained from the RETScreen database. PV modules are considered to be fixed at an angle equal to the site latitude and south facing. Inverter efficiency is considered as 90% and PV module losses due to temperature and dust are considered to be equal to 10%. According to these data, the CF value of the PV station in Hijj is equal to 16%.
System modelling
Power flow model
Power flow analysis is used as a part of power system operation and planning. Using the network, load and generation data, the power flow model of the system can be developed. This model calculates voltages (magnitudes and angles) and line flows in the network by solving the real (Pi) and reactive (Qi) power balance equations, which are as follows:
To solve these nonlinear equations iteratively, Newton–Raphson, Gauss–Seidel and fast decoupled methods are commonly used (Saadat Citation1999). In this study, the MATLAB Load Flow Toolbox is used to build the network model. Input data consist of two input matrices.
The first matrix is the bus data matrix that describes bus type, voltage, generation and load. The second matrix is the line and transformer data matrix that describes all connections between buses including branch impedances. Once the power flow problem is solved, total losses in the system can be calculated. To study the effect of installing DG units on the losses, a GA toolbox in MATLAB is utilised (MathWorks Citation2013).
Genetic algorithms
GAs are global search heuristics based on the mechanics of natural genetics (Srinivas and Patnaik Citation1994). They are a particular class of evolutionary algorithms that use techniques inspired by evolutionary biology such as inheritance, mutation, selection and crossover. GAs maintain a population of individuals that represent candidate solutions to a given problem. GAs have been used in technology and science as they can produce a high-quality solution.
The GA process starts with an initial solution from a population of randomly generated individuals. An individual represents a candidate solution to the problem. In each generation, the fitness of each individual in the population is evaluated. Thereafter, the reproduction operator is the first to be applied, which follows the Darwinian theory of the survival of the fittest and can be considered as an artificial version of the natural selection process. The chance of an individual to be selected depends only on its fitness value. The selection process promotes the propagation of strong individuals, but it does not yield better ones. To find better solutions, new stronger individuals must be created. This is the purpose of the crossover procedure. By mating reproduced individuals and, in this way, combining their features, new individuals of better quality can be constructed. The action of reproduction and crossover together speculates on new better solutions created from the high-quality solutions of previous generations. Mutation enhances diversity among the population. If an individual, which represents a suboptimal solution to the optimisation problem, takes over a major part of the population, then the danger of premature convergence appears. A sufficiently high mutation rate can help to prevent this problem by changing the values of binary digits at random and thus forcing diversity among the population. However, mutation rates must be kept low as in natural populations. Otherwise, good solutions will be destroyed with a very high probability. The algorithm terminates when either a maximum number of generations is produced or a satisfactory fitness level is reached for the population. The design of the fitness function is dependent on a particular optimisation problem. In this study, the total power loss in the system is defined as the fitness function to be minimised by iteratively adjusting the size and location of DG units.
The GA can be formulated as follows (Figure ):
Step 1: the construction of the initial population. It is obtained by randomly drawing among possible values of variables. The individual (solution of the problem) represents a set of decimal variables associated with new additions or changes in the system. In this problem, individuals represent sets of PV size at designated locations (bus bars in the network). The ranges of PV size as well as the participated locations are pre-specified at the beginning. 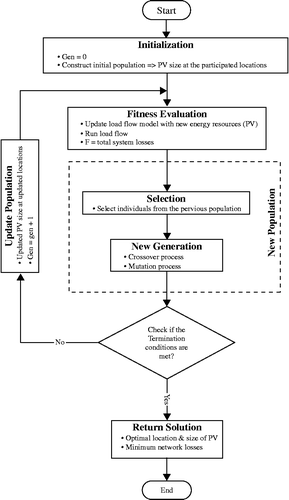 | |||||
Step 2: fitness computation for individuals of the population. It is equal to the objective function for this solution. In this problem, a load flow model of the network is used to evaluate the fitness of individuals. The load flow model is updated with new power resources (PVs) at the designated bus bars. Then, using this load flow solution, the total network losses can be calculated and assigned as the fitness value for that individual. This cycle is repeated for the entire population. | |||||
Step 3: genetic operators realise the evolutionary process of a population. | |||||
Step 3.1: the selection of the parents. This operator makes the selection of candidate individuals to participate in reproduction based on the fitness value. | |||||
Step 3.2: the crossover of individuals. A simple single-point crossover is applied with a defined probability to obtain new solutions. | |||||
Step 3.3: the mutation of individuals. One selected gene in each individual is mutated with a defined probability. A new value of this gene is generated randomly based on the predetermined limits. | |||||
Step 4: the checking of the termination criteria (the maximum number of generations or the maximum number of iterations with no change in the best solution). The iteration process will stop if one of the termination criteria is reached, otherwise go to step 2. Once the iteration process stops with no change in the best solution, the optimal solution (in this problem is the PV size and location) is achieved. | |||||
Model verifications
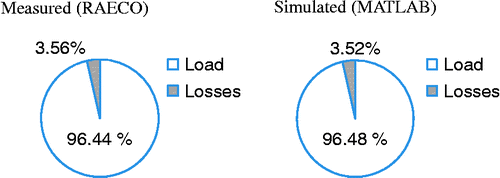
A comparison between the measured and simulated power data is shown in Figure . The results show that there is a minor difference between the measured and simulated values.
Results and discussion
System performance without DG
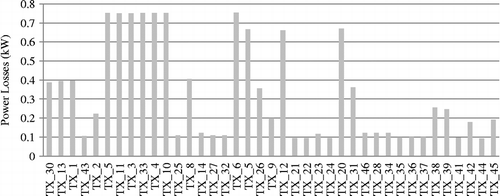
Power losses in transformers are shown in Figure . As all transformers are assumed to be 56% loaded, there exist four levels of losses corresponding to the four sizes. The maximum power loss occurs across the 500 kVA transformers. Among this group of transformers, different power losses occur due to different voltage levels at the primary windings of transformers, which is affected by the distance from the power station.
The total real power losses in transformers and lines represent 3.52% of the total generated power (175 kW), as shown in Figure . It is worth mentioning that according to the current plan, the 100 kW solar PV system will be installed at the generation station. Therefore, the value of losses will not be affected as the installation of the solar PV system at the generation station will not alter the power flow. The only impacts are emission and fuel consumption reduction.
Optimal location of the current proposed size
Using GAs, the best location for adding the proposed size of the solar PV system is found to be at the end of the Joobah Area feeder at pole number F1/281/123. The total real power losses decreased from 175 to 165 kW (5.7% reduction).
Optimal allocation of DG for loss minimisation
Power losses are proportional to the resistance of the power path and the loading of the line. Unlike central plants, DG is located near consumers; therefore, the resistance of the current path is much lower than that between central plants and electricity consumers. Moreover, DG will reduce the loading of transmission lines and relieve heavily loaded lines, leading to further reduction in power loss. It has been demonstrated that loss reduction depends on the penetration, location and reactive power control of DG (Albadi and El-Saadany Citation2008; Attwa et al. Citation2009). In general, the total system loss decreases as the size of the solar PV system increases up to a certain level (Figure ). Beyond this level, the losses start to increase due to a high reverse power flow.
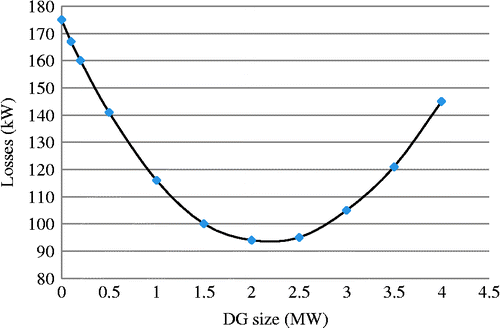
The optimal size and location of the solar PV system is found to be connected near to pole number F1/60 with a size of 2.18 MW (average output). The total real power loss is decreased from 175 to 95 kW (45.7% reduction).
System performance considering the DG penetration limit
Since the solar PV system is an intermittent source of power, the optimal size of the solar PV system found in the previous section is not practical. According to the RAECO, the maximum penetration level that the system can accommodate without affecting its stability is about 30% of its total generation capacity. This corresponds to 232 kW (average output). Using GAs, the optimal location for this size is found to be near to pole number F1/281/138. In this case, the total loss is reduced from 175 kW to 152 kW (13.4% reduction).
Quantification of fuel saving and environmental benefits
Using the 30% penetration level scenario (232 kW average output), the potential fuel saving and environmental benefits are calculated in Table .
Table 2 Quantification of fuel saving and environmental benefits.
According to the RAECO, the average cost of the existing diesel generation facilities in Hijj is 38.848 OMR/MWh (100.6 US$/MWh). The annual energy production from the PV station is 2032 MWh (CF × installed capacity × 8760). The energy supplied by the solar PV system will reduce diesel fuel consumption. This reduction in fuel consumption is $US 204,485 annually. In addition, an average loss reduction of 23 kW is achieved which corresponds to US$ 20,272 annually. Moreover, considering an average CO2 damage cost of 20 US$/tCO2, the environmental avoided cost is estimated to be US$ 28,533. It is worth mentioning that the cost of energy (COE) of solar PV systems is still higher than that of diesel-based generation in most of the locations in Oman (Al-Badi et al. Citation2011). The COE of solar PV systems for the site under study is estimated to be about 260 US$/MWh (Al-Badi et al. Citation2011).
Conclusions
Despite the benefits of renewable-based DG, their presence in distribution systems alters the power flow and may have technical and economic impacts on the systems. Therefore, it is important to optimally allocate DG in distribution systems. This study investigated the impact of solar PV systems on system losses. Based on loss minimisation, the size and location of the solar PV system was optimised using GAs. Based on the data provided by the RAECO, the system model is built with sufficient accuracy. From the perspective of loss minimisation, the optimal size of the solar PV system is higher than the maximum penetration level of the PV system set by the distribution company. With this penetration level as a binding constraint, the optimal location of the solar PV system can be found. In addition, this paper quantified three potential benefits gained by the installation of the solar PV system. These benefits are fuel saving, loss reduction and environmental benefits (emission reduction).
REFERENCES
- Abu-Mouti, F. S., and M. E.El-Hawary. 2011. “Optimal Distributed Generation Allocation and Sizing in Distribution Systems via Artificial Bee Colony Algorithm.” IEEE Transactions on Power Delivery26 (4): 2090–2101.
- AER, A. f. E. R.2008. “Study on Renewable Energy Resources in Oman.” Retrieved March 17, 2013. www.aer-oman.om.
- AER, A. f. E. R.2012. “2011 AER Annual Report.” Retrieved March 17, 2013.
- Al-Badi, A., and H.Bourdoucen. 2011. “Feasibility Analysis of Renewable Hybrid Energy Supply Options for Masirah Island.” International Journal of Sustainable Engineering1–8.
- Al-Badi, A. H., M. H.Albadi, A. M.Al-Lawati, and A. S.Malik. 2012. “Economic perspective for PV electricity in Oman.” Energy-The International Journal5 (3): 226–232.
- Al-Hinai, A.2010. “Dynamic Stability Enhancement Using Genetic Algorithm Power System Stabilizer.” International Conference on Power System Technology (PowerCon2010), Hangzhou, China.
- Albadi, M. H., and E. F.El-Saadany. 2008. “The Role of Distributed Generation in Restructured Power Systems.” IEEE PES North American Power Symposium (NAPS08). Calgary, AB, Canada.
- Attwa, Y. M., E. F.El-Saadany, and M. H.Albadi. 2009. “Optimum Allocation of Wind Based DG in Unbalanced Rural Network.” International Conference on Computer Communication and Power (ICCCP09). Muscat, Oman.
- Atwa, Y. M., and E. F.El-Saadany. 2010. “Optimal Allocation of ESS in Distribution Systems With a High Penetration of Wind Energy.” IEEE Transactions on Power Systems25 (4): 1815–1822.
- Elhadidy, M. A., and S. M.Shaahid. 2009. “Exploitation of Renewable Energy Resources for Environment-Friendly Sustainable Development in Saudi Arabia.” International Journal of Sustainable Engineering2 (1): 56–66.
- IPCC, I. P. o. C. C.2006. “2006 IPCC Guidelines for National Greenhouse Gas Inventories.” Japan.
- Johansson, T. B., and W.Turkenburg. 2004. “Policies for Renewable Energy in the European Union and its Member States: An Overview.” Energy for Sustainable Development8 (1): 5–24.
- MathWorks, T.2013. “MATLAB – The Language of Technical Computing.” Retrieved March 17, 2013. http://www.mathworks.com/products/matlab/index.html.
- MONEOman, M. o. N. E.2013. “The Statistical Year Book 2012.” Retrieved March 16, 2013. http://www.moneoman.gov.om.
- NRCA, N. R. C.2010. “Renewable Energy Project Analysis Software (RETScreen 4).” Retrieved March 17, 2013. http://www.retscreen.net.
- RAECO, R. A. E. C. S.2012. “Rural Areas Electricity Company.” Retrieved March 17, 2013. http://www.reefiah.com.
- Saadat, H.1999. Power System Analysis. Singapore: McGraw-Hill.
- Srinivas, M., and L. M.Patnaik. 1994. “Genetic Algorithms: A Survey.” Computer27: 17–26.