
Abstract
Alternative fuels have several advantages compared to fossil fuels as they are renewable, biodegradable, provide energy security, foreign exchange saving as well as help in addressing environmental concerns and socio-economic issues. Therefore, renewable fuels can be used predominantly as a fuel for transportation and for applications in power generation. Shaft power application is a key factor for economic growth and prosperity and depends crucially on the long-term availability of energy from sources that are affordable, accessible and environmentally friendly. In this context, the main objective of the present study was to implement the production of bioethanol from Calliandra calothyrsus, a potential lignocellulosic raw material for the cellulose-to-bioethanol conversion process that can be used as an alternative resource to starch- or sugar-containing feedstock. This study addresses a new pretreatment method known as hydrothermal explosion using C. calothyrsus for ethanol production. The present study also involves experimental investigations on a single-cylinder, four-stroke, direct-injection diesel engine operated with Honge oil methyl ester (biodiesel) and ethanol and its comparison with a neat diesel fuel mode of operation. The results revealed that optimal parameters for bioethanol production from C. calothyrsus were 2% acid concentration (HCl), 100°C temperature and 80 min retention time. For a diesel engine operated with a HOME–bioethanol blend, the experimental results showed a 3–4% decrease in brake thermal efficiency with a 8–10% increase in hydrocarbon and carbon monoxide emission levels and a 15–18% decrease in nitric oxide emission levels when compared with a neat diesel fuel mode of operation.
1. Introduction
In view of continuously rising petroleum price and the use of fossil fuel resources, considerable attention has been focused on alternative energy resources. To deal with the twin problems of fuel scarcity and air pollution caused by the increasing use of fossil fuels, many countries are currently using alternative renewable and clean-burning fuels such as biodiesel and bioethanol in motor vehicles. Biofuels such as vegetable oil and bioethanol are the most promising alternative fuels to a compression ignition (CI) engine fuel, because these biofuels are renewable, environment-friendly, non-toxic and biodegradable as well as they have no aromatic and sulphur containing compounds and have a favorable heating value and cetane number. However, it has been found that neat vegetable oil poses some problems when it is directly used as a diesel substitute (Banapurmath, Tewari, and Hosmath Citation2008; Murugesan et al. Citation2009; Demirbas Citation2009). These undesirable conditions arise due to a larger molecular mass and chemical structure, a higher viscosity, a low volatility and the polyunsaturated character of vegetable oils (Murugesan et al. Citation2009; Banapurmath, Tewari, and Hosmath Citation2008). These problems can be solved if neat vegetable oils are chemically modified to biodiesel fuel, which is similar in characteristics to a diesel fuel. Biodiesel is defined as a liquid hydrocarbon (HC) fuel composed of fatty acids and monohydric alcohol esters whose molecular composition may change depending on the feedstocks used for fuel synthesis (Sayin and Canakci Citation2009). Exhaustive literature work on the use of vegetable oils and their blends in diesel engine applications has been published by various researchers (Banapurmath, Tewari, and Hosmath Citation2008; Murugesan et al. Citation2009; Demirbas Citation2009; Sayin and Canakci Citation2009). Many studies have also reported that the addition of ethanol in the range of 5–20% in biodiesel increases the fuel efficiency with reduced emission levels (Banapurmath, Tewari, and Yaliwal Citation2010; Chen, Shuai, and Wang Citation2007; Corkwell, Jackson, and Daly Citation2003; Li et al. Citation2005; Hansen, Zhang, and Lyne Citation2005; Hayes et al. Citation1988; Likos, Callahan, and Moses Citation1982; Meiring et al. Citation1983; Noguchi, Terao, and Sakata Citation1996; Park et al. Citation2008; Shropshire and Goering Citation1982; Stage de Caro et al. Citation2001; Xingcai, Wugau, and Degang Citation2004). The production of bioethanol from biomass resource will reduce both the consumption of crude oil and environmental pollution. Efforts have been made to convert biomass into biofuels, since the oil crisis in the mid-1970s. Many cellulosic materials, ranging from agricultural wastes to energy crops, have been tested to produce bioethanol. Ethanol produced from corn and sugar has been used for mixing with gasoline, but for such production huge valuable farmlands need to be diverted. Cellulosic ethanol offers a promising future because cellulose fibre is a major and universal component in all plant cell walls, which can be used to produce ethanol (Inderwildi and King Citation2009). According to the International Energy Agency, it can be considered that cellulosic ethanol will play a much bigger role in the future (World Energy Outlook Citation2006). Therefore, bioethanol represents an important renewable liquid fuel for motor vehicles.
In Brazil and the USA, ethanol is widely used, and in 2011, both countries were responsible for 87.1% of the world's ethanol production. In India, ethanol is mainly produced from molasses, which is in limited supply. The production of ethanol from cellulose is still at its nascent stage. So far, no large-scale conversion process of cellulose to ethanol has been reported in India.
Lignocellulosic biomasses such as crops, forests and agricultural residues can be used as low-cost and sustainable resources for the production of bioethanol for reducing greenhouse gas emissions, improving the economy and enhancing energy security and the disposal of solid wastes (Wyman Citation2003). Lignocellulose processing for ethanol production involves four major unit operations: pretreatment, hydrolysis, fermentation and separation/purification of the product (Taherzadeh and Karimi Citation2008). Owing to the tight bonding between polymeric constituents such as cellulose, hemicellulose and lignin, and also to the crystalline nature of cellulose, lignocellulosic materials are not feasible for hydrolysis (Howard Citation2003). With pretreatment of lignocellulosic materials, it is possible to make cellulose more accessible for hydrolysis to provide a high yield of monosaccharides for the fermentation process (Mosier et al. Citation2005). One such lignocellulosic biomass is Calliandra calothyrsus, which is considered as a waste, fast-growing indigenous shrub and a highly cellulosic, renewable and sustainable resource that can grow locally at all climatic and acidic soil (pH 4–5) conditions. The potential yield of C. calothyrsus is about 15–40 ton/ha/year and its ecological requirements have been reported in the literature (Poetsch and Lück Citation2003). Due to its unique characteristic of being highly cellulosic (46–48%), it is the most promising biomass for producing cellulosic ethanol compared with other existing biomass sources. Hence, it is possible to obtain cellulosic bioethanol with an acceptable energy content. Furthermore, local farmers can be benefited by cultivating a huge amount of this shrub on a wasteland.
Bioethanol production from different cellulosic biomasses has been investigated by many researchers (Bjerre et al. Citation1996; Dien et al. Citation2006; Holtzapple et al. Citation1991; Laser et al. Citation2002; Liu and Wyman Citation2005; Mosier et al. Citation2005; Pérez et al. Citation2008). However, the production of bioethanol from C. calothyrsus has not yet been investigated. Also, researchers have reported various hydrothermal methods such as steam explosion, ammonia fibre explosion and wet oxidation for the preparation of cellulose for bioethanol production (Bjerre et al. Citation1996; Holtzapple et al. Citation1991; Mosier et al. Citation2005). In view of this, an attempt was made to investigate a new method known as hydrothermal explosion using C. calothyrsus for the production of bioethanol. The next phase of the work involves experimental investigations on a single-cylinder, four-stroke, direct-injection diesel engine operated with a Honge oil methyl ester (HOME) and bioethanol blend and its comparison with a neat diesel fuel mode of operation.
1.1 Use of ethanol in a CI engine
Ethanol is extracted from biomass material and has a good CO2 emission balance. The use of ethanol in diesel fuels reduces smoke and particulate emissions (Likos, Callahan, and Moses Citation1982; Park et al. Citation2008). Various methods of employing an ethanol–diesel dual fuel operation have been developed, which can be grouped into three types: (i) ethanol fumigation method (Hayes et al. Citation1988; Meiring et al. Citation1983; Park et al. Citation2008), (ii) dual injection system method, which is not considered to be very practical and (iii) blends or emulsions of ethanol and diesel/biodiesel using an emulsifier to mix the two fuels to prevent separation (Hayes et al. Citation1988; Noguchi, Terao, and Sakata Citation1996; Park et al. Citation2008). Properties of ethanol in terms of the octane number and the latent heat of vaporisation allow a large improvement in engine performance. Ethanol has a very low cetane number and reduces the cetane level of diesel/biodiesel–ethanol blends due to which the use of cetane-enhancing additives is necessary (Xingcai, Wugau, and Degang Citation2004). Additives improve ignition delay and mitigate cyclic irregularity (Chen, Shuai, and Wang Citation2007). Ethanol has a much lower flash point than diesel fuel which requires more precautions while handling these blends (Li et al. Citation2005). Anhydrous ethanol (200 proof) does not require an emulsifying agent but a lower-proof ethanol does require an emulsifying agent to form an opaque macro-emulsion. This could then separate into two phases if allowed to stagnate for a long period (Hansen, Zhang, and Lyne Citation2005; Stage de Caro et al. Citation2001). From the viewpoint of engine durability, blends with up to 15% (by vol.) ethanol in a diesel/biodiesel fuel can be considered to be relatively safe. Cold flow properties will be improved when the proportion of ethanol is increased in a biodiesel–ethanol blend (Muralidharan et al. Citation2004). However, many researchers have reported that the use of ethanol in an engine causes corrosion when it reacts with Al, brass and Cu materials and also blocks the fuel flow when ethanol reacts with rubber in the fuel pipe line. Therefore, a suitable fuel pipe made up of fluorocarbon rubber is used instead of other types of rubber (Hansen, Zhang, and Lyne Citation2005).
2. Characterisation of the fuels used
In the present study, two alternative fuels were used, which is HOME derived from Honge oil using a conventional transesterification process and bioethanol derived from C. calothyrsus, both of which were produced at our college laboratory. The properties of HOME and bioethanol are given in Table . The physico-chemical properties of bioethanol depend on the type of feedstock used.
Table 1 Properties of diesel, HOME and its blends with bioethanol.
Honge oil is also called Karanja oil. Its botanical name is Pongamia pinnata L. and belongs to the family of Leguminosae or Papilionaceae. This tree generally attains a height of about 18 m and a trunk diameter of more than 50 cm. It can grow on most of the soil types, ranging from stony to sandy to clayey. It does not grow well in dry sands. This tree bears green pods, which after 10 to 11 months matures and changes to tan colour in the month of May–June. The pods are elliptic with 4–7.5 cm long. The seeds are usually elliptical, 1.7–2 cm long and 1.2–1.8 cm broad, wrinkled with reddish-brown leathery testa. The tree starts bearing at the age of 4–7 years and the pods come to harvest at different periods of the year in different parts of the country, but the harvest season extends in general from November–December to May–June (http://www.Svleve.com/karanj.htm). The yield of the seeds has been reported to range from 9 to 90 kg/tree. Honge oil can be cultivated on any type of soil that has low moisture demand (Srivastav and Verma Citation2008).
C. calothyrsus belongs to the family of Fabaceae and is popularly known as ‘red calliandra’, which is one of the promising cellulosic feedstocks for ethanol production due to its high cellulose content. C. calothyrsus is a small, perennial, thornless multistemmed shrub. It grows to a height of 3–15 m and has a trunk diameter of 25–40 cm. Its leaves are usually bipinnate. The tree starts to bear seeds after 6 months. The cellulose of C. calothyrsus can be harnessed for ethanol production. It can be used as green manure, animal fodder, bee forage and pulpwood, and it is widely distributed in humid/sub-humid regions of Central and South America and Mexico. It was introduced in Indonesia during 1936 and spread thereon to other parts of the tropics. In Africa, it is now most widely used as fodder. C.calothyrsus is naturally and abundantly found in many tropical regions and can be used as fuel wood, plantation shade and reforestation. It grows on all soil types and sandy clays. The composition of the raw material was determined at our college laboratory. Cellulose and hemicellulose were determined according to the procedures described by Goering and Van Soest (Citation1970), while Klason lignin, ethanol–benzene soluble substances and ash content were determined by using TAPPI Standard Test Methods T 222 om-06, T 204 cm-07, T 413 om-06, respectively. Due to the minor significance of other fractions present in the material, those compounds were not determined. All calculations were made on an oven-dried basis and are listed in Table .
Table 2 Composition of the raw materials used.
3. Bioethanol production from C. calothyrsus
The experimental methods for bioethanol production involve hydrothermal explosion, acid hydrolysis, fermentation and distillation. The raw material used for the experiment was C. calothyrsus. Details of the experimental set-up are given below.
Hydrothermal explosion is a new and attractive pretreatment method that does not require any use of chemicals. In this method, water is maintained in the liquid state at elevated temperatures using pressure, and then water is depressurised to fracture the lignocellulosic material into a hydrothermal unit. C. calothyrsus is a type of flowering shrub, available abundantly in the western part of the Karnataka state. During the preparation of the raw material, the stems are first cut into small pieces, dried and then powdered. Finally, the raw material passing through a 40-mesh (0.40 mm) filter is collected, as shown in Figure .
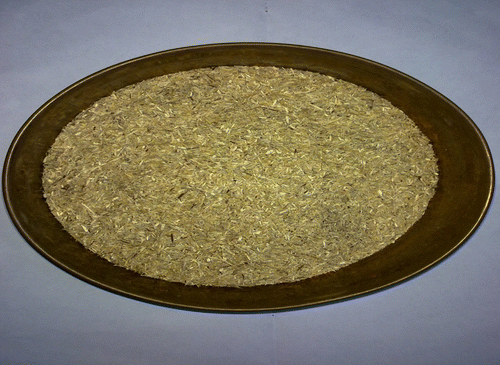
Figure shows the experimental set-up for a hydrothermal explosion unit consisting of an 8 mm-thick vessel with a 7-litre capacity that can withstand a pressure up to 12 bar. Figure shows the hydrothermal explosion of C. calothyrsus. The moisture content of C. calothyrsus is 8–10% and its presence in the biomass does not affect bioethanol production. However, a water content ratio of 1:50 (w/v) is essential at the hydrothermal explosion stage.
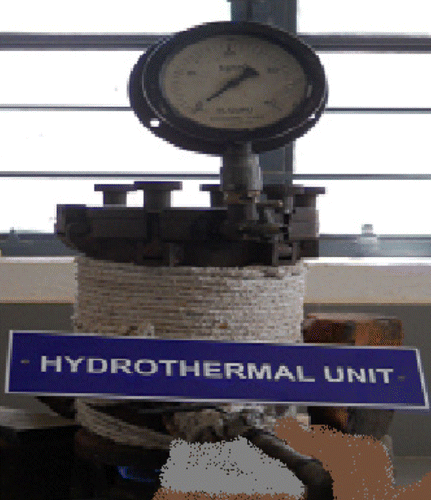
Pretreatment was performed in a laboratory-scale hydrothermal unit equipped with temperature and pressure sensors. The amount of the loaded feedstock corresponded to a solid/liquid ratio of 2:50 (w/v). Chemicals were not used in the explosion unit. The hydrothermal unit was kept sealed. Preheating time is required to attain a pressure of 5 bar and a temperature of 150°C in the hydrothermal unit. Biomass is retained at this condition for 45 min and depressurised suddenly to atmospheric pressure. The pretreated material was collected and filtered to separate the solid material from liquid. After the hydrothermal explosion, the solid material obtained was washed with 200 ml hot water.
3.1 Acid hydrolysis
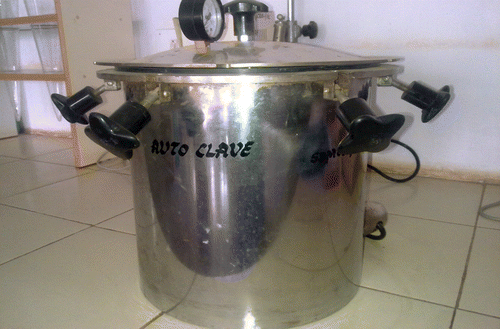
The pretreated material with solid/liquid loading at 10% (w/w) was hydrolysed in an autoclave at different temperatures (50, 75 and 100°C) with different retention time (10–90 min) and different hydrochloric acid (HCl) concentrations (0.5, 1.0 and 2.0%, w/w) of 1.25 normality. After filtration, the hydrolysate was neutralised and reducing sugars were determined using the 3,5-dinitrosalicylic acid (DNS) method (Miller Citation1959) by measuring absorbance at 510 nm. Figure shows the hydrolysis unit used for the present experiment.
3.2 Determination of reducing sugars
The amount of reducing sugars in the hydrolysate was estimated by the DNS method using a UV/visible spectrophotometer (UV-1700; Shimadzu) (SHIMADZU CORPORATION, Tokyo, Japan).
3.3 Fermentation
The acidic nature of the hydrolysate was adjusted to a pH of 6 by adding 2.5 M NaOH before fermentation. Media was prepared by adding 7.5 g ammonium sulphate ((NH4)2SO4), 3.5 g potassium hydrogen phosphate (KHPO4), 0.75 g magnesium sulphate (MgSO4) and 1 g calcium chloride (CaCl2·2H2O) to 500 ml of distilled water and dissolving completely. The media was autoclaved for 30 min at a temperature of 120°C and a pressure of 103.45 kN/m2 (15 psi). Figures and show the sample with the media and a rotary incubator for fermentation, respectively.
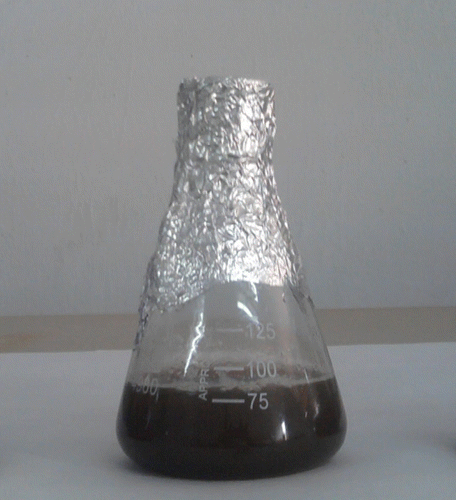
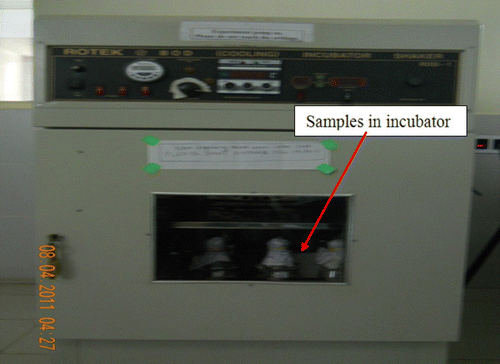
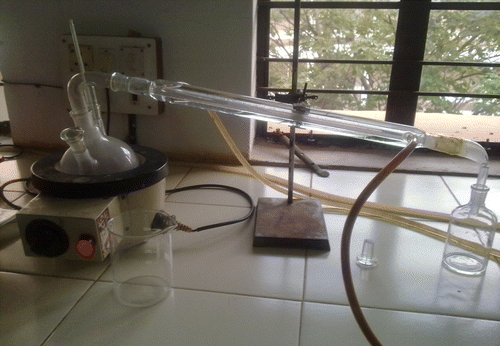
During the fermentation process, the filtrate of acid hydrolysis containing reducing sugars was taken and the media prepared was added to it before the sample was inoculated with yeast. At a maintained pH of 6, the sample was inoculated with 5% yeast (Saccharomyces cerevisiae) and kept for fermentation at 35°C for 3 days in the rotary incubator at a speed of 200 rpm. The product of fermentation (broth) was collected and the biomass separated by using a centrifuge. As shown in Figure , the supernatant was distilled to separate ethanol and then dried later. Gas chromatography (GC) of the distillate showed the presence of bioethanol.
4. Experimental set-up of an engine test rig
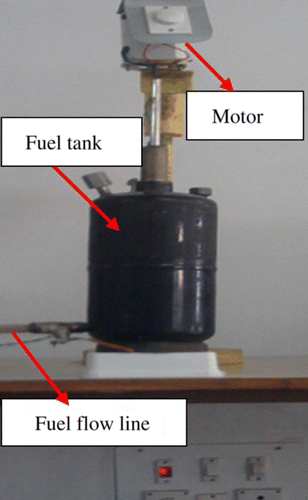
The engine tests were conducted on a single-cylinder, four-stroke, water-cooled, direct-injection CI engine, as shown in Figure . The specification of the engine is given in Table . The engine was always operated at a rated speed of 1500 rpm. The engine consisted of a conventional fuel injection system. All experiments were carried out at the rated speed of 1500 rpm at different load conditions. Injection timing and injection pressure for the diesel operation were set as specified by the engine manufacturer (23° before top dead centre (bTDC) and 205 bar). However, for the biodiesel (HOME) and bioethanol blend operation, injection timing and injection pressure were changed to 19° bTDC and 230 bar, respectively. The engine was provided with a hemispherical combustion chamber with overhead valves operated through push rods. Cooling of the engine was accomplished by circulating the water through the jackets of the engine block and cylinder head. An exhaust gas analyser and smoke meter were used to measure the emission levels of HC, CO, NOx and smoke.
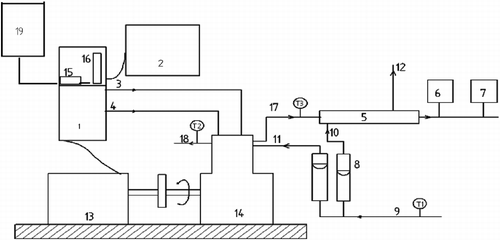
Table 3 Specification of a CI engine.
The fuel flow rate was measured on a volumetric basis using a burette and stopwatch. To prepare ethanol-blended fuels, Honge oil methyl ester and ethanol were used. The biodiesel was blended with ethanol to obtain three different fuel blends, each ranging from 0 to 15% with an increment of 5%. The homogeneity of the HOME and bioethanol mixture was ensured by placing the test tube containing the mixture above a black paper and finding that the solution was transparent without any turbidity, indicating the good miscibility of the bioethanol and HOME blend (Anand, Sharma, and Mehta Citation2011). Also, a mechanical stirrer was used to mix the HOME and bioethanol blend. Figure shows the mechanical stirrer for ensuring proper mixing to prevent phase separation. The fuel blends were prepared just before starting the experiment to ensure that the fuel mixture was homogeneous. The engine was operated using the diesel, HOME and HOME–ethanol blends at the manufactured setting only. Readings were taken only after the engine attained the stability of operation. To ensure greater accuracy, five readings were recorded and graphs were plotted after averaging the readings. The Hartridge smoke meter was used to measure the exhaust smoke density. The smoke meter works on the principle of comparative basis. A DELTA 1600 S Exhaust Gas Analyzer was used to measure the emission levels of HC, CO and NOx. It uses a non-dispersive infrared technology for measuring exhaust emissions. It consists of different sensors for measuring an individual gas and pyroelectric detectors. These detectors collect the light transmitted and thereby produce a voltage proportional to light intensity. Then, the detector output is sent to an analogue or digital converter (ADC) and then a microprocessor samples the ADC and thereby provides the data. The temperature of cooling water at exit was maintained at 70°C. The exhaust gas analyser and smoke meter were switched on and allowed to stabilise before the measurements, and these instruments were periodically calibrated.
5. Results and discussion
The present study was conducted in two phases. The first phase involves the production of ethanol from C. calothyrsus and involves the analysis of the raw material and the effect of temperature and time on glucose yield. In the second phase, a study on the performance and emission characteristics of the diesel engine was carried out.
5.1 Analysis of the raw material
The raw material and its composition were described in the previous section. The following section highlights the analysis of the raw material. Fourier transform infrared (FT-IR) spectrophotometer (Tensor 27; Bruker, Germany) and scanning electron microscope (SEM) and Hitachi S-4800 (Hitachi, Tokyo, Japan) instruments were used for the analysis.
5.1.1 FT-IR spectroscopic analysis
FT-IR spectra of the raw material in the range of 4000–500 cm− 1 were recorded before and after the hydrothermal explosion, which are shown in Figure (a),(b), respectively. The assignment of the bands for the respective functional groups is in agreement with a study published in the literature (Bodirlau, Teaca, and Spiridon Citation2009).
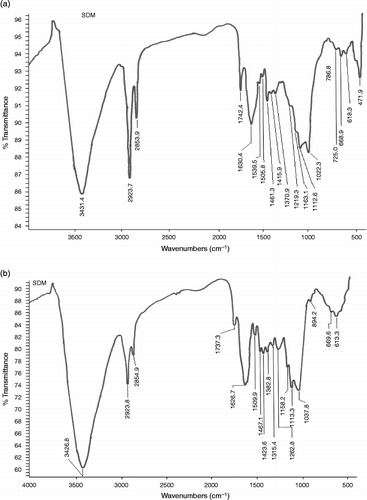
As shown in Figure (a), (b), the FT-IR band between 2800 and 2950 cm− 1 is reduced after the hydrothermal explosion, indicating the rupture of methyl and methylene groups of cellulose, lignin and extracts, and the band near 1740 cm− 1 shows the C = O stretch in the functional group of hemicellulose that is reduced slightly, indicating the solubility of hemicellulose in water at a high temperature. The band between 900 and 1200 cm− 1 shows the presence of polysaccharides. The band at 894.2 cm− 1 represents β-(1–4)glycosidic linkages and an intramolecular hydrogen bond.
5.1.2 SEM analysis
SEM analysis of the raw material was carried out before and after the hydrothermal explosion to verify structural changes in the raw material, which are shown in Figures and , respectively. The intact morphology is shown in Figure . Figure shows the rupture of C. calothyrsus. Following this rupture, there was a structural breakdown of the raw material which in turn increased its pore size after the hydrothermal treatment.
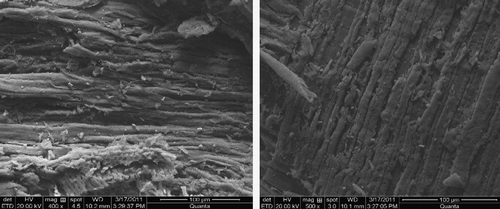
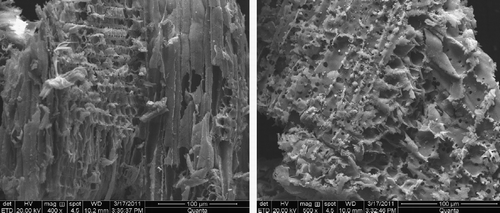
Figure shows the GC of the distillate. The results obtained by GC are shown in Table .
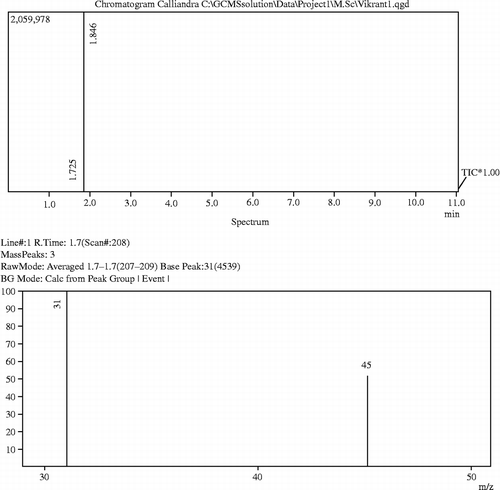
Table 4 Results of GC.
5.1.3 Effect of temperature and time on glucose yield
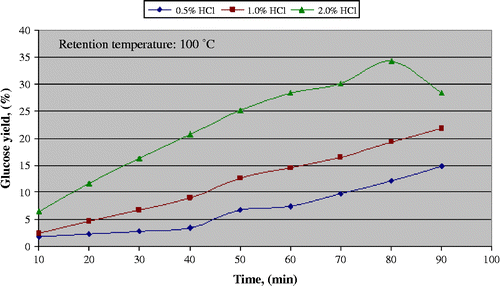
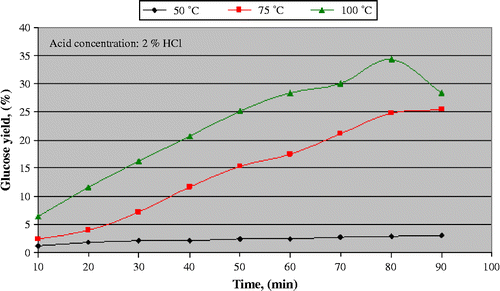
To study the effect of temperature, acid concentration and time on the conversion process, a 10% (w/v) solid content of a neat sample was used for hydrolysis. Figure shows the effect of acid concentration on the amount of glucose released. Glucose yield was strongly affected by the concentrations of HCl. At a high acid concentration, longer residence time and high temperature, it was observed that glucose yield decreased sharply due to the deformation of sugar to hydroxylmethylfurfural. Figure shows the effect of temperature and time on glucose yield. The temperature and time varied in the range of 50–100°C and 0–90 min, respectively, keeping 2% HCl concentration constant. Increasing the hydrolysis temperature significantly affected glucose yield. The mild treatment condition at 50°C and 0.5% HCl concentration did not provide good glucose yield. This could be related to the lower breaking of glucosidic bonds. A high hydrolysis yield of 34.3% was achieved at 100°C temperature, 2% acid concentration and 80 min residence time. With increased severity of hydrolysis treatment, glucose yield was found to increase slightly due to the high conversion of the cellulose fraction into glucose.
5.2 Performance and emission characteristics of the diesel engine
The experiments were conducted on a single-cylinder, four-stroke, water-cooled direct-injection CI engine. The fuels used for the engine operation are diesel, HOME and HOME–ethanol blends in the range of 0–15% with an increment of 5%. The results obtained from the HOME and HOME–ethanol blends were compared with a neat diesel fuel mode of operation.
5.2.1 Performance characteristics
The variation in brake thermal efficiency with brake power at entire load conditions for the diesel, HOME and HOME–ethanol blends is shown in Figure . The brake thermal efficiency with diesel operation was higher than the other fuels tested. This is mainly due to a lower heating value, a low volatility and an improper spray pattern with HOME and the presence of fatty acids in the HOME and HOME–ethanol blends.
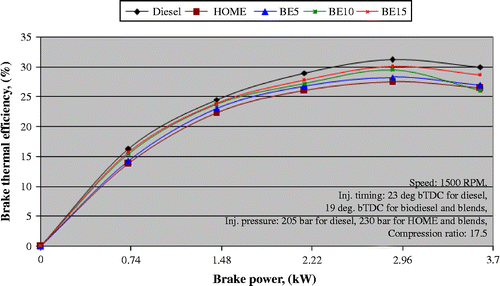
However, the brake thermal efficiency for the HOME–ethanol blends was slightly improved compared with the neat HOME operation. This could be attributed to the characteristic of a higher latent heat of vaporisation of ethanol and the ethanol content in a blend improves the spray pattern. Hence, this factor leads to increased brake thermal efficiency compared with the HOME operation. Combustion is more complete in the fuel-rich zone due to the presence of oxygen in the ethanol-blended fuels. This leads to an enhanced combustion efficiency and decreased heat losses in the cylinder due to the flame temperature of the ethanol-blended fuels being lower than that of the neat biodiesel. Brake thermal efficiencies at the 80% load condition for the diesel, HOME, BE5, BE10 and BE15 blends were found to be 31.5, 27.5, 28.2, 29.5 and 30.1%, respectively.
5.2.2 Emission characteristics
5.2.2.1 Smoke opacity
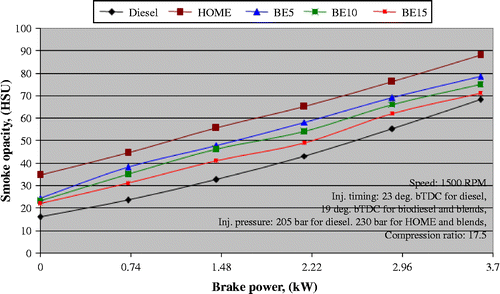
The variation in smoke opacity with brake power from 0 to 100% load conditions for the diesel, HOME and HOME–ethanol blends is shown in Figure . The smoke emission for the neat HOME operation was slightly higher than that for the diesel fuel mode of operation. This could be attributed to the presence of free fatty acids with a heavier molecular weight in HOME and incomplete combustion due to a higher viscosity compared with the fossil diesel fuel. However, a lower smoke opacity was observed as in the case of the HOME–ethanol blends. This could be attributed to a better spray pattern and a reduced volatility of the HOME–ethanol blend that leads to better combustion when compared with the neat biodiesel alone. It was also observed that smoke emission was decreased to a little higher extent with an increase in ethanol content in the HOME–ethanol blend. The values of smoke opacity for the HOME, BE5, BE10 and BE15 blends at the 80% load condition were found to be 76, 69, 66 and 62 HSU compared with the smoke opacity value of 55 HSU for the diesel operation, respectively.
5.2.2.2 HC and carbon monoxide (CO) emissions
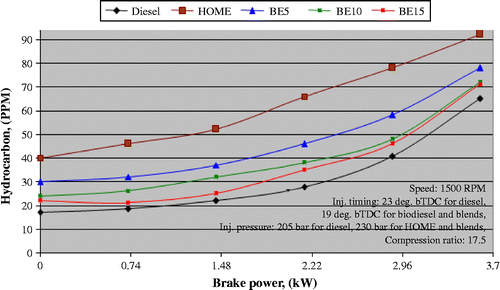
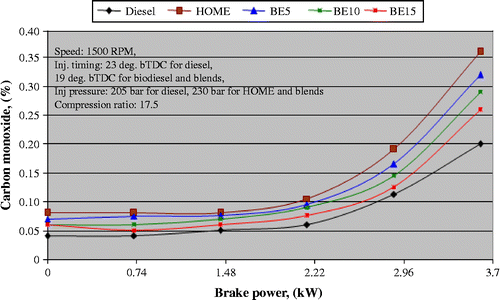
The variation in HC and CO emissions with brake power from 0 to 100% load conditions for the diesel, HOME and HOME–ethanol blends is shown in Figures and , respectively. The HC and CO emissions for the neat HOME operation were found to be slightly higher than those for the fossil diesel fuel. This slight increase is due to the higher viscosity of HOME that leads to the formation of larger droplets in a spray pattern, and as a result it becomes very difficult to burn within a short combustion time. This feature results in higher HC and CO emissions due to incomplete combustion. However, for the HOME–ethanol blend, the HC and CO emissions were reduced because of improved combustion due to reduced viscosity and improved volatility. Furthermore, in a literature, it has been indicated that as ethanol molecules are polar, which cannot be absorbed easily by a non-polar molecule in the lubricating oil layer, it is possible that ethanol can lower HC emissions (Lapuerta, Armas, and Herreros Citation2008). It was observed that both HC and CO emissions were reduced with an increase in ethanol concentration in the blend at a high load condition. The HC emission levels at the 80% load condition for the HOME, BE5, BE10 and BE15 blends were 78, 58, 48 and 46 ppm, respectively, compared with the emission level of 40.5 ppm for the diesel operation. Similarly, the CO emission levels at the 80% load condition for the diesel, HOME, BE5, BE10 and BE15 blends were found to be 0.1125, 0.19, 0.165, 0.145 and 0.098%, respectively.
5.2.2.3 Nitrogen oxide (NOx) emissions
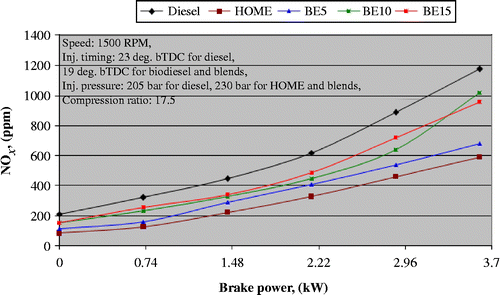
The variation in NOx emissions with brake power from 0 to 100% load conditions for the diesel, HOME and HOME–ethanol blends is shown in Figure . The experimental results indicate that the NOx emission levels were nearly the same at lower load conditions. However, the emission levels increased slightly at higher load conditions. The NOx emission level for the HOME operation was found to be lower than that for the fossil diesel fuel. This reduction clearly indicates the lower peak pressure developed inside the engine cylinder, due to a lower heating value and a higher viscosity of HOME. Studies have indicated that lower NOx levels for HOME is mainly due to a lower heat release during the premixed combustion phase compared with the diffusion combustion phase. However, for the HOME–ethanol blends, the NOx level increased slightly higher than that for the neat HOME operation. This slight increase could be due to the decreased volatility of the blend that leads to better combustion. The NOx emission levels at the 80% load condition for the HOME, BE5, BE10 and BE15 blends were found to be 460, 540, 641 and 720 ppm compared with the emission level of 890 ppm for the diesel operation, respectively.
6. Conclusions
The following conclusions were made on the basis of the results obtained from the present study:
Physico-chemical properties of C. calothyrsus were found to be different after the hydrothermal explosion.
FT-IR spectra revealed that after the hydrothermal explosion, the pore size and specific surface area of the raw material increased from its initial biomass, and there was partial solubility of hemicellulose and lignin in hot water at 145°C.
Microscopy studies showed that due to the hydrothermal explosion, the fibrous polymer matrix was broken down at a pressure of 5 kg/cm2.
The optimum parameters for bioethanol production from C. calothyrsus were found to be 2% HCl, 100°C temperature and 80 min retention time, with a glucose yield of 34.4%.
The CI engine can be operated conveniently with the any lower proportion of ethanol (up to 15%) in a HOME (HOME–ethanol blend) without any major engine modifications. However, higher proportion may lead to problems such as corrosion of engine components, blocking of fuel flow lines etc after long run. Studies have indicated that a higher ethanol content in a blend mixture leads to knocking.
The experimental investigations showed a 3–4% decrease in brake thermal efficiency with an 8–10% increase in HC and CO emission levels and a 15–18% decrease in nitric oxide emission levels for the HOME–ethanol-blended operation compared with the neat diesel fuel mode of operation.
For HOME–ethanol-blended fuels, the addition of a small quantity of bioethanol in the HOME operation improved engine performance.
REFERENCES
- Anand, K., R. P.Sharma, and P. S.Mehta. 2011. “Experimental Investigations on Combustion, Performance and Emissions Characteristics of Neat Karanji Biodiesel and its Methanol Blend in a Diesel Engine.” Biomass and Bioenergy35: 533–541.
- Banapurmath, N. R., P. G.Tewari, and R. S.Hosmath. 2008. “Performance and Emission Characteristics of a DI Compression Ignition Engine Operated on Honge, Jatropha and Sesame Oil Methyl Esters.” Renewable Energy33 (9): 1982–1988.
- Banapurmath, N. R., P. G.Tewari, and V. S.Yaliwal. 2010. Fuel Efficiency: Improving Fuel Efficiency of Compression Ignition Engines Fuelled with Vegetable Oil, 2–36. USA: Nova Science Publishers, Inc. ISBN: 978-1-61122-194-7.
- Bjerre, A. B., A. B.Olesen, T.Fernqvist, A.Ploger, and A. S.Schmidt. 1996. “Pretreatment of Wheat Straw Using Combined Wet Oxidation and Alkaline Hydrolysis Resulting in Convertible Cellulose and Hemicellulose.” Biotechnology and Bioenergy49 (5): 568–577.
- Bodirlau, Ruxanda, Carmen AliceTeaca, and IulianaSpiridon. 2009. “Preparation and Characterization of Composites Comprising Modified Hardwood and Wood Polymers.” Bioresources4 (4): 1285–1304.
- Chen, H., S.Shuai, and J.Wang. 2007. “Study on Combustion Characteristics and PM Emission of Diesel Engines Using Ester–Ethanol–Diesel Blended Fuels.” Proceedings of the Combustion Institute31 (2): 2981–2989.
- Corkwell, K. C., M. M.Jackson, and D. T.Daly. 2003. “Review of Exhaust Emissions of Compression Ignition Engines Operating on E Diesel Fuel Blends.” Society of Automotive Engineers. Paper No: 2003-01-3283.
- Demirbas, Ayhan. 2009. “Progress and Recent Trends in Biofuels.” Energy Conversion and Management50: 14–34.
- Dien, B. S., X. L.Li, L. B.Iten, D. B.Jordan, N. N.Nichols, O.Bryan, and M. A.Cotta. 2006. “Enzymatic Saccharification of Hot-Water Pretreated Corn Fiber for Production of Monosaccharides.” Enzyme and Microbial Technology39 (5): 1137–1144.
- Goering, H. K., and P. J.Van Soest. 1970. “Forage Fiber Analysis (Apparatus, Reagents, Prosedures and some Applications).” United States Department of Agriculture (USDA) Agricultural Handbook No.379: 20.
- Hansen, A. C., Q.Zhang, and P. W. L.Lyne. 2005. “Ethanol–Diesel Fuel Blends – A Review.” Bioresource Technology96 (3): 277–285.
- Hayes, T. K., L. D.Savage, R. A.White, and S. C.Sorenson. 1988. “The Effect of Fumigation of Different Ethanol Proofs on a Turbocharged Diesel Engine.” Society of Automotive Engineers. Paper No. 880497.
- Holtzapple, M. T., J. H.Jun, G.Ashok, S. L.Patibandla, and B. E.Dale. 1991. “The Ammonia Freeze Explosion (AFEX) process – A Practical Lignocellulose Pretreatment.” Applied Biochemistry and Biotechnology28/29: 59–74. http://www. Svleve.com/karanj.htm.
- Howard, R.2003. “Lignocellulose Biotechnology: Issues of Bioconversion and Enzyme Production.” African Journal of Biotechnology2: 602–619.
- Inderwildi, O. R., and D. A.King. 2009. “Quo Vadis Biofuels.” Energy and Environmental Science2: 343–346, 10.1039/B822951C.
- International Energy Agency. 2006. “World Energy Outlook.” 1–8.
- Lapuerta, Magín, OctavioArmas, and José M.Herreros. 2008. “Emissions from a Diesel–Bioethanol Blend in an Automotive Diesel Engine.” Fuel87: 25–31.
- Laser, M., D.Schulman, S. G.Allen, J.Lichwa, M. J.Antal, and L. R.Lynd. 2002. “Comparison of Liquid Hot Water and Steam Pretreatments of Sugar Cane Bagasse for Bioconversion to Ethanol.” Bioresource Technology81 (1): 33–44.
- Li, De-gang, HuangZhen, LuXingcai, and YangJian-guang. 2005. “Physicochemical Properties of Ethanol Diesel Blend Fuels on Performance and Emission of Diesel Engine.” International Journal of Renewable Energy30 (6): 967–976.
- Likos, B., T. J.Callahan, and C. A.Moses. 1982. “Performance and Emissions of Ethanol and Ethanol–Diesel Blends in Direct-Injected and Pre-chamber Diesel Engines.” Society of Automotive Engineers, Paper No: 821039.
- Liu, C., and C. E.Wyman. 2005. “Partial Flow of Compressed-Hot Water Through Corn Stover to Enhance Hemicellulose Sugar Recovery and Enzymatic Digestibility of Cellulose.” Bioresource Technology96: 1978–1985.
- Meiring, P., A. C.Hansen, A. P.Vosloo, and P. W. L.Lyne. 1983, Paper No: 831360 “High Concentration Ethanol–Diesel Blends for Compression–Ignition Engines.” Society of Automotive Engineers.
- Miller, G. L.1959. “Use of Dinitrosalicylic Acid Reagent for Determination of Reducing Sugar.” Anal. Chem. 31: 426–428.
- Mosier, N., C.Wyman, B.Dale, R.Elander, Y. Y.Lee, M.Holtzapple, and M.Ladisch. 2005. “Features of Promising Technologies for Pretreatment of Lignocellulosic Biomass.” Bioresource Technology96 (6): 673–686.
- Muralidharan, M., P. Mathew, SumitRoy Thariyan, J. P. Subrahmanyam, and P. M. V. Subbarao. 2004. “Use of Pongamia Biodiesel in CI Engines for Rural Application.” 3rd International Conference on Automotive and Fuel Technology, Society of Automotive Engineers. Paper No. 2004-28-0030, New Delhi, 1–8, January 16–18.
- Murugesan, A., C.Umarani, R.Subramanian, and N.Nedunchezhian. 2009. “Bio-diesel as an Alternative Fuel for Diesel Engines – A Review.” Renewable and Sustainable Energy Reviews13 (3): 653–662.
- Noguchi, N., H.Terao, and C.Sakata. 1996. “Performance Improvement by Control of Flow Rates and Diesel Injection Timing on Dual-Fuel Engine with Ethanol.” Bio-resource Technology56 (1): 35–39.
- Park, S. H., S. H.Yoon, H. K.Suh, and C. S.Lee. 2008. “Effect of the Temperature Variation on Properties of Biodiesel and Biodiesel–Ethanol Blend Fuels.” Oil and Gas Science and Technology- Review , IFP63 (6): 737–745.
- Pérez, J. A., I.Ballesteros, M.Ballesteros, F.Saez, M. J.Negro, and P.Manzanares. 2008. “Optimizing Liquid Hot Water Pretreatment Conditions to Enhance Sugar Recovery from Wheat Straw for Fuel–Ethanol Production.” Fuel87: 3640–3647.
- Poetsch, Jens, and Wolfgang Lück. 2003. “Land Rehabilitation for Food and Energy Production – A Synergy Policy for the Tropics.” Technological and Institutional Innovations for Sustainable Rural Development. 2003. Deutscher Tropentag, Gottingen. October 8–10.
- Sayin, Cenk, and MustafaCanakci. 2009. “Effects of Injection Timing on the Engine Performance and Exhaust Emissions of a Dual-Fuel Diesel Engine.” Energy Conversion and Management50 (1): 203–213.
- Shropshire, G. J., and C. E.Goering. 1982. “Ethanol Injection into a Diesel Engine.” Trans ASAE25 (3): 570–575.
- Srivastav, P. K., and M.Verma. 2008. “Methyl Ester of Karanja Oil as an Alternative Renewable Sources of Energy.” Fuel87: 1673–1677.
- Stage de Caro, P., Z.Mouloungui, G.Vaitilingom, and J. C.Berge. 2001. “Interest of Combining an Additive with Diesel–Ethanol Blends for Use in Diesel Engines.” Fuel80 (4): 565–574.
- Taherzadeh, M. J., and K.Karimi. 2008. “Pretreatment of Lignocellulosic Wastes to Improve Ethanol and Biogas Production – A Review.” International Journal of Molecular Science9 (9): 1621–1651.
- Wyman, C. E.2003. “Potential Synergies and Challenges in Refining Cellulosic Biomass to Fuels, Chemicals, and Power.” Biotechnology Progress19: 254–262.
- Xingcai, Z. H., Z.Wugau, and L.Degang. 2004. “The Influence of Ethanol Additives on the Performance and Combustion Characteristics of Diesel Engine.” Journal of Combust Sci Technol176 (8): 1309–1329.
