
Abstract
Carbon dioxide (CO2) emission has drawn a great attention in recent years all over the world, and it plays a very important role in the process of global warming. The off-road equipment, which includes construction equipment, accounted for 7.5% emission of CO2. The objective of this article is to propose a groundwork for a methodology that can be used to estimate the total fuel use and CO2 emissions from construction equipment activities based on its productivity rate. Currently, there is not a methodology or technique for estimating productivity, fuel use and emissions at once. The multiple linear regression analysis has successfully modelled the productivity rate and good to be used as a benchmark for estimating fuel use and CO2 emissions from various types of construction equipment performing earthwork activities. The proposed methodology will help the contractor to estimate the total expected pollutant emissions for the project, which would be valuable information for a preliminary environmental assessment of the project. By using construction plans and specifications, the methodology and tool presented in this research can be used to estimate cost, fuel use and emissions from commercial, residential, industrial or heavy highway. By the proposed approach, it is possible to develop new fuel use and emissions inventories for construction industry in general.
1. Introduction
According to the US Environmental Protection Agency (EPA) report 2007, construction industry has produced approximately 1.7% of total greenhouse gas (GHG) emissions. Equivalent to 6% of total US industrial-related GHG emissions, this quantity places construction as one of the top emitting sectors (EPA Citation2007b). Although construction practices typically do not produce large quantities of GHG compared with the operations of many other sectors, the sheer number of construction projects results in significant aggregate emissions for the sector. The Sector Strategies Division of EPA recently released the report which presents historical emissions estimates for 14 industrial sectors that produces 84% of industrial GHG emissions in the USA. According to this report, the construction sector produced 6% of total US industrial GHG emissions in 2002. CO2 emission has drawn a great awareness in recent years all over the world, and it plays a very important role in the global warming. According to EPA, the on-road vehicles released 92.5% of the total CO2 emission, while the off-road equipment, which includes construction equipment, accounted for the remaining 7.5% emission of CO2. Among this 7.5%, the construction equipment accounted for 40%, which is very severe (EPA Citation2007a).
Currently, most construction estimators are able to estimate the costs related to construction equipment and its activities that they perform. However, most construction estimators seldom concerned themselves with the fuel consumption and emissions from the equipment that they used (Lewis and Hajji Citation2012b). Since some new environmental regulations appear on the practices of other industries, construction professionals can no longer disregard the issues of energy use and emissions aspects of their works. They need a methodology that can be used with their current expertise to help them quantify the total fuel use and emissions of the construction equipment activities. The objective of this article is to propose a groundwork for a methodology that can be used to estimate the total fuel use and CO2 emissions from construction equipment activities. This methodology can be used along with other common estimating approaches to gain an overall understanding of the fuel and emissions footprint for construction activities and ultimately an entire project. This proposed methodology can also be developed into a stand-alone model, or into a module that can be used collaboratively with other existing estimators.
2. Related studies
Productivity (P) is simply defined as the ratio of the quantity (Q) of work completed to the duration (D) of time that it took to complete the work (Lewis and Hajji Citation2012a). For construction equipment activity, if a bulldozer hauls 1000 bank cubic yards (bcy) of earth in 10 hours (h), the productivity rate is 100 bcy/h. This ratio also reveals that the duration of a construction equipment activity is inversely proportional to productivity – as productivity decreases, the activity duration increases. When the duration increases, it will result in higher fuel consumption and higher emissions. Thus, it is necessary to predict the productivity rates of the construction equipment in order to estimate its emissions. To predict productivity rates of the construction equipment, this article uses multiple linear regression (MLR) analysis. MLR analysis is a powerful tool that provides a simple method for establishing a functional relationship between predictor and response variables. It has been used frequently to conduct construction-related studies (Akinsola Citation1997; Akintoye and Skitmore Citation1994; Edwards, Holt, and Harris Citation2000). Furthermore, the use of deterministic MLR analysis is well established in construction engineering research, particularly in predicting productivity (David and Gary Citation1993; Dunlop and Smith Citation2003; Han and Halpin Citation2005; Ok and Sinha Citation2006; Smith Citation1999). In this article, MLR is used to determine the statistical relationship between productivity rate as response variables, and construction equipment working attributes, such as engine horsepower (hp), distance and soil types as explanatory variables.
Many models and methods have been developed to quantify the CO2 emission from construction equipment. The state government of California has developed California Air Resources Board (CARB) OFFROAD2007 Model. OFFROAD2007 emission model consists of three main modules: population, activity and emissions factor (CARB Citation2007). These three modules are combined to yield the annual equipment emissions by county, air basin or state. Emission inventories obtained from this model are produced with respect to fuel type (e.g. gasoline, diesel, compressed natural gas), engine type (e.g. two-stroke vs. four-stroke), equipment category and horsepower group. The emissions (tons/day) inventory is calculated by taking the product of maximum rated average horsepower, load factor, annual activity, emission factor and engine population. The CARB also developed an EMission FACtors (EMFAC) model to calculate emission rates from all motor vehicles, such as passenger cars to heavy-duty trucks, operating on highways, freeways and local roads in California (CARB Citation2003). An emission inventory can be summarized as the ‘product of an emission rate (e.g. grams per pollutant emitted over a mile) and vehicle activity (e.g. miles driven per day)’. The model calculates emission factors and emission inventories for the following primary pollutants: hydrocarbons (HCs), carbon monoxide, nitrogen oxides (NOx), carbon dioxide (CO2), particulate matter (PM), fuel consumption, oxides of sulphur (SOx) and lead. Li and Lei (Citation2010) proposed the implementation of discrete-event simulation (DES) in estimating and analysing CO2 emission for earthwork construction activities. This method estimates emissions from individual project-specific construction at micro-level and includes three modules: module 1, to calculate the emission factors of CO2 from the EPA model; module 2, to use DES to calculate the duration of earthmoving process and module 3, to calculate the total amount of CO2 emission by using duration and emission factors. Ammouri, Srour, and Hamade (Citation2011) proposed the Carbon Footprint Calculation for Construction Projects. This calculator is capable of estimating the total carbon footprint of a construction project taking into consideration the size, landscape and materials. The calculator can be localized to any market based on the database of materials and equipment. It takes project inputs from nine different categories: general project information, site works, concrete works, metal works, wood works, windows and doors, finishes, mechanical works and electrical works. The total carbon from an observed work is embodied in the raw material, transportation carbon footprint and workforce carbon footprint.
Although there are some existing methodologies and techniques that estimate emissions from construction equipment, these tools typically do not address its important relationship with productivity rate and total fuel use. Conversely, most construction productivity estimating models accurately address the productivity aspects of construction equipment, but do not address the issues of energy use and emissions. There currently is not a methodology or technique for estimating productivity, fuel use and emissions at once.
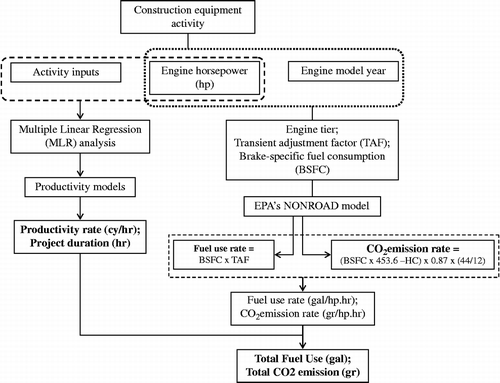
3. Methodology
The proposed estimating tool is developed by combining the productivity rate model from a reliable construction estimating data sources and the calculation algorithm employed by the EPA's NONROAD model (Figure ). In order to develop productivity models, simple earthwork activities involving bulldozer, excavator and dump truck were selected. The data for these activities were collected from RSMeans Heavy Construction Data 2011. This is parts of RSMeans estimating references, which is widely accepted and used by most construction professionals. These data provide technical information required for preparing quantity takeoffs and complete construction estimates for major construction projects (RSMeans Citation2011). It helps design and construction professionals to compare the estimates of design alternatives, perform cost analysis and value engineering and review estimates quotes and change orders prepared by others.
The data also include information in sizing, productivity, equipment requirements, design standards and engineering factors – all organized according to the latest 2004 Construction Specification Institute Master Format classification system, which has 48 divisions ranging from General Requirements to Electrical Power Generation. The selected activities are provided in RSMeans data on Division 31: ‘Earthwork’. This division has sections representing major earthwork activities: clearing and grubbing, tree and shrub removal and trimming, stripping and stockpiling, grading, excavation and fill, erosion and sedimentation controls, soil treatment and stabilization, shoring, underpinning, dams and tunnel construction. Bulldozer activities are provided in section 31.23.16.46, excavator in section 31.23.16.13 and dump truck in section 31.23.23.20. The activity input data for these three types of equipment are shown in Table .
Table 1 Activity input of selected construction equipment.
Based on the data from RSMeans, the productivity rate models were developed by using MLR. The MLR model is written as follows:
In this article, MLR is used to determine the statistical relationship between a response (productivity rate) and the explanatory variables in construction equipment activities. The response variable is expressed in terms of loose cubic yard per hour (lcy/h) as productivity rate.
The productivity models in this article were built by using stepwise regression selection method and validated by using data splitting method. In data splitting method, the original data-sets are split into a model-building set and a validation set (Kutner, Nachtsheim, and Neter Citation2005). If the number of data is within 6–10 times the number of predictor variables, it is enough for making an equal data split. If the entire data are not large enough under these circumstances, the validation set will need to be smaller than the model building data-set. The model-building set is used to develop the model. The validation set is used to evaluate the reasonableness and predictive ability of the selected model. A means of measuring the actual predictive ability is to use the model to predict each case in the validation data-set and then to calculate the mean of the squared prediction errors, denoted by MSPR or mean squared prediction error. The MSPR is calculated as:
If the MSPR is fairly close to the mean squared errors (MSE) based on the regression fit to the model-building data-set, then MSE for the selected regression model is not seriously biased and gives an appropriate indication of the predictive ability of the model.
The other information such as rated engine horsepower (hp) and engine model year will be used to estimate the fuel use and CO2 emission rates. It needs the brake-specific fuel consumption (BSFC) factor (Table ). This factor is an approximation of amount of fuel consumed by a particular type of equipment during a unit of use. The BSFC for this estimation was based on the calculation algorithm used by the EPA's NONROAD model (EPA Citation2010). BSFC is reported in pounds per horsepower-hour (lbs/hp-h). The EPA assumes a constant BSFC for each engine tier within a specified engine horsepower range, without regard for the cycle being performed. Assuming a constant fuel consumption rate for all engine tiers may make the calculation of emission rates easier, but may not be a good representative of actual working conditions (EPA Citation2010). This factor used by NONROAD is based on engine dynamometer test data and adjusted accordingly to account for in-use operation that differs from the typical test conditions.
Table 2 Steady-state BSFC for nonroad diesel engines.
Nonroad engines are mainly tested during steady-state condition. However, the steady-state condition typically used for emission testing is not necessarily representative of the operation of engines in many nonroad applications. Some of the disparities can happen due to engine load, engine speed or transient demands. Transient adjustment factors (TAFs) are applied to Tier 0, Tier 1, Tier 2 and Tier 3 BSFC factors. Transient control is expected to be an integral part of all Tier 4 engine design considerations (EPA Citation2010).
The tier level is the emission standard that corresponds to the equipment model years and technology types (represented by engine horsepower) (EPA Citation2001). EPA has regulated emissions from nonroad engines used in most construction and port cargo handling equipment since 1999. As shown in Table , these regulations continue to be phased in under a four-tier system, with emission standards based on engine horsepower (hp) and equipment model year.
Table 3 General guide to EPA tier level for off-road diesel engines (EPA Citation2010).
Tiers 1–3 standards are largely being met by enhanced engine design and manufacturing improvements; they require little or no exhaust after-treatment, and do not address fuels. The Tier 4 standards require dramatic reduction in NOx and PM emissions. The off-road NOx and PM standards under Tier 4 are approximately 10 times lower than the Tier 3 standards for most engines. They will be phased in between 2008 and 2015. To comply with this rule, engine manufacturers will need to produce engines with advanced emissions control technologies similar to those that will be used for on-road trucks. This rule also requires fuel producers to reduce the sulphur content of diesel fuel used in nonroad engines. Reducing the level of sulphur in diesel fuel is necessary to prevent damage to emission control systems.
The calculation of fuel use rate using BSFC is as follows:
4. Results and discussion
The MLR approach was successful in providing model for predicting the productivity rate of the bulldozer, excavator and dump truck activities. Based on the value of R2, the MLR equation for predicting productivity rates can adequately explain the variability of the data. With α = 0.05, all parameters (excluding the intercept) in the models had p-values < 0.0001 and were statistically significant to be included in the models. For bulldozer, in the result of original regression function, it was found that the plot of residuals against the predicted values showed evidence of unequal variance. The unequal error variances and non-normality of the error terms frequently appear together. To remedy the non-normality in the data, a Box–Cox analysis has been conducted and the result recommended that the best lambda (λ) for transforming the response variables (Y) is 0.2. Thus, for bulldozer the form of transformed regression function for productivity can be written as:
The overall results of MLR analysis and validation results of productivity models for bulldozer, excavator and dump truck are shown in Table .
Table 4 Validation results of productivity models.
Because all data-sets were large, the model was also validated by using cross-validation procedure or data splitting. As shown in Table , the MSPR from the productivity model are fairly close to the MSE based on the regression fit to the model-building data-set. The MSE for the regression models of productivity rate used here are not seriously biased and give an appropriate indication of the predictive ability of the model. The MLR analysis results of productivity models for bulldozer, excavator and dump truck are shown in Table .
Table 5 MLR results for productivity models of three equipments.
Concerning the types of excavator, since the p-values of type of excavator are bigger than α = 0.05, it can be concluded that different types of excavation do not significantly lead to different rates of productivity. However, since the type of excavator is categorical variable, it can be used to represent the categories of a qualitative explanatory variable in the regression model.
The overall calculation formula for obtaining the total fuel use and CO2 emissions estimates are formed by combining the productivity rate models with calculation algorithm of the NONROAD model. In order to estimate the fuel use and CO2 emissions from a certain quantity of soil performed by a bulldozer, or an excavator or a dump truck, the total duration of activity is needed. The total duration in hours (h) can be obtained by dividing the total soil quantity with the productivity rate in loose-cubic yard per hour (lcy/h). Once the total duration is obtained and engine horsepower (hp) is known, the total emission in grams (g) and total fuel use (gal) can be calculated by multiplying the CO2 emission rates (g/hp-h) or the BSFC (gal/hp-h) from NONROAD with horsepower (hp) and duration (h).
Table 6 Productivity-based total fuel use models.
The model showed the results that the productivity rate is 156.34 cy/h or equals to 2.84 h of total duration to complete the trench. The excavator is categorized in Tier 2 engine and has the BSFC of 0.367 lbs/hp-h and TAF of 1.01. To complete digging the trench, the excavator needs 50.53 gal of fuel. The sample case for truck is presented as a 30 cy off-road truck has to haul 1000 cy of soil in 1 mile. The truck has 535 hp – model year 2003 with 10 mph of average hauling speed. The truck needs 15 min on average to load and dump the soil. The truck capacity, average speed, hauling distance and load–dump time are utilized to determine the productivity rate, while engine size and model year will define the engine tier level, BSFC and TAF. The fuel use model showed the results that the truck has productivity of 83.54 cy/h or needs 11.97 h to haul all soil quantity. Since the engine is categorized as Tier 2, the truck has BSFC of 0.367 lbs/hp-h and TAF of 1.01. To complete the task, the truck needs 284.85 gal of fuel in total.
By using the basic formula in (8) and (9), the overall calculation formulas for obtaining the total CO2 emissions of each type of equipment are shown in Table . To demonstrate the CO2 emission model for bulldozer, a case is presented where a 150 hp of bulldozer model year 2003 has to haul 1000 cy of common earth in the distance of 300 ft. The result showed that the estimated productivity of this bulldozer is 20.02 cy/h and can approximately complete the job in 49.94 h. Based on the engine size and model year, this bulldozer is categorized in Tier 2 engine level. This engine also has 0.367 lbs/hp-h of BSFC. When completing the job, this bulldozer was estimated to emit 3.4 tons of CO2. To demonstrate the model for estimating total CO2 emissions from excavator, a case of a 400 hp – model year 2003 excavator is presented. The excavator has to dig a 100 ft long – 10 ft wide – 12 ft deep trench in sand–gravel soil with its 3 cy bucket.
Table 7 Productivity-based total CO2 emission models.
The results showed that the excavator has the productivity rate of 156.34 cy/h or needs 2.84 h to complete digging the trench. Based on the horsepower and model year, the engine is categorized as Tier 2 engine and has 0.367 lbs/hp-h of BSFC. When finishing the trench, this excavator released 0.5 tons of CO2. To illustrate CO2 emission models for truck, a simple case is presented as follows: a 535 hp – model year 2003 truck is used to haul 1000 cy of soil in 1 mile of distance. The truck has 30 cy of loading capacity with average hauling speed of 10 mph. For loading and dumping the soil, the truck needs 15 min in average. The estimated productivity rate of this truck is 83.54 cy/h, and for hauling 1000 cy of soil, the truck needs 11.97 h. Based on the horsepower and model year, the truck is categorized as Tier 2 engine with 0.367 lbs/hp-h of BSFC. When the job is completed, the truck released 2.9 tons of CO2.
5. Sensitivity analysis
Sensitivity analysis is conducted to analyse the effect of changes in explanatory variables against the output: total fuel use and CO2 emissions. The analyses are useful to understand the environmental impact of a certain earthwork activity performed by construction equipment in different set of conditions.
The sensitivity analysis for bulldozer are constructed by two different work conditions: first, as shown in Table , bulldozer has to haul 1000 cy of soil in 300 ft of distance, using various size of engine and all types of soil; second, as shown in Table , 564 hp bulldozer – model year 2003, has to haul 1000 cy of all type of soil in various distances. Based on the information in Tables 8 and 9, there is an inverse relationship between productivity rate and the fuel use and CO2 emissions; that is, as the productivity rate decreases, the fuel use and emissions increase. The productivity rate also decreases with the dozing resistance based on soil type; sand–gravel has the highest productivity rate whereas clay has the lowest. Likewise, all the emissions increase as the soil resistance increases. Furthermore, for a specific soil type, the productivity rate increases as engine size increases, and decreases as the dozing distance increases. In general, Table shows the inverse relationship between engine size and total fuel use and CO2 emissions; that is, for all types of soil, as the bulldozer uses bigger size of engine or bigger rated horsepower, the emissions become lower. There is little difference in fuel use and CO2 emissions for sand–gravel, sandy clay–loam and common earth. The soil type with the highest estimated total emissions based on engine size is clay.
Table 8 Bulldozer – model year 2003; 300 ft distance; 1000 cy soil.
Table 9 Bulldozer – 564 hp; model year 2003; 1000 cy soil.
Table shows the emissions impact of the bulldozer activity based on the dozing distance. For each soil type, the estimated productivity decreases as the dozing distance increases. The estimated productivity has relatively the same shape for all types of soil, with little difference of productivity for sand–gravel, sandy clay–loam and common earth. Again, clay gives the lowest estimated productivity for the bulldozer activity based on dozing distance. Table also shows the emissions impact of the bulldozer activity based on dozing distance. There are positive relationship between dozing distance and the fuel use and CO2 emission; that is, for all types of soil, as the bulldozer has to haul longer distance, the emissions become higher. For all types of soil, Table displays that clay gives the bulldozer the highest fuel use and CO2 emissions based on dozing distance.
The sensitivity analysis for excavator is applied in two different work scenarios: first, a 400 hp – model year 2003 excavator has to dig 100 ft long – 10 ft wide trench in various depth, using 3 cy of bucket size on all types of soil; second, the same excavator with various size of bucket has to dig 100 ft long – 10 ft wide – 12 ft deep trench on all types of soil as well. Based on the information in Table and Table , there is an inverse relationship between productivity rate and the emissions; that is, as the productivity rate decreases, the emissions increase. The productivity rate also decreases with the digging resistance based on soil type; sand–gravel has the highest productivity rate whereas clay has the lowest. Likewise, although with very little difference, the fuel use and CO2 emissions increase as the soil resistance increases. Furthermore, for a specific soil type, the productivity rate increases as bucket size increases, and decreases as the trench depth increases. For all types of soil, the fuel use and CO2 emissions increase as the trench depth increases. As the excavator digs a trench not deeper than 12 ft, the estimated emissions for all types of soil are about the same (Table ). Although the fuel use and CO2 emissions from all types of soil began to vary when the trench went deeper than 12 ft, particularly for hard clay and common earth, the overall estimated CO2 emissions are considered the same.
Table 10 Excavator – 400 hp; model year 2003; trench: 100 ft long – 10 ft wide; 3 cy bucket size.
Table 11 Excavator – 400 hp; model year 2003; trench: 100 ft long – 10 ft wide – 12 ft deep.
The fuel use and CO2 emissions from excavator activity based on its bucket size are presented in Table . The estimated emissions decrease dramatically while excavator digs the trench with bucket size less than 1.50 cy. In this range of bucket size, clay has the highest emissions, while sand–gravel and sandy clay–loam has the lowest. However, when the bucket size used is bigger than 1.50 cy, the estimated emissions start decreasing slowly and shows that for all types of soil, the fuel uses are the same. It indicates that the productivity rate of excavator based on the resistance of soil or soil type varies only when the excavator uses small size of bucket. For bigger bucket size, the resistance of soil does not have impact on productivity rate.
The sensitivity analysis for truck is applied in two different work situations: first, a 535 hp – model year 2003 truck with 30 cy loading capacity has to haul 1000 cy of soil in various distance, using various hauling speed, and has to wait for dumping and loading for 15–25 min; second, the same truck with various capacity of loading has to haul 1000 cy of soil in 1 mile, using average hauling speed range of 5–25 mph, and has to wait for loading and dumping for 15 min. Based on the information in Tables and , there is an inverse relationship between productivity rate and the fuel use and CO2 emissions; that is, as the productivity rate decreases, the fuel use and emissions increase. For any speed the truck uses to haul the soil, the productivity rate increases as loading capacity increases, and decreases as the haul distance increases.
Table 12 Truck – 535 hp; model year 2003; 30 cy capacity; 1000 cy soil; 10 mph of speed.
Table 13 Truck – 535 hp; model year 2003; 1 mile hauling distance; 15 min wait–dump time; 1000 cy soil.
The NOx and PM emissions from truck activity based on cycle distance are shown in Table , analysed using three different load–dump times: 15, 20 and 25 min. For all load–dump times, estimated emissions increase as the cycle distance increases. The longer the truck has to wait for loading and dumping, the higher the fuel use and emissions. More productive supporting equipment (such as excavator or backhoes) for loading and unloading soil to truck is needed to shorten the load–dump time and improve the truck's productivity rate. The estimated fuel use and CO2 emissions for three load–dump times have little difference when the truck has to haul within less than 2 miles. For hauling distance more than 2 miles, the estimated emissions vary for three different load–dump times. Truck with 25 min load–dump time increases its fuel use and emissions of CO2, very rapidly compared with 15 and 20 min load–dump times, as the hauling distance increases.
The productivity rates and emissions impact of truck activity based on loading capacity, and analysed using five different hauling speeds (5, 10, 15, 20 and 25 mph), are shown in Table . For all hauling speeds, the estimated fuel use and CO2 emission decrease as the loading capacity increases. It is understood that the productivity rate of truck improves when using bigger loading capacity, and therefore shorten the hauling duration. Truck with highest hauling speed (25 mph) has the lowest fuel use and emissions. The difference of emissions among all hauling speeds becomes smaller following the loading capacity; for instance, the difference of fuel use and emissions at 25 cy loading capacity is bigger than those at 50 cy or more loading capacity. It indicates that using various speed of hauling does not have bigger impact on the estimated fuel use and CO2 emissions if the truck uses bigger loading capacity.
6. Conclusion and future works
This article presented a methodology for estimating fuel use and CO2 emissions for some common earthwork activities performed by bulldozer, excavator and dump truck. The MLR approach proved to be a useful alternative for estimating the productivity rate of these equipments. The MLR models for the productivity rate can explain high percentage of the variability in the data. The models are good to be used as a benchmark for estimating fuel use and CO2 emissions from certain types of construction equipment performing earthwork activities. The productivity rate from this model (lcy/h) is used with BSFC (g/hp-h) from EPA's NONROAD model to estimate the total fuel use and CO2 emissions.
Based on the methodology presented in this article, the results revealed several trends related to total emissions of the equipment. For example, the total emissions increase as the trench depth or hauling distance increase, because digging deeper trench or hauling further distance lead to lower productivity. Meanwhile, as the excavator's bucket size or bulldozer's blade or truck's capacity increases, the total emissions decrease, because the productivity gets higher when the equipment uses bigger attachment size.
After the estimating tool has been developed, it is recommended for future research to validate and calibrate the model by real-world fuel use and CO2 emissions data collected from construction equipment. This will be done by using a portable emissions measurement system that is able to record second-by-second fuel use, emissions and engine data from the equipment performing earthwork activities. The field data collection and analysis process will permit evaluation of the variability in fuel use and emissions rates among equipments based on type, engine size, engine load and usage.
The estimating tool proposed in this article will be an effective means for assessing the environmental impacts of construction activities and will allow equipment owners or fleet managers, policy-makers and project stakeholders to evaluate more sustainable alternatives. The tool will help the contractor to estimate the total expected pollutant emissions for the project, which would be valuable information for a preliminary environmental assessment of the project.
References
- AkinsolaA. O.1997. “An Intelligent Model of Variations Contingency on Construction Projects.” PhD diss., University of Wolverhampton.
- AkintoyeA., and M.Skitmore. 1994. “Models of UK Private Sectors Quarterly Construction Demand.” Construction Management and Economics1994 (12): 3–13.
- AmmouriA. H., I.Srour, and R. F.Hamade. 2011. “Carbon Footprint Calculator for Construction Projects (CFCCP).” Paper presented at the Advances in Sustainable Manufacturing – 8th Global Conference on Sustainable Manufacturing, Berlin-Heidelberg, Germany.
- CARB. 2003. EMFAC 2002. Sacramento, CA: Planning and Technical Support Division, California Air Resources Board.
- CARB. 2007. User's Guide for OFFROAD2007. Sacramento, CA: Mobile Source Emissions Inventory Program, California Air Resources Board.
- DavidJ. E., and D. H.Gary. 1993. “ESTIVATE: A Model for Calculating Excavator Productivity and Output Costs.” Engineering, Construction and Architectural Management7 (1): 52–62.
- DunlopP., and S.Smith. 2003. “Estimating Key Characteristics of the Concrete Delivery and Placement Process Using Linear Regression Analysis.” Civil Engineering and Environmental Systems20 (4): 273–290.
- EdwardsD. J., G. D.Holt, and F. C.Harris. 2000. “A Comparative Analysis Between the Multilayer Perceptron Neural Network and Multiple Regression Analysis for Predicting Construction Plant Maintenance Cost.” Journal of Quality in Maintenance Engineering6 (1): 45–60.
- EPA. 2001. Non-road Diesel Emission Standards. Washington, DC: EPA's Assessment and Standard Division.
- EPA. 2007a. Cleaner Diesels: Low Cost Ways to Reduce Emissions from Construction Equipment. Washington, DC: EPA's Sector Strategies Program.
- EPA. 2007b. Measuring Construction Industry Environmental Performance. Washington, DC: EPA's Sector Strategies Program.
- EPA. 2010. Exhaust and Crankcase Emission Factors for Nonroad Engine Modeling – Compression Ignition. Washington, DC: Office of Transportation and Air Quality.
- HanS., and D. W.Halpin. 2005. “The Use of Simulation for Productivity Estimation Based on Multiple Regression Analysis.” Paper presented at the 37th Conference on Winter Simulation, Orlando, FL.
- KutnerM. H., C. J.Nachtsheim, and J.Neter. 2005. Applied Linear Regression Models. 4th ed.New York: McGraw-Hill.
- LewisP., and A.Hajji. 2012a. “Comparison of Two Models for Estimating Equipment Productivity for a Sustainability Quantification Tool.” Paper presented at the ICSDEC – Developing the Frontier of Sustainable Design, Engineering, and Construction, Fort Worth, TX, November 7–9.
- LewisP., and A.Hajji. 2012b. “Estimating the Economic, Energy, and Environmental Impact of Construction Equipment.” Paper presented at the Construction Research Congress, West Lafayette, IN, May 21–23.
- LiH., and Z.Lei. 2010. “Implementation of Discrete-Event Simulation (DES) in Estimating and Analyzing CO2 Emission During Earthwork of Building Construction Engineering.” Paper presented at the 17th International Conference on Industrial Engineering and Engineering Management (IEEM), Xiamen, China.
- OkS. C., and S. K.Sinha. 2006. “Construction Equipment Productivity Estimation Using Artificial Neural Network Model.” Construction Management and Economics24 (10): 1029–1044.
- RSMeans. 2011. RSMeans Heavy Construction Cost Data. Kingston, MA: RSMeans.
- SmithS. D.1999. “Earthmoving Productivity Estimation Using Linear Regression Techniques.” Journal of Construction Engineering and Management125 (3): 133–141.