
Abstract
The objective of this research is to investigate the reduction in fuel consumption and emission in spark ignition engine using blended bioethanol-gasoline and novel radiator-tube heater. Different percentages of ethanol – 0, 5, 10, 15, 20, 25 and 30% – are employed. The blended fuel is then pre-heated by sending it into a tube-heater-installed upper tank radiator which has different shape. The results show a significant reduction in fuel consumption and emission in engine. The best economical fuel consumption occurs in the tube-heater with a fin pipe of 10 mm space at 2.153 × 10⁻³ cc per cycle or 5.632%. However, the most economical fuel consumption occurs when 25% of bioethanol is added to fuel at 3.175 × 10⁻³ per cycle. This decreases fuel consumption by 8.306%. The highest decrease in fuel consumption occurs when fuel blended with 25% of bioethanol and tube-heater of 10 mm 6.236 × 10⁻³ cc per cycle or 16.313% is combined. In terms of emission reduction, the tube-heater with a space of 20 mm between fins (Tube 20) using a fuel mixture of 25% ethanol and 75% gasoline produced the lowest CO emissions.
1. Introduction
Over the past few years, reports have shown rapid growth in the number of vehicles in countries such as Indonesia (Soehodho Citation2007; Susilo et al. Citation2007), Malaysia (Mohamad and Kiggundu Citation2007), India (Mohan Citation2009; Ponnaluri Citation2012), Mexico (Guerra Citation2015), Russia (Kholod and Evans Citation2016), China (Chandra and Kumar Citation2003; Ma, Yang, and Shi Citation2007) and Thailand (Tanaboriboon and Satiennam Citation2005). As this trend continues, the effects will be felt in increased fuel consumption and the climate effects of global emissions. Moreover, the majority of fuel that is currently available, especially for transportation, is sourced from natural resources that cannot be renewed. This has led to the depletion of fossil fuels that will only continue in the future. To overcome this situation and avert a potential fuel crisis, it is necessary to reduce excessive fuel consumption and find methods to aid fuel savings.
The fuel efficiency of existing vehicles can be increased by several practices, such as optimising driving behaviour (de Abreu e Silva et al. Citation2015; Rolim et al. Citation2014; Tang, Huang, and Shang Citation2015; af Wåhlberg Citation2007; Walnum and Simonsen Citation2015), performing regular maintenance and utilising fuel-saving devices. Then are also various methods to improve the efficiency of fuel. For instance, fuel octane ratings can be increased though the magnetic method, electromagnetic method and cyclone method.
Fuel savings in SI engines can also be achieved by preheating fuel before it enters the combustion chamber, especially in a carburetor engine. The carburetor is a device for mixing air and fuel, and can be inefficient since it is not perfect in atomising. This in turn makes fuel combustion less efficient and thus the energy produced is not optimal. A method to achieve better combustion is by evaporating gasoline. In this way, better atomisation can be reached when fuel is mixed in the carburetor. This heating method is simple and feasible because it heats the fuel by utilising waste heat from the radiator. A practical model can be implemented by simple modifications to the radiator, or it can be made separately as portable independent equipment. Several studies have addressed the burning of a mixture of ethanol and gasoline in the combustion chamber SI engine. When a mixture such fuels is in the combustion chamber, the concentrations of CO and UHC (unburnt hydrocarbons) emissions are significantly decreased compared to pure gasoline. Ethanol–gasoline blends also provide the highest brake power (Elfasakhany Citation2015). Other research shows that this fuel blend reduces HC, CO and CO2 emissions significantly (Wang et al. Citation2015).
Another alternative to expand fuel supplies is to add bioethanol to fossil fuels. There are many researchers examining the use of bioethanol as a fuel additive for gasoline (Adnan et al. Citation2014; Dodić et al. Citation2009; Ferrari, Guigou, and Lareo Citation2013; Iliev Citation2015; Sundvor and López-Aparicio Citation2014; Trajer, Golisz, and Wojdalski Citation2015; Wang, Littlewood, and Murphy Citation2013; Zhuang and Hong Citation2013). Bioethanol, produced from plant-based feedstocks, is a renewable resource and a clean fuel that has a favourable effect on the environment because it produces lower emissions than fossil fuels during combustion. Bioethanol can be produced from a variety of feedstocks such as sugarcane, corn, wheat and cassava using first-generation processes and from cellulose biomass with second-generation processes, as well as using algae biomass with third-generation processes. Researchers have observed bioethanol production from resources including rice straw (Ahmed et al. Citation2016; Devendra and Pandey Citation2016; Sindhu et al. Citation2016), agricultural and forestry residue (Zhao et al. Citation2016), cassava (Kouteu Nanssou, Nono, and Kapseu Citation2016; Moshi et al. Citation2016), green coconut (Soares et al. Citation2016), paper sludge (Gomes, Domingues, and Gama Citation2016; Robus et al. Citation2016; Sebastião et al. Citation2016), algae (Karatay et al. Citation2016), cotton stalk, sweet sorghum (Larnaudie et al. Citation2016; Yu et al. Citation2016), almond shell (Kacem et al. Citation2016) and potato starch (Liu and Lien Citation2016). These developments in the research suggest further opportunities to produce large amounts of bioethanol as a fuel resource in the future. Although bioethanol has major environmental benefits by reducing fossil fuel emissions, production costs are still a challenge for developing the supply. The aim of this experiment is to reduce the fuel consumption of SI engines by utilising bioethanol as a fuel mixture and heating the fuel using a tube-heater to improve the combustion process. The experiment is illustrated with graphics and photographs. Since this is preliminary research, our goal is to understand the reduction in consumption from experimental variables.
2. Methods
2.1. Experimental equipment
In this experiment, we use equipment such as fuel cup gauges instument, a radiator which has been varied by a capillary tube with additional copper fins and a copper capillary tube.
Table shows the engine specifications used in this experiment. The engine used was a 4-cylinder gasoline engine with the following specifications: Type 4 stroke OHV; Number of cylinders: 4; 8 valve; cylinder diameter: 75 mm; piston stroke: 73; cylinder volume: 1,3L (1290 cc); Compression ratio: 8.9.
Table 1. Engine specifications.
2.2. Experimental description
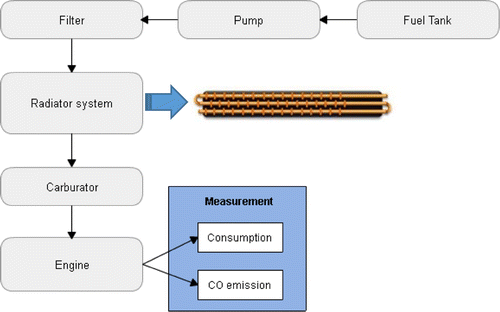
In this research, an experimental method in a spark-ignition engine is used to examine several methods that might increase efficiency and reduce fuel consumption, in particular, the effects of adding heat to a blended fuel. We also shall examine the emissions released by the engine. The fuel, which in this experiment includes pure gasoline and bioethanol blended with gasoline, is directed to a preheat system after going through the fuel filter and before entering the combustion chamber, as shown in Figure . After being heated, it flows to the carburetor, where fuel and air are mixed. From the carburetor, the mixture of fuel next flows to the combustion chamber.
Figure 1. Heating fuel flow using pipes in the radiator upper tank.
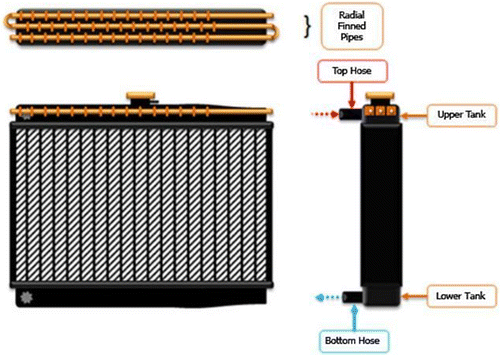
The preheat system is a tube-heater installed inside of the upper tank radiator as shown in Figure . The side of the upper tank has been drilled to create a hole, inside which the tube is put. The total length of the tube through which the water runs is 150 cm. This tube is heated by hot water from the radiator. The hot water comes from the water jacket in the engine body, carrying the heat generated there as the engine runs. It flows to the top house in the upper tank of the radiator. The hot water then heats the tube, and the gasoline inside, before returning to the lower tank. The hypothesis of this experiment is that heating the gasoline in this way will increase its efficiency of combustion and thus decrease fuel consumption.
Figure 2. Radial finned tube installed in the radiator upper tank.
The first step of the experiment is to examine the fuel consumption in a normal engine without the tube-heater, that is, without a fuel heating condition. The fuel flows from the tank to the carburetor and burns in the combustion chamber normally. This gives a basis for fuel consumption with which to compare the heated fuel condition.
Along with this condition, no blend of bioethanol and gasoline is used in the initial tests. To understand the effect of blending gasoline and bioethonol in fuel consumption and efficiency, bioethanol was added in different percentages in proportion to the gasoline: 0, 5, 10, 15, 20, 25 and 30%. The 0% blend contained no bioethanol, and instead the fuel was all gasoline. The 25% blend was 30% bioethanol and 75% gasoline.
In this experiment, two types of water tube were used in the heater: a plain tube without fins and tubes with radial fins. The radial fins, by providing more heat transfer surface area, conveyed more heat into the fuel blend. These radial-finned tubes were also varied with different spacing of the fins. On different tubes, fins were spaced by 10, 20 and 30 mm. More closely spaced fins meant each tube held more fins overall, which was determined to increase the heat. Our hypothesis was that the higher temperatures would increase efficiency and decrease fuel consumption of the engine.
During each experiment, the temperature of the fuel was measured was it went into and emerged from the tube-heater. The temperature of the water radiator in the hot and cold sides was also measured. Throughout the experiments, the engine was kept constant at 3000 rpm.
3. Results and discussion
3.1. Pure gasoline
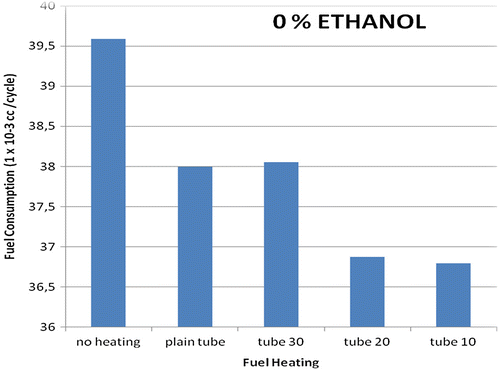
The first experiment was conducted using several tube-heater types attached to the engine, which ran on gasoline without an addition of bioethanol. The results are as shown in Figure . The most economical fuel consumption occurs when a tube-heater with 10 mm fin spacing is employed. Fuel is consumed at 36.792 × 10⁻³ cc per cycle, a decrease of 7% from that of the normal engine without a tube-heater. The tube-heater with 20 mm fin spacing has similar results to the 10 mm spacing, with also around 7% reduction in fuel consumption, though it appears slightly less efficient. The increased heat transfer of tubes with more fins did lower the rate of fuel consumption in each case. Using a tube-heater with 30 mm fin spacing is markedly less efficient, with consumption of just over 38 × 10−3 cc per cycle. In fact, our results show the tube-heater with 30 mm fin spacing is very slightly less efficient than that of a plain tube with no fins, which also showed fuel consumption at around 38 × 10−3 cc per cycle. However, in all cases fuel consumption was indeed decreased from the base rate of an engine using unheated gasoline, which it consumed at a rate of about 39.6 × 10⁻³ cc per cycle.
Figure 3. Effect of added tube-heater in the radiator upper tank using pure gasoline fuel.
3.2. Ethanol–gasoline blends
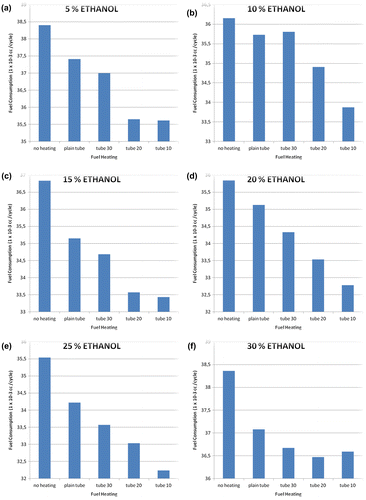
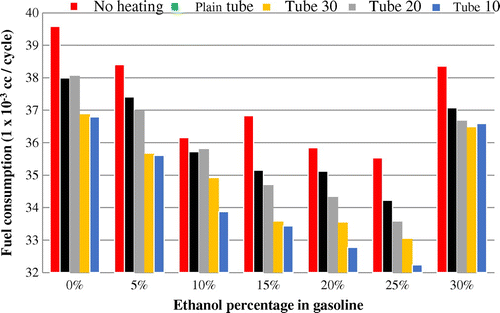
When the results of all experiments involving variations in bioethanol added to the fuel are compared, they reveal a common trend that fuel consumption decreases after addition of bioethanol and a tube-heater as shown in Figure . The most economical fuel consumption occurred with a blend of 25% added bioethanol (the second-highest amount tested) and a tube-heater with 10 mm spacing of radial fins (the densest fin spacing). This decreased fuel consumption by 7,351 × 10−3 cc per cycle, or by around 18.5%. The drop in fuel consumption is caused by the hotter temperature of the fuel in this condition. The tube-heater with 10 mm spacing shows the highest fuel temperature at 79 °C. Close spacing of fins means more fins overall than in other tube-heaters. Therefore, the heat from the radiator absorbed by the fuel is higher than in any other tube-heater, leading to a significant increase in temperature and efficiency in combustion.
Figure 4. Effect of added tube-heater in the radiator upper tank within ethanol blended.
The addition of bioethanol also contributes to increased efficiency, as well as substituting fossil fuel with a more renewable alternative. Gasoline fuel is a petroleum fraction containing the compound n-heptane and isooctane. Quality of the fuel is determined by this octane number. It measures a fuel’s ability to overcome knock when burned in the engine. Components of straight-chain alkanes (n-heptane) in the engine do not burn completely, which may cause disorder in the engine piston movements and result in knock (or knocking). Meanwhile, alkanes with branched chain structures (isooctane) produce more effective combustion. The addition of bioethanol increases the octane number, which produces more stability and improves the power of the engine. The higher the octane value, the more explosive power and increase in power. With these conditions, the fuel consumption is again decreased. For instance, even the addition of 5% bioethanol to gasoline without the use of a tube-heater caused fuel consumption to drop from 39.6 × 10⁻³ cc per cycle to under 38.5 × 10⁻³ cc. Adding heat through a plain tube brought consumption down to under 37.5 × 10⁻³ cc, and the best efficiency came through a tube-heater with 10 mm spacing of fins, with consumption around 36.5 × 10⁻³ cc.
An unheated 10% bioethanol blend shows fuel consumption of around 36.2 × 10⁻³ cc. The addition of an unfinned tube-heater reduced this to about 35.7 × 10⁻³ cc, but when the tube-heater included fins spaced at 30 mm, fuel consumption actually increased somewhat. Fin spacing of 20 mm led to fuel consumption of under 35 × 10−3 cc, and spacing of 10 mm lead to the biggest decrease to just under 34 × 10−3 cc.
The 15% bioethanol blend was less efficient when unheated, consuming about 36.9 × 10⁻³ cc. However, the addition of heat reduced this to around 35.1 × 10⁻³ cc, and fin spacing of 30 mm showed reduction to 34.6 × 10⁻³ cc. A tube-heater with 20 mm spacing reduced fuel consumption even more, to just over 33.5 × 10⁻³ cc, and 10 mm fin spacing resulted in fuel consumption of just under that measure.
The 20% ethanol blend was consumed at a rate of about 35.8 × 10⁻³ cc when unheated and 35.1 × 10⁻³ cc when heated in a plain tube. Fin spacing of 30 mm reduced fuel consumption to around 34.4 × 10⁻³ cc, spacing of 20 mm reduced it to 33.5 × 10⁻³ cc, and the greatest savings came with 10 mm fin spacing in the tube-heater, where fuel consumption was around 32.7 × 10⁻³ cc.
The most optimal results of these experiments came with the addition of 25% bioethanol. The unheated fuel was used by the engine at a rate of 35.5 × 10⁻³ cc per cycle. A plain tube-heater reduced this to about 34.2 × 10⁻³ cc, and 30 mm spacing brought it to just over 33.5 × 10⁻³ cc. This fuel blend has a burning point higher than the levels of other bioethanol blends, a situation which makes the existing fuel in the combustion chamber burn completely and makes fuel consumption more efficient. The benefit of additional heat transfer through tube-heater fins is illustrated by the fact that a 25% ethanol blend with fin spacing of 10 mm showed the most efficient fuel consumption of all, at about 32.3 × 10⁻³ cc (as mentioned, this is a reduction of 18.5% fuel consumption from base conditions).
However, the 30% ethanol blend did not show such a benefit in efficiency. Unheated 30% ethanol fuel was consumed at a rate of around 38.4 × 10⁻³ cc, which is just slightly less than the 5% blend and roughly 2 × 10⁻³ cc per cycle more than the 10% blend. Adding heat did increase efficiency, reducing consumption to just over 37 × 10−3 cc and further reducing it to 36.7 × 10⁻³ cc with the addition of fins spaced at 30 mm. Tube spacing of 20 mm was the most efficient for this blend, with consumption under 36.5 × 10⁻³ cc per cycle, and spacing of 10 mm showed consumption of just over that amount. Clearly, the addition of heat reduces fuel consumption overall, and adding bioethanol to the blend also increases efficiency in most cases, but there are some exceptions.
3.3. Gasoline comparison
Figure shows a comparison between pure gasoline and the percentage of ethanol in gasoline. Zero per cent of ethanol indicates the use of pure gasoline. It is shown that in all stages of the experiment the fuel consumption that used pure gasoline is higher than other experimental stages. For example, in the use of fuel without heating, the fuel consumption is 39.6 × 10⁻³ cc per cycle, while the 5% ethanol fuel consumption dropped to 36.792 × 10⁻³ cc per cycle. This trend continued up to 25% ethanol in gasoline. But in the experimental of 30% ethanol, fuel consumption increased again. This shows that the best ratio of ethanol and gasoline is at the ratio of 25%:75%. Meanwhile, in the experiment using heating pipes without fins, heating with a finned pipe at a distance of 30, 20, snf 10 cm has the same trend. The ratio of ethanol and gasoline is economical and occurs at the same ratio.
Figure 5. Fuel consumption of mixes of ethanol and gasoline.
3.4. CO emission
Figure presents the CO emissions from mixtures of ethanol and gasoline during the experiment. The results show that with an additional percentage of ethanol in the mixture, fewer emissions were produced from the combustion. An exception is in experimental Tube 10 when ethanol was included at 0 and 30%. In that case CO emissions jumped to over 2%.
Figure 6. CO emission of mixes ethanol and gasoline.
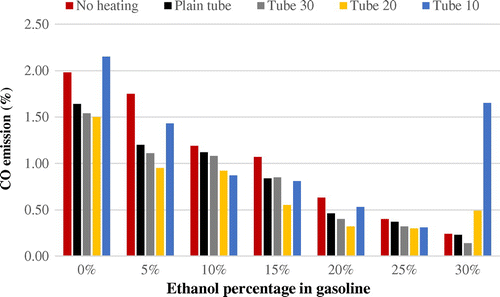
However, it is clear that the trend is similar in almost all of the experiments we conducted. The addition of ethanol on its own was enough to account for significant reductions in emissions. This is likely because the burning point of mixed fuel is lower than that of pure gasoline. The addition of ethanol results in a higher octane rating. High-octane fuel burns more slowly, which reduces the emission of environmentally unfriendly carbon.
Compared to the use of pure gasoline, it reduces emissions significantly. In this experiment, pure gasoline used without a heating component released 1.98% carbon. This further decreased to 1.64% when the fuel was heated using a plain tube without fins. In the case of Tube 30 (a tube-heater with fins spaced at 30 mm), carbon emissions were reduced to 1.54%, and in Tube 20 (fins spaced at 20 mm), emissions were 1.50%. Use of a 15% mixture of ethanol into gasoline reduced emissions by half, and the use of tube-heaters further brought CO emissions under 1%. For the most part, finned heater tubes reduced emissions more than the plain tubes, but the difference was variable.
It should be noted that experimental Tube 10 (a tube-heater with fins spaced at 10 mm) shows a different result. Carbon emissions from pure gasoline in Tube 10 were 2.15%, actually greater than the emissions produced without the heating tube. However, overall similar results were produced for the five variables across the range of ethanol mixtures from 5 to 25%. Higher percentages of ethanol produced lower emissions, as did the use of a heating tube (with the exception of Tube 10 at a 30% ethanol mixture, which produced unusually high emissions of over 1.50%). The lowest emissions released in this experiment came from use to Tube 20 with a 25% mixture of ethanol. Carbon emissions from that combination of variables amounted to less than 0.40%.
4. Conclusion
Fuel consumption, especially of gasoline, is rising sharply with the increase in the number of motor vehicles. Even though world oil prices are currently down to their lowest level, the supply of oil will be decreased within the next few years. Therefore, it is necessary to address the efficiency of fuel consumption before this consumption becomes excessive. In this experimental research we use two methods: blending with ethanol and heating the blending fuel to increase its efficiency.
Based on this experiment, it can be concluded that heating fuel using a tube-heater in the upper radiator tank can significantly reduce the fuel consumption of a car engine. Using pure gasoline in a normal way without heating a tube consumes 39.6 cc per cycle. And it decreased to 38 × 10−3 cc per cycle employing a plain tube. Using a tube-heater with 30 mm fin spacing is markedly less efficient, with consumption of just over 38 × 10−3 cc per cycle. In fact, our results show the tube-heater with 30 mm fin spacing is very slightly less efficient than that of a plain tube. The most economical fuel consumption occurs when a tube-heater with 10 mm fin spacing is employed. Fuel is consumed at 36.792 × 10⁻³ cc per cycle, a decrease of 7% from that of the normal engine without a tube-heater.
The addition of bioethanol fuel also decreases overall fuel consumption. The largest decrease in consumption comes from a 25–75% blend of bioethanol and gasoline, with the result of 4.052 × 10⁻³ cc per cycle in fuel consumption, or a decrease of 10.235% compared with no ethanol addition. If the fuel used is combined with bioethanol along with the addition of tube-heater, a blend of 25% bioethanol and a tube-heater with 10 mm fin spacing produces the most economical fuel consumption, with reduction by 10.235%. When it comes to emission reduction, the tube-heater with a fin spacing distance of 20 mm (Tube 20) using a fuel mixture of 25% ethanol and 75% gasoline produced the lowest percentage of CO. Our continuing research will analyse in detail the behaviour of each variable on emissions in the tube. In particular, a significant difference can be seen in the results from Tube 10. Furthermore, we need to analyse the effect of tube of different shapes on fuel consumption and amount of emissions in detail.
Notes on contributors
Danar Susilo Wijayanto works as a university lecturer at Universitas Negeri Sebelas Maret, Indonesia. His main research interests are in automotive engineering and fuel blend.
Ngatou Rohman works as a university lecturer at Universitas Negeri Sebelas Maret, Indonesia. His main research interests are in automotive engineering and vocational engineering.
Ranto Hadisaputro works as a university lecturer at Universitas Negeri Sebelas Maret, Indonesia. His main research interests are in automotive engineering and vocational engineering.
Husin Bugis works as a university lecturer at Universitas Negeri Sebelas Maret, Indonesia. His main research interests are in automotive engineering and vocational engineering.
Nugroho Agung Pambudi, PhD, works as a university lecturer at Universitas Negeri Sebelas Maret, Indonesia and a postdoctoral research associate in the International Institute for Carbon-Neutral Research at the Kyushu University. He received his PhD in Energy Resources Engineering from the Kyushu University in 2014. His research interests are on energy modelling, exergy analysis, optimisation, and renewable energy.
Disclosure statement
No potential conflict of interest was reported by the authors.
References
- Adnan, Nur Amelia, Sheril Norliana Azreen, Suraini Abd-Aziz Suhaimi, Mohd Ali Hassan, and Lai-Yee Phang. 2014. “Optimization of Bioethanol Production from Glycerol by Escherichia Coli SS1.” Renewable Energy 66: 625–633. doi:10.1016/j.renene.2013.12.032.
- af Wåhlberg, A. E. 2007. “Long-Term Effects of Training in Economical Driving: Fuel Consumption, Accidents, Driver Acceleration Behavior and Technical Feedback.” International Journal of Industrial Ergonomics 37 (4): 333–343. doi:10.1016/j.ergon.2006.12.003.
- Ahmed, Muhammad Ajaz, Muhammd Saif Ur Rehman, Ruly Terán-Hilares, Saira Khalid, and Jong-In Han. 2016. “Optimization of Twin Gear-Based Pretreatment of Rice Straw for Bioethanol Production.” Energy Conversion and Management Accessed August 4. doi:10.1016/j.enconman.2016.06.022.
- Chandra, Satish, and Upendra Kumar. 2003. “Effect of Lane Width on Capacity Under Mixed Traffic Conditions in India.” Journal of Transportation Engineering 129 (2): 155–160. doi:10.1061/(ASCE)0733-947X(2003)129:2(155).
- de Abreu e Silva, João, Filipe Moura, Bernardo Garcia, and Rodrigo Vargas. 2015. “Influential Vectors in Fuel Consumption by an Urban Bus Operator: Bus Route, Driver Behavior or Vehicle Type?” Transportation Research Part D: Transport and Environment 38: 94–104. doi:10.1016/j.trd.2015.04.003.
- Devendra, Leena P., and Ashok Pandey. 2016. “Hydrotropic Pretreatment on Rice Straw for Bioethanol Production.” Renewable Energy, Special Issue: New Horizons in Biofuels Production and Technologies 98 (December): 2–8. doi:10.1016/j.renene.2016.02.032.
- Dodić, Siniša N., Stevan D. Popov, Jelena M. Dodić, Jovana A. Ranković, and Zoltan Z. Zavargo. 2009. “Potential Contribution of Bioethanol Fuel to the Transport Sector of Vojvodina.” Renewable and Sustainable Energy Reviews 13 (8): 2197–2200. doi:10.1016/j.rser.2009.01.005.
- Elfasakhany, Ashraf. 2015. “Investigations on the Effects of Ethanol–methanol–gasoline Blends in a Spark-Ignition Engine: Performance and Emissions Analysis.” Engineering Science and Technology, an International Journal 18 (4): 713–719. doi:10.1016/j.jestch.2015.05.003.
- Ferrari, Mario Daniel, Mairan Guigou, and Claudia Lareo. 2013. “Energy Consumption Evaluation of Fuel Bioethanol Production from Sweet Potato.” Bioresource Technology 136: 377–384. doi:10.1016/j.biortech.2013.03.045.
- Gomes, Daniel, Lucília Domingues, and Miguel Gama. 2016. “Valorizing Recycled Paper Sludge by a Bioethanol Production Process with Cellulase Recycling.” Bioresource Technology 216 (September): 637–644. doi:10.1016/j.biortech.2016.06.004.
- Guerra, Erick. 2015. “The Geography of Car Ownership in Mexico City: A Joint Model of Households’ Residential Location and Car Ownership Decisions.” Journal of Transport Geography 43: 171–180. doi:10.1016/j.jtrangeo.2015.01.014.
- Iliev, Simeon. 2015. “A Comparison of Ethanol and Methanol Blending with Gasoline Using a 1-D Engine Model.” Procedia Engineering 100: 1013–1022. doi:10.1016/j.proeng.2015.01.461.
- Kacem, Imen, Mohamed Koubaa, Sameh Maktouf, Fatma Chaari, Taha Najar, Moncef Chaabouni, Nadia Ettis, and Semia Ellouz Chaabouni. 2016. “Multistage Process for the Production of Bioethanol from Almond Shell.” Bioresource Technology 211 (July): 154–163. doi:10.1016/j.biortech.2016.03.057.
- Karatay, Sevgi Ertuğrul, Meltem Erdoğan, Sedat Dönmez, and Gönül Dönmez. 2016. “Experimental Investigations on Bioethanol Production from Halophilic Microalgal Biomass.” Ecological Engineering 95 (October): 266–270. doi:10.1016/j.ecoleng.2016.06.058.
- Kholod, Nazar, and Meredydd Evans. 2016. “Reducing Black Carbon Emissions from Diesel Vehicles in Russia: An Assessment and Policy Recommendations.” Environmental Science & Policy 56: 1–8. doi:10.1016/j.envsci.2015.10.017.
- Kouteu Nanssou, Paul Alain, Yvette Jiokap Nono, and César Kapseu. 2016. “Pretreatment of Cassava Stems and Peelings by Thermohydrolysis to Enhance Hydrolysis Yield of Cellulose in Bioethanol Production Process.” Renewable Energy 97 (November): 252–265. doi:10.1016/j.renene.2016.05.050.
- Larnaudie, Valeria, Eloísa Rochón, Mario Daniel Ferrari, and Claudia Lareo. 2016. “Energy Evaluation of Fuel Bioethanol Production from Sweet Sorghum Using Very High Gravity (VHG) Conditions.” Renewable Energy 88 (April): 280–287. doi:10.1016/j.renene.2015.11.041.
- Liu, Yu-Kuo, and Po-Min Lien. 2016. “Bioethanol Production from Potato Starch by a Novel Vertical Mass-Flow Type Bioreactor with a Co-Cultured-Cell Strategy.” Journal of the Taiwan Institute of Chemical Engineers 62 (May): 162–168. doi:10.1016/j.jtice.2016.01.027.
- Ma, Hong, Xinmiao Yang, and Qixin Shi. 2007. “Motorization Process and Management in Big Cities in China: Take Beijing as an Example.” IATSS Research 31 (2): 42–47. doi:10.1016/S0386-1112(14)60221-1.
- Mohamad, Jamilah, and Amin T. Kiggundu. 2007. “The Rise of the Private Car in Kuala Lumpur, Malaysia: Assessing the Policy Options.” IATSS Research 31 (1): 69–77. doi:10.1016/S0386-1112(14)60185-0.
- Mohan, Dinesh. 2009. “Road Accidents In India.” IATSS Research 33 (1): 75–79. doi:10.1016/S0386-1112(14)60239-9.
- Moshi, Anselm P., Ken M. Hosea, Emrode Elisante, Gashaw Mamo, Linda Önnby, and Ivo Achu Nges. 2016. “Production of Raw Starch-Degrading Enzyme by Aspergillus Sp. and Its Use in Conversion of Inedible Wild Cassava Flour to Bioethanol.” Journal of Bioscience and Bioengineering 121 (4): 457–463. doi:10.1016/j.jbiosc.2015.09.001.
- Ponnaluri, Raj V. 2012. “Road Traffic Crashes and Risk Groups in India: Analysis, Interpretations, and Prevention Strategies.” IATSS Research 35 (2): 104–110. doi:10.1016/j.iatssr.2011.09.002.
- Robus, Charles L. L., Lalitha Devi Gottumukkala, Eugéne van Rensburg, and Johann F. Görgens. 2016. “Feasible Process Development and Techno-Economic Evaluation of Paper Sludge to Bioethanol Conversion: South African Paper Mills Scenario.” Renewable Energy 92 (July): 333–345. doi:10.1016/j.renene.2016.02.017.
- Rolim, Catarina, Patrícia Baptista, Gonçalo Duarte, Tiago Farias, and Yoram Shiftan. 2014. “Quantification of the Impacts of Eco-Driving Training and Real-Time Feedback on Urban Buses Driver’s Behaviour.” Transportation Research Procedia 3: 70–79. doi:10.1016/j.trpro.2014.10.092.
- Sebastião, Diogo, Margarida S. Gonçalves, Susana Marques, César Fonseca, Francisco Gírio, Ana C. Oliveira, and Cristina T. Matos. 2016. “Life Cycle Assessment of Advanced Bioethanol Production from Pulp and Paper Sludge.” Bioresource Technology 208 (May): 100–109. doi:10.1016/j.biortech.2016.02.049.
- Sindhu, Raveendran, Mathiyazhakan Kuttiraja, Thunoli Payyanvalappil Prabisha, Parameswaran Binod, Rajeev K. Sukumaran, and Ashok Pandey. 2016. “Development of a Combined Pretreatment and Hydrolysis Strategy of Rice Straw for the Production of Bioethanol and Biopolymer.” Bioresource Technology, Waste Biorefinery – Advocating Circular Economy 215 (September): 110–116. doi:10.1016/j.biortech.2016.02.080.
- Soares, Jimmy, Mekonnen M. Demeke, Maria R. Foulquié-Moreno, Miet Van de Velde, Alex Verplaetse, Antonio Alberto Ribeiro Fernandes, Johan M. Thevelein, and Patricia Machado Bueno Fernandes. 2016. “Green Coconut Mesocarp Pretreated by an Alkaline Process as Raw Material for Bioethanol Production.” Bioresource Technology 216 (September): 744–753. doi:10.1016/j.biortech.2016.05.105.
- Soehodho, Sutanto. 2007. “Motorization in Indonesia and Its Impact to Traffic Accident.” IATSS Research 31 (2): 27–33. doi:10.1016/S0386-1112(14)60219-3.
- Sundvor, Ingrid, and Susana López-Aparicio. 2014. “Impact of Bioethanol Fuel Implementation in Transport Based on Modelled Acetaldehyde Concentration in the Urban Environment.” Science of The Total Environment 496: 100–106. doi:10.1016/j.scitotenv.2014.07.017.
- Susilo, Yusak O., Wimpy Santoso, Tri Basuki Joewono, and Danang Parikesit. 2007. “A Reflection of Motorization and Public Transport in Jakarta Metropolitan Area.” IATSS Research 31 (1): 59–68. doi:10.1016/S0386-1112(14)60184-9.
- Tanaboriboon, Yordphol, and Thaned Satiennam. 2005. “Traficc Accidents in Thailand.” IATSS Research 29 (1): 88–100. doi:10.1016/S0386-1112(14)60122-9.
- Tang, Tie-Qiao, Hai-Jun Huang, and Hua-Yan Shang. 2015. “Influences of the Driver’s Bounded Rationality on Micro Driving Behavior, Fuel Consumption and Emissions.” Transportation Research Part D: Transport and Environment 41: 423–432. doi:10.1016/j.trd.2015.10.016.
- Trajer, Jędrzej, Ewa Golisz, and Janusz Wojdalski. 2015. “Analysis of Energy-Consumption of Bioethanol Production in Agricultural Distilleries in Poland.” Agriculture and Agricultural Science Procedia 7: 265–271. doi:10.1016/j.aaspro.2015.12.046.
- Walnum, Hans Jakob, and Morten Simonsen. 2015. “Does Driving Behavior Matter? An Analysis of Fuel Consumption Data from Heavy-Duty Trucks.” Transportation Research Part D: Transport and Environment 36: 107–120. doi:10.1016/j.trd.2015.02.016.
- Wang, Lei, Jade Littlewood, and Richard J. Murphy. 2013. “Environmental Sustainability of Bioethanol Production from Wheat Straw in the UK.” Renewable and Sustainable Energy Reviews 28: 715–725. doi:10.1016/j.rser.2013.08.031.
- Wang, Xiaochen, Zhenbin Chen, Jimin Ni, Saiwu Liu, and Haijie Zhou. 2015. “The Effects of Hydrous Ethanol Gasoline on Combustion and Emission Characteristics of a Port Injection Gasoline Engine.” Case Studies in Thermal Engineering 6 (September): 147–154. doi:10.1016/j.csite.2015.09.007.
- Yu, Menghui, Jihong Li, Sandra Chang, Lei Zhang, Yueying Mao, Ting Cui, Zhipei Yan, Chunliang Luo, and Shizhong Li. 2016. “Bioethanol Production Using the Sodium Hydroxide Pretreated Sweet Sorghum Bagasse without Washing.” Fuel 175 (July): 20–25. doi:10.1016/j.fuel.2016.02.012.
- Zhao, Xinqing, Liang Xiong, Mingming Zhang, and Fengwu Bai. 2016. “Towards Efficient Bioethanol Production from Agricultural and Forestry Residues: Exploration of Unique Natural Microorganisms in Combination with Advanced Strain Engineering.” Bioresource Technology, Waste Biorefinery – Advocating Circular Economy 215 (September): 84–91. doi:10.1016/j.biortech.2016.03.158.
- Zhuang, Yuan, and Guang Hong. 2013. “Primary Investigation to Leveraging Effect of Using Ethanol Fuel on Reducing Gasoline Fuel Consumption.” Fuel 105: 425–431. doi:10.1016/j.fuel.2012.09.013.