
ABSTRACT
Biosorption process is emerging as a potential alternative for the heavy metal removal from aqueous solutions. A packed bed column containing biomaterials like papaya leaf powder and paddy straw powder was used for copper removal from aqueous solutions. The breakthrough curve was having an S-shaped profile and the breakthrough time became less with increase in initial concentration. Percentage removal of copper was around 85% and 77% for papaya leaf powder and paddy straw powder, respectively for a contact time of 120 minutes and initial concentration of 10 mg/L. A biogeocomposite material was developed to test the enhancement in adsorption using layers of non-woven geotextile material and a significant increase in adsorption was obtained. With the addition of geotextile material in between papaya powder layer and paddy straw powder, there was an average increase of 12.66% and 11.98%, respectively for the removal. A biocomposite material was developed with a mixture of the two biosorbents and the adsorption value of the biocomposite material was in between the two biosorbents. The applicability of Yoon Nelson model and Adam Bohart model were also evaluated and the most suitable model came out to be Yoon and Nelson model.
1. Introduction
In developing countries the fast-paced development of industries such as fertilisers, paper industries, pesticide and metal mining operations caused various types of pollutants, especially heavy metals, to be discharged into the environment. Heavy metals are very difficult to be eliminated from the environment since they are non-biodegradable (Siti Nur et al. Citation2013). Copper is emitted into water streams from industries like iron and steel production, printing and photographic industry, electroplating, metalworking, mining and finishing processes. About 60–70% of all metals used in plating process contaminates the rinse waters during the plating process when the plated objects are rinsed upon removal from the plating bath and only the remaining are effectively utilised, i.e. plated on the articles (Dermentzis et al. Citation2009).
From the preliminary study conducted using industrial waste water from the study area in Bangalore, it was concluded that the concentration of copper was higher than the permissible limit for discharging in water bodies, while the concentration of other heavy metals like lead, cadmium and zinc were less and mostly within the permissible limits and hence the study was focussed on removal of copper. The maximum acceptable limit of copper concentration in effluent discharge to water bodies as per the Environment (Protection) Rules, 1986, India is 3 mg/L.
Adsorption becomes a preferred choice due to its simplicity, economy, easy to scale-up and its ability and efficiency to remove low concentration substance even at part per million levels. Adsorption using biomaterials is much more advantageous as there is no need of regeneration of the adsorbent (Chih-Huang and Yu Chin Citation2012). Biosorbents are highly efficient and often require little processing. (Sen et al. Citation2015).
Biosorption processes are particularly suitable to treat waste water having low concentration of heavy metals (Fenglian and Qi Citation2011). The major advantages of biosorption are the use of inexpensive biosorbents and its high effectiveness in reducing the heavy metal ions. Researchers have done experiments for heavy metal removal using plant materials such as Firmiana simplex leaf (Tang et al. Citation2012), Pineapple leaf powder (Chih-Huang and Yu Chin Citation2012), Ashoka leaf powder (Shelke et al. Citation2009), Agricultural wastes (Hernáinz et al. Citation2009), Basella alba leaves (Babalola et al. Citation2008), Neem bark (Tarun et al. Citation2009), Gmelina arborea leaves (Tijani, Musah, and Blessing Citation2011), Erythrina variegata orientalis leaf powder (Venkateswarlu et al. Citation2008) and Tree fern (Ho Citation2003).
Papaya leaf powder and paddy straw powder have been tried as biosorbents for the removal of copper. About 90–95% removal has been achieved through batch studies (Varma and Misra Citation2015, 2016). Lignin present in biomaterials exchange protons and chelates with the metallic ion (Buasri et al. Citation2012). Biomass normally contains functional groups, such as, carboxyl, carbonyl and hydroxyl groups, which facilitate metal binding by chelation. The metal ions will also be adsorbed by complexing with the negatively charged reaction sites on the adsorbent. Adsorption of metal ions onto hydroxyl and carboxyl groups can be represented as follows:
where M = metal ion, ROH and RCOO– are hydroxyl group and carboxylate ion arising from the papaya leaves (Subramanian, Chockalingam, and Braun Citation2010).
Geo-textiles are permeable fabrics and have the ability to separate, filter, reinforce, protect or drain when used in association with soil. They are made from polypropylene or polyester and come in three basic forms: woven, needle punched or heat bonded (Umesh, Abhishek, and Ankita Citation2014).They are commonly used in filtration and drainage. When the geotextile is grafted with some biomolecules, it can trap heavy metals from polluted effluent (Vandenbossche et al. Citation2014). Degoutin et al. (Citation2015) conducted studies for the removal of heavy metals from leachates extracted from sediments and found that it can effectively remove copper, lead and zinc. The ability of chitosan-coated geotextile material for the removal of heavy metals like copper, nickel and cobalt were 50, 45, 35 mg/g, respectively, under optimum conditions in studies conducted by Druet, Achari, and Isaad (Citation2015).
In this study, a biogeocomposite material is developed with biosorbents in a bag of geotextile material for copper removal from aqueous solution in dynamic mode study. Papaya leaf powder and paddy straw powder were used separately as biosorbents. The performance for removal of copper for various initial concentrations of the metal has been studied. A biocomposite with a mixture of papaya leaf powder and paddy straw powder have also been tested for the removal of copper.
2. Materials and methods
2.1. Copper stock solution
1000 pm of copper solution was made by dissolving 3.93 gm of copper sulphate pentahydrate (CuSO4.5H2O) in one litre distilled water. This stock solution was diluted to varied initial concentrations and used for various other studies.
2.2. Papaya leaf powder
Leaf from papaya plants were collected, washed several times, dried in sunlight and then in oven at 800 °C for 4–5 h. After that, it is powdered and kept for further use in sealed containers. The powder was sieved to size 300–600 μ which was used for the experiment.
2.3. Paddy straw powder
Paddy straw was collected from agricultural field and chopped into small pieces. It is then washed several times with water and dried in sunlight for several days. Dried paddy straw was kept in oven at 80 °C for 3–4 h. It was powdered in a mixer and passed through fine sieves to obtain fine size mesh particles. The paddy straw powder between size 300–600 μ was stored in sealed containers for further use for all the experiments.
2.4. Geotextile material
Geotextiles have been defined as woven, nonwoven or knitted fabrics having application in civil engineering, such as interfacing of the fabric with soil to give reinforced structures. Nonwoven Geotextile Fabrics are highly water permeable and have a random, three-dimensional pore structure. Geotextile material which is non woven and made of polypropylene fabric was used to support the absorption process here. For dynamic mode studies, it is cut and stitched into a cylindrical form so that it exactly fit into the column structure. The properties of the geotextile material used here are given in .
Table 1. Properties of geotextile material.
2.5. Experimental set-up
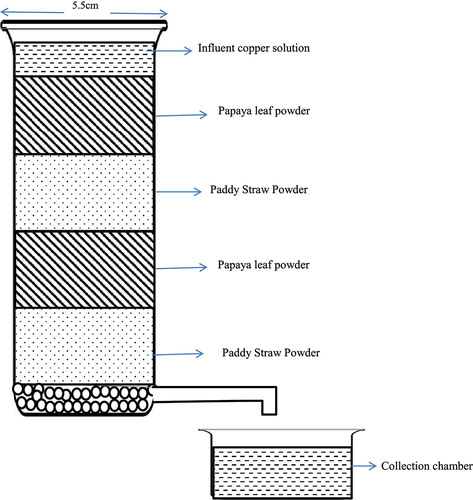
A cylindrical column having diameter of 5.5 cm and length of 35 cm was used for conducting PFR studies. Adsorbent was filled in the column after weighing and the length of adsorbent in the column was noted. An overhead tank was set up which is filled with copper solutions of known concentration from which it is allowed to pass into the column. The metal ion solutions were fed to the column at a constant flow rate using a pump, the flow was from the top to bottom. An additional valve was also provided to adjust the inflow water so that a constant rate of flow can be maintained. At fixed time intervals, the effluent from column was collected and final concentration of copper was measured using AA 240 atomic absorption spectrophotometer having double beam with wavelength range of 185–900 nm. The absorbance measurements were noted at wavelength of 324 nm. The initial concentrations of the solutions were varied from 10 to 40 mg/L keeping bed height as 25 cm and rate of flow as 13 ml/min.
Papaya leaf powder and paddy straw powder was filled separately and tests were conducted. For biocomposite, the column was filled with four layers, two each of papaya leaf powder and paddy straw powder in alternate layers and is shown in .
Figure 1. Experimental set-up for the dynamic study of biocomposite.
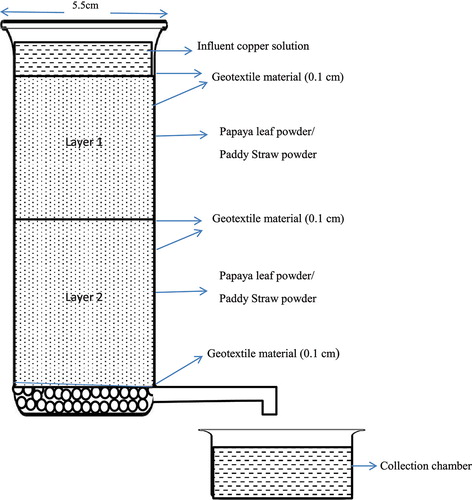
For biogeocomposite, the geotextile material was stitched to exactly fit into the column and the adsorbents were added into the stitched material well fitting into the cylindrical column with layers of geotextile material in the top, centre and at the bottom. The layout of column is shown in .
Figure 2. Experimental set-up for the dynamic study of biogeocomposite.
3. Results and discussion
3.1. Characterisation of the materials
The physical properties of the materials are given in .
Table 2. Physical properties of adsorbents.
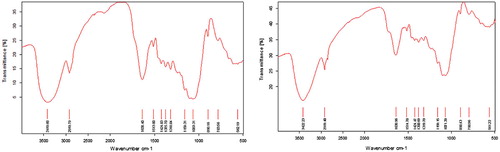
FTIR analysis of the adsorbents was carried out using a FTIR spectrophotometer. The functional groups like OH, C–H alkane group, CO primary amine, CH3–C alkanes, COO− carboxylate and aromatic hydrocarbons can be attributed to the FTIR peaks as shown in the Figures and . The bands shifted slightly after the adsorption of copper due to the participation of the functional groups in the adsorption process.
Figure 3. FTIR spectra of papaya leaf powder before and after adsorption.
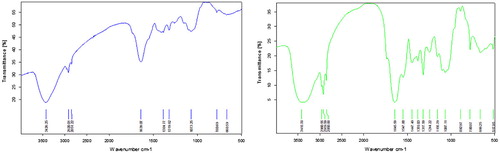
Figure 4. FTIR spectra of paddy straw powder before and after adsorption.
3.2. Papaya leaf powder
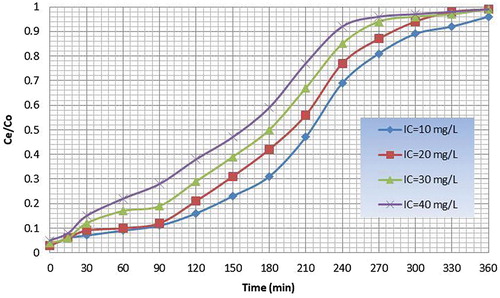
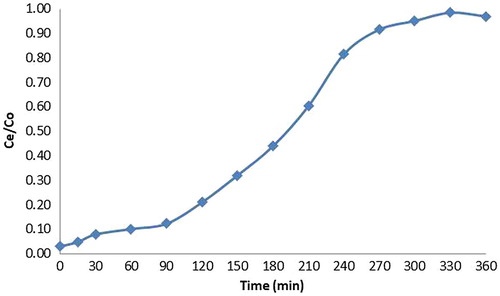
Column was filled with papaya leaf powder weighing 150 grams and copper solutions having known initial concentrations from 10 to 40 mg/L was allowed to pass through the column. Bed height and rate of flow was kept constant. Effluent was collected at particular intervals and concentration of copper was detected. The breakthrough profile was S shaped that is characteristic of adsorbates of small molecular sizes and also of adsorbents comprised of small-sized particles since the effluent concentration of metal is zero initially and slowly increases with time reaching the initial value of the metal concentration when the adsorbent is exhausted. The slope of the breakthrough curve increased with the initial concentration. The breakthrough time was found to be 120 min corresponding to C e /C o value of 0.15 for an initial metal (influent) concentration of 10 mg/L. The exhaust time was found to be 310 min corresponding to C e /C o value of 0.9. The availability of the metal molecules for the adsorption sites is more at higher concentration, which leads to higher uptake of metal at higher concentration but the breakthrough time is shorter for higher concentrations (Nwabanne and Igbokwe Citation2012). The breakthrough time was found to be 100 min corresponding to C e /C o value of 0.15 for an initial concentration of 20 ppm. The exhaust time was found to be 280 min corresponding to C e /C o value of 0.9. The breakthrough curves for papaya leaf powder for different initial concentrations are given in .
Figure 5. Breakthrough curves for papaya leaf powder for different initial concentrations.
3.3. Paddy straw powder
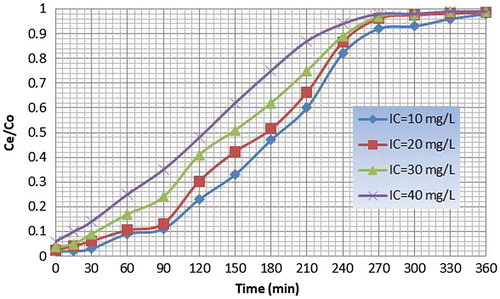
Column was filled with paddy straw powder weighing 90 g and copper solutions having known initial concentrations from 10 to 40 mg/L was allowed to pass through the column. Effluent was collected at particular intervals and concentration of copper was detected. The breakpoint time decreases with increasing inlet concentration as both the binding sites and ion exchange sites become quickly saturated. The adsorbed quantity increased with the initial concentration. The breakthrough time was found to be 92 min corresponding to C e /C o value of 0.15 for an initial concentration of 20 ppm. The exhaust time was found to be 250 min corresponding to C e /C o value of 0.9. The breakthrough curves for paddy straw powder for different initial concentrations are given in .
Figure 6. Breakthrough curves for paddy straw powder for different initial concentrations.
3.4. Biogeocomposite with papaya leaf powder
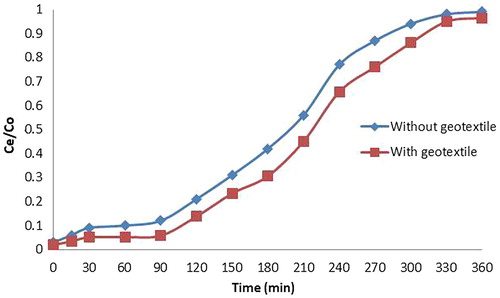
The column test was conducted with papaya leaf powder in geotextile material stitched into the column in two layers separated by a steel mesh covered using geotextile material. The flow rate was adjusted to be constant. The breakthrough curve was S shaped. The effluent concentration of copper was estimated using Atomic absorption Spectrophotometer. With the addition of geotextile material in between papaya leaf powder layer, there was an average increase of 12.66% removal of copper. The breakthrough curves for papaya leaf powder alone and biogeocomposite with papaya leaf powder for an initial concentration of 20 ppm is shown in .
Figure 7. Breakthrough curves for papaya leaf powder and biogeocomposite with papaya leaf powder for an initial concentration of 20 ppm.
3.5. Biogeocomposite with paddy straw powder
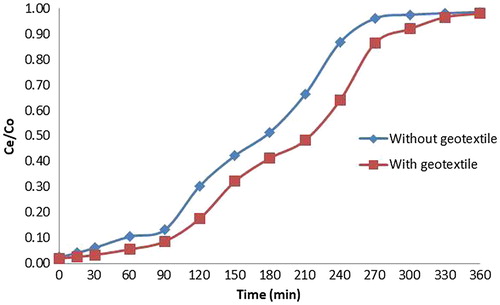
The column test was conducted with paddy straw powder in geotextile material stitched into the column in two layers separated by a steel mesh covered using geotextile material. The effluent concentrations of copper were measured using Atomic absorption Spectrophotometer. The breakthrough curve was S shaped. From the breakthrough curve given in , it can be seen that with the addition of geotextile material in between paddy straw powder layer, there was an average increase in 11.98% increase in percentage removal of copper.
Figure 8. Breakthrough curves for paddy straw powder and biogeocomposite with paddy straw powder for an initial concentration of 20 ppm.
3.6. Bio composites
Column was filled with alternate layers of papaya leaf powder and paddy straw powder and solutions of copper having known initial concentrations was passed through the column at constant rate. The breakthrough for the same is plotted in . The effluent concentration values of biocomposite material lies in between the values obtained for the two biomaterials, i.e. papaya leaf powder and paddy straw powder.
Figure 9. Breakthrough curve for biocomposite material for an initial concentration of 20 ppm.
3.7. Model studies
Various mathematical empirical models have been developed to predict the dynamic behaviour of the column. Yoon Nelson Model and Adam Bohart models were tested here to find the adsorption of copper for different initial concentrations of copper. The equation for the Yoon and Nelson model is given as
where k
YN is the Yoon Nelson rate constant, T is the time for 50% breakthrough concentration, C
o
is the initial concentration and C
e
is the effluent concentration. A graph is plotted with against time. k
YN and T can be find from the slope and intercept of the graph. The values of k
YN and T for all column studies are given in .The time required for 50% breakthrough, T decreased with increase in initial ion concentration. It is evident from the high values of correlation coefficients that Yoon and Nelson model fitted well to the experimental data.
Table 3. Yoon Nelson model parameters.
The Adam Bohart model given by Equation (2) is based on the assumption that the rate of adsorption is proportional to both the concentration of the adsorbing species and the residual capacity of the adsorbent.
where No is the saturation concentration (mg/ml), kAB is the Adam Bohart rate constant, H is the bed height and v is the linear velocity of influent solution. The correlation coefficient values of Adam Bohart model given in is less than that of Yoon and Nelson model which clearly indicates that Yoon and Nelson model fits the experimental data better. The validity of Adams-Bohart model is limited to the range of conditions used but provides a simple and comprehensive approach to running and evaluating sorption-column tests.
Table 4. Adam Bohart model parameters.
3.8. Comparison of experimental values with theoretical values
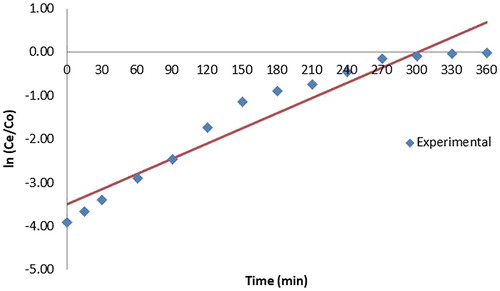
The theoretical values obtained from Yoon Nelson and Adam Bohart models were compared with experimental values. Figures – shows the comparison of model parameters with experimental values for an influent concentration of 20 mg/L. The theoretical curves and experimental curves are very close to each other for Yoon and Nelson model and the same is proved through the R2 values given in . The variation of experimental values for all adsorbents was more for Adam Bohart model than Yoon Nelson model parameters. This indicates that Yoon Nelson model better fitted with experimental values and the same is proved through the R2 values given in .
Figure 10. Comparison of experimental and predicted values by Yoon Nelson model for the adsorption of copper on biogeocomposite with papaya leaf powder.
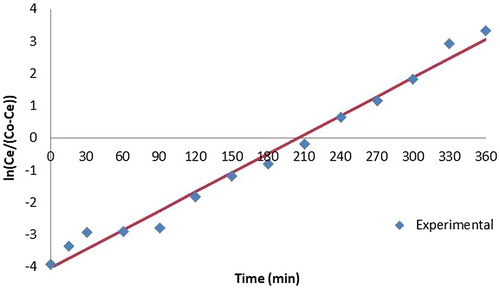
Figure 11. Comparison of experimental and predicted values by Yoon Nelson model for the adsorption of copper on biogeocomposite with paddy straw powder.
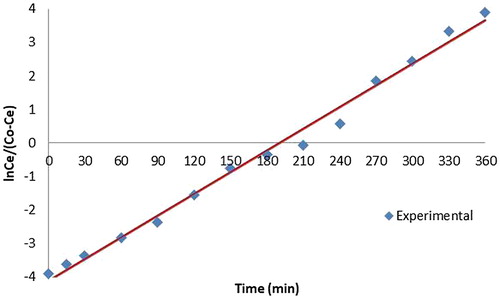
Figure 12. Comparison of experimental and predicted values from Adam Bohart model for the adsorption of copper on biogeocomposite with papaya leaf powder.
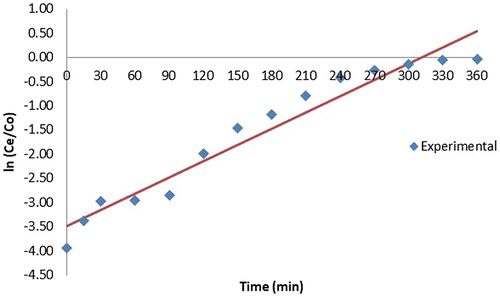
Figure 13. Comparison of experimental and predicted values from Adam Bohart model for the adsorption of copper on biogeocomposite with paddy straw powder.
4. Conclusions
Some of the important conclusions that can be drawn from the study are:
The breakthrough profile was S shaped for papaya leaf powder and paddy straw powder. Also as the initial metal (influent) concentration increased, the breakthrough time was reduced. Hence, percentage of adsorption depends on influent concentration.
The breakthrough time was found to be 120 min and 100 min corresponding to C e /C o value of 0.15 for an initial metal (influent) concentration of 10 mg/L for papaya leaf powder and paddy straw powder, respectively. The exhaust time for the same was found to be 310 min and 270 min, respectively, corresponding to C e /C o value of 0.9. Hence, papaya leaf powder is a better adsorbent as compared to paddy straw powder.
With the addition of geotextile material in between papaya powder layer, there was an average increase of 12.66% removal of copper. With the addition of non-woven geotextile layer in between the paddy straw powder, the average percentage removal of copper was increased by 11.98%.
The experimental data fitted well with Yoon and Nelson model than Adam Bohart model. Yoon-Nelson equation is a more descriptive equation as compared to Adam Bohart model that uses the experimental data to derive parameters used in the calculation. Hence, data obtained using Yoon and Nelson model is more precise and can be used for the successful design of column absorption process.
Disclosure statement
No potential conflict of interest was reported by the authors.
Notes on contributors
Geetha Verma. V is expertise in environmental engineering and an assistant professor in Department of Civil Engineering in New Horizon College of Engineering located in Bangalore, India. She has published widely on issues related with environmental monitoring and assessment and water pollution and treatment methods.
Anil Kumar Misra is expertise in Engineering Geology, Hydrology and Remote Sensing and working as an associate professor in Department of Geology in Sikkim University located in Sikkim state, India. He is actively involved in various research project related with building materials and construction, water resource management and remote sensing and continuously publishing on these areas.
Amit Srivastava is a expertise in Geotechnical Engineering and working as professor and dean for Faculty of Engineering and Technology in SGT University located in Gurugram, India. He has published widely on environmental geotechnology, concrete technology and water resources and actively involved in various research project related with environmental geotechnology.
References
- Babalola, J. O., N. A. A. Babarinde, V. O. Oninla, and O. A. Popoola. 2008. “Kinetics, Equilibrium, and Thermodynamics Studies of the Biosorption of Lead (II) and Chromium (III) by Basella Alba.” The Pacific Journal of Science and Technology 9 (2): 610–620. doi:http://www.akamaiuniversity.us/PJST.htm.
- Buasri, A., N. Chaiyut, K. Tapang, S. Jaroensin, and S. Panphrom. 2012. “Removal of Cu (II) from Aqueous Solution by Biosorption on Rice Straw – An Agricultural Waste Biomass.” International Journal of Environmental Science and Development 3: 10–14. doi:10.18178/IJESD.
- Chih-Huang, W., and W. Yu Chin. 2012. “Potential Low-cost Biosorbent for Copper Removal: Pineapple Leaf Powder.” Journal of Environmental Engineering 138 (3): 286–292. doi:10.1061/ASCE(EE)1943.7870.0000424.
- Degoutin, S., C. Saffre, D. Ruffin, M. Bacquet, and B. Martel. 2015. “Metallic Pollutant Removal in Leachates Extracted from Sediment by Geotextiles based on Cross Linked Bio-sourced Polymers.” Journal of water science 28 (1): 43–48. doi:10.7202/1030006ar.
- Druet, J., A. E. Achari, and J. Isaad. 2015. “Efficient Removal of Heavy Metals from Aqueous Solution by Chitosan Coated Geotextiles based on Polyethylene Terephthalate.” Research on Chemical Intermediates 41 (11): 8855–8876. doi:10.1007/s11164-015-1933-5.
- Dermentzis, K., A. Davidis, D. Papadopoulou, A. Christoforidis, and K. Ouzounis. 2009. “Copper Removal from Industrial Wastewaters by means of Electrostatic Shielding Driven Electro Deionization.” Journal of Engineering Science and Technology Review 2 (1): 131–136.
- Fenglian, Fu, and Wang Qi. 2011. “Removal of Heavy Metal Ions from Wastewaters: A Review.” Journal of Environmental Management 92 (3): 407–418. doi:10.1016/j.jenvman.2010.11.011.
- Hernáinz, F., M. Calero, G. Blázquez, G. Tenorio, and M. A. Martín-Lara. 2009. “Effect of the Presence of Chromium (III) on the Removal of Lead (II) from Aqueous Solutions by Agricultural Wastes.” Journal of Environmental Engineering 135 (120): 1348–1356. doi:10.1061/ASCEEE.1943-7870.0000096.
- Ho, Y. S. 2003. “Removal of Copper Ions from Aqueous Solution by Tree Fern.” Water Research 37: 2323–2330. doi:10.1016/S0043-1354(03)00002-2.
- Nwabanne, J. T., and P. K. Igbokwe. 2012. “Adsorption Performance of Packed Bed Column for the removal of Lead (II) using oil Palm Fibre.” International Journal of Applied Science and Technology 2 (5): 106–115.
- Sen, A., H. Pereira, M. A. Olivella, and I. Villaescusa. 2015. “Heavy Metals Removal in Aqueous Environments using Bark as a Biosorbent.” International journal of science and technology 12: 391–404. doi:10.1007/s13762-014-0525-z.
- Shelke, R. S., B. R. Madje, J. V. Bharad, and M. B. Ubale. 2009. “Adsorption of Nickel (II), Copper (II) and Iron (III) from Aqueous Solution using Ashoka Leaf Powder.” International Journal of Chem Technology & Research 1 (4): 1318–1325. doi:http://sphinxsai.com/CTVOL4/ct_pdf_vol.
- Siti Nur, A. A., S. I. Mohd Halim, Md Lias Kamal, and I. Shamsul. 2013. “Adsorption Process of Heavy Metals by Low-Cost Adsorbent: A Review.” World Applied Sciences Journal 28 (11): 1518–1530. doi:10.5829/idosi.wasj.2013.28.11.1874.
- Subramanian, S., E. Chockalingam, and J. J. Braun. (2010). “Studies on Acid Production Potential of Mine Tailings and Bioremediation of Acid Mine Water from an Abandoned Indian Copper Mine.” Proceedings of the XI International Seminar on mineral processing technology (MPT-2010), 933–945.
- Tang, Q., X. Tang, Z. Li, Y. Wang, M. Hu, X. Zhang, and Y. Chen. 2012. “Zn (II) Removal with Activated Firmiana Simplex Leaf: Kinetics and Equilibrium Studies.” Journal of Environmental Engineering 138 (2): 90–199. doi:10.1061/(ASCE)EE1943-7870.0000471.
- Tarun, K. N., P. Chowdhury, A. K. Bhattacharya, and S. K. Das. 2009. “Saw Dust and Neem Bark as Low-cost Natural Biosorbent for Adsorptive Removal of Zn (II) and Cd (II) Ions from Aqueous Solutions.” Chemical Engineering Journal 148: 68–79. doi:10.1016/j.cej.2008.08.002.
- Tijani, J. O., M. Musah, and I. Blessing. 2011. “Sorption of Lead (II) and Copper (II) Ions from Aqueous Solution by Acid Modified and Unmodified Gmelina Arborea (Verbenaceae) Leaves.” Journal of Emerging Trends in Engineering & Applied Sciences 2 (5): 734–740.
- Umesh, S., K. Abhishek, and K. Ankita. 2014. “Application of Geotextiles in Pavement Drainage Systems.” International Journal of Civil Engineering Research 5 (4): 385–390 http://www.ripublication.com/ijcer.htm.
- Vandenbossche, M., M. Casetta, M. Jimenez, S. Bellayer, M. Traisnel, and M. Trainsel. 2014. “Cysteine grafted non woven geotextile: A new and efficient material for heavy metals sorption-Part A.” Journal of Environmental Management 132: 107–112. doi:10.1016/j.jenvman.2013.10.027.
- Varma, G. V., and A. K. Misra. 2015. “Equilibrium and Kinetic Studies on the Adsorption of Copper onto Paddy Straw Powder.” Desalination and water treatment 57 (28): 13081–13090. doi:10.1080/19443994.2015.1057536.
- Varma, G. V., and A. K. Misra. 2016. “Equilibrium and Kinetic Studies on the Adsorption of Copper onto Carica Papaya Leaf Powder.” Membrane Water Treatment 7 (5): 403–416. doi:https://doi.org/10.12989/mwt.2016.7.5.403.10.12989/mwt.2016.7.5.403
- Venkateswarlu, P., G. V. Durga, N. V. Babu, and M. V. Rao. 2008. “Biosorption of Zn (II) from an Aqueous Solution by Erythrina Variegata Orientalis Leaf Powder.” International Journal of Physical Sciences 3 (9): 197–204.