
 ?Mathematical formulae have been encoded as MathML and are displayed in this HTML version using MathJax in order to improve their display. Uncheck the box to turn MathJax off. This feature requires Javascript. Click on a formula to zoom.
ABSTRACT
The estimation of the sustainability performance of products requires tools to provide systematic approaches to the definition of impacts, indicators and comparative scenarios from early design stages. This paper illustrates the Relative Assessment of Indicators in Sustainability Enhancement (RAISE) methodology that is based on the measure of negative impacts generated during any product life cycle stage. This approach includes a systematic process for the definition and evaluation of indicators to compare the sustainability performance of products considering each indicator individually and using a holistic index of sustainability to entail an overall comparison between products from manufacturing scenarios. The RAISE method is developed with the aim of assessing sustainability performance of product life cycle stages and incorporating this assessment into the decision-making process when comparing different manufacturing scenarios. A guitar capo manufactured in polymeric material is used as case study to demonstrate the use of the method. In this paper, only the manufacturing stage is considered; however, the method can also be employed in other stages of the life cycle.
1. Introduction
Nowadays, the concept of sustainability in the product development process is a very relevant topic, and in many cases, it is even considered with the same rigour than product functionality. Because of this, sustainability is a mandatory paradigm for designers and engineers involved in the process of product development (Luglietti et al. Citation2016). Also, the design for sustainability has received noteworthy attention among manufacturing companies due to the competitiveness associated with sustainable products, which are better rated compared to conventional products (Feng and Mai Citation2016). The need to include sustainability analysis in the product life cycle has led to the development of techniques for evaluating the sustainability performance of materials, manufacturing processes, logistics and tasks management. This implies the implementation of measurable sustainability parameters or indicators to compare manufacturing scenarios from early design stages for a robust decision-making process. The sustainability performance of products is commonly measured using indicators and indexes. These indicators or indexes are measurements related to the environmental, economic and social dimensions regarding material and energy consumptions, costs and social impacts among others. Sustainability indicators and indexes have a particular use. In the case of indicators, the aim is to provide a specific measurement of particular criteria or performance according to the designer and company objectives. In the case of indexes, its use is associated with a holistic and summarised value that comprises several indicators. Sustainability assessment methods commonly employ environmental, economic and social indicators selected depending on the type of product, the policies of the company and the criteria of the design team. Nevertheless, the establishment of indicators lacks a formal approach that provides a robust selection based on balanced, measurable, suitable and relevant criteria in the sustainability assessment. This issue can result in a selection of redundant indicators, the use of very complex processes to measure indicators and the subjectivity of indicators among others.
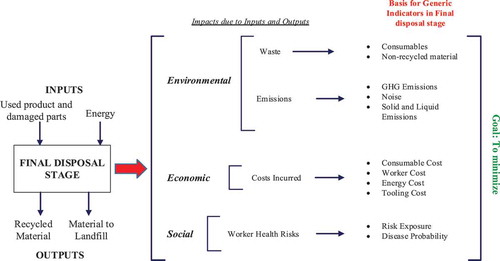
Figure 11. Inputs and outputs analysis for final disposal stage.
Despite the methodologies developed in the last decades, the sustainability performance of products and process is still a complex issue. This concern is sharpened due to the absence of a formal and globally accepted method to integrate the sustainability impacts of products in the decision-making process during early design stages (Hallstedt Citation2015). The vast majority of approaches for measuring the sustainability of products are strongly focused on life cycle assessment (LCA) methods (Lu et al. Citation2011), which provide a comprehensive analysis and impact assessment of all life cycle stages based on weighted criteria. However, the LCA methodology requires precise information about raw material processes, manufacturing, use and final disposal to measure sustainability adequately; this subject demands exhaustive work for designers and engineers who must collect and consolidate the required information. Another limitation of LCA-based methods is the preference of environmental issues instead of an integrated and holistic analysis of the overall sustainability performance. This issue and the uncertainty in the selection and definition of indicators impede the construction of generic methods for assessing sustainability.
The assessment methodology proposed in this paper aims to provide a systematic tool to determine the sustainability performance of products based on their impacts in any stage of the life cycle. The method includes a classification of indicators to simplify its selection based on the direct impacts on the environmental, economic and social dimensions; a graphical comparison between alternatives or scenarios and a holistic sustainability index calculated from the areas obtained in a graphical comparison.
Further sections of this paper are described as follows: Section 2 provides a brief overview and trends of the methods for product sustainability assessment and the indicators commonly employed in them. The classification of sustainability indicators employed in the method proposed is described in Section 3. The Relative Assessment of Indicators in Sustainability Enhancement (RAISE) method is explained in Section 4 taking into account its stages and tasks involved in each one. Section 5 describes the application of the method using a case study. The discussion of results and conclusions is presented in Sections 6 and 7, respectively.
2. Literature review
2.1 Methodologies for product sustainability assessment
Sustainability assessment of products is a relevant topic and involves many approaches, theories and even software-based tools (Moldavaska and Welo Citation2015). The existence of a variety of methodologies provides a wide range of perspectives and tools for the designer, who must evaluate and analyse several parameters for different alternatives to achieve a more sustainable product version. summarises the most important methodologies in the assessment of product sustainability reported in the literature taking into account authors, year of publication, study principle and sustainability dimensions considered by the work.
Table 1. Literature review analysis of assessment tools and methods.
As observed in , there exists a preference in the use of derived tools from LCA, fuzzy logic and risk assessment. Several authors such as Luglietti et al. (Citation2016), Lu et al. (Citation2011), Haapala, Rivera, and Sutherland (Citation2008) and Hur et al. (Citation2005) analyse the sustainability of products taking into account the stages of the life cycle and the impacts transferred among stages in the use of LCA. Feng and Mai (Citation2016) and Xing et al. (Citation2007) employ fuzzy logic for establishing weightings in the definition of criteria and indicators according to the needs and objectives during the design process. On the other hand, Palousis, Luong, and Abhary (Citation2010) and Howarth and Hadfield (Citation2006) measure sustainability indicators based on the risks associated with the product development. One of the most complete and holistic approaches is that proposed by Jawahir et al. (Citation2007), who developed a model focused on six design for X - DFX issues: disassembly, environment, recycling, social impact, functionality and resource utilisation and economy. Sala, Ciuffo, and Nijkamp (Citation2015) consider uncertainty models to assess the sustainability performance of products. Traditional approaches based on weighted weights are still under development such as the method proposed by Mohd Turan et al. (Citation2017).
The following issues can be summarised from the study of principles, sustainability dimensions and sustainability assessment approaches considered by the authors reported in :
The use of LCA is strongly used as study principle in the sustainability performance of products, despite being a tool primary oriented to evaluate the resource usage and environmental effects during the life cycle of a product. Through the grouping of LCA with both methodological tools and economic and social indicators, it is required to develop a robust method for assessing sustainability in products (Lu et al. Citation2011, Khan, Sadiq, and Veitch Citation2004; Senthil et al. Citation2003). The limitations of the LCA-based methods are related to the whole process of gathering, summarising and analysing information. This process can be very complex and tedious due to the need of determining indicators in each stage and the consolidation of results and posterior improvement assessment.
The use of weighting methods is also commonly employed, especially the weighted ratings and the fuzzy logic approach. These methods are recommended when it is necessary to focus on the performance regarding critical indicators that depends on the relative importance of the designer (Ghadimi et al. Citation2012; Khan, Sadiq, and Husain Citation2002). However, the complexity associated with many indicators available in literature and their relative importance based on human criteria tends to address an unbalanced assessment of the three main sustainability dimensions.
Risk assessment is recognised as an objective and rigorous approach because it is strictly related to the risks incurred during any stage of the product life cycle (Howarth and Hadfield Citation2006). This approach provides useful information about the risk generated in environmental, economic and social dimension. Due to this fact, it is easier to concentrate efforts on reducing the risk of those indicators that are easily identifiable, understandable and measurable.
Regarding the balance between sustainability dimensions, not all authors consider the three dimensions of sustainability. The literature review reveals that just a few authors consider the economic and social dimensions. This unbalanced consideration implies the preferred use of environmental indicators, which dismiss the importance of economic and social dimensions.
2.2 Sustainability indicators
An indicator is defined as a single parameter used to measure the condition of an aspect of a system (Sarkar et al. Citation2011). Sustainability indicators are then defined as the parameters used to measure the sustainability performance of a product, system or process. The need of establishing a set of sustainability indicators is a key factor in assessing, comparing and improving the sustainability performance of products, especially from early design stages, in which the sustainability impact of products and services can be determined (Bogue Citation2014).
summarises the most common indicators employed in the sustainability measurement of products from five authors who consider the three dimensions of sustainability and different life cycle stages.
Table 2. Sustainable indicators in manufacturing stage.
According to , a very diverse list of indicators is available in the literature. Some indicators are common among authors, especially the environmental indicators such as material consumption, material cost and emissions. On the other hand, many indicators exist that are very specific and depend on the author criteria, company policies and the type of product, for example, customer privacy, gender equity or human rights. The heterogeneity of all indicators available makes very complex the process of selecting indicators for sustainability assessment. This heterogeneity may result in the selection of an unbalanced and inaccurate set of indicators that do not represent the actual sustainability performance of the product. Therefore, the databases of indicators are very useful for the selection of indicators, but it is necessary to select carefully the indicators based on the specific context of the assessment process.
Another way to measure sustainability is to use an index or composite indicators, which are a calculated number that summarises the overall performance considering values of particular indicators in a specific scenario. Some of the most relevant sustainability indexes are product sustainability index (Jawahir et al. Citation2006), ecological footprint and direct material consumption; ReCiPe indicators; and energy-related key performance indicators. Due to the diversity and amount of possible sustainability indicators, some organisations have created databases that provide set of indicators and indexes related to measure the sustainability. These organisations include the Global Reporting Initiative (GRI) (GRI Citation2013) which provides 91 sustainability indicators for measuring both positive and negative impacts on the environment, society and the economy. GRI aims to enable a robust decision-making process applicable to any organisation around the world. Another one is the Organization for Economic Co-operation and Development (OECD) (OCED Citation2001) which proposes 18 sustainable manufacturing indicators associated with the measurement of environmental impact of single facilities (e.g. site, office, factory). EUROSTAT (EUROSTAT Citation2017) also recommend 15 sustainable consumption and production indicators based on the 17 Sustainable Development Goals. Despite the standardisation and formal approach proposed in these set of indicators, none of them is globally accepted as a generic set to assess sustainability performance in products; the organisations are focused on the measurement of sustainability for facilities, locations and projects.
Particularly, in the case of social indicators, it is possible to identify a common trend focused on health, safety and well-being for worker and community. summarises the most common social indicator approaches concerning the industrial environment which includes material production and product manufacturing. According to , it is possible to identify common trends regarding (1) labour children participation, excessive working time and forced labour among; and (2) illnesses, injuries and accidents during work time, days away from work and health risk associated to working tasks. Other social issues which are oriented to worker well-being and compensation, community and environmental-related topics are considered as well.
Table 3. Common social indicators concerning sustainability.
A vast majority of social indicators listed in depend on the regional context, the type industry and company policies. Therefore, it is complex to define a globally accepted set of social indicators to assess sustainability. Technical indicators related to measurable impacts such as illness probability and health issues from hazardous emissions can be assessed. However, indicators such as child labour and forced labour require a survey based on secondary information sources to obtain data for further analysis.
3. Proposed classification of indicators
The literature review with respect to product sustainability assessment provides a broad perspective of all the possible indicators that can be used to measure sustainability; however, this variety and amount of indicators can be confused and makes challenging the selection of suitable indicators. For this reason, two main categories of sustainability indicators can be proposed based on the sustainability impacts on product development, according to the sets of indicators proposed by Ma and Kremer (Citation2015), Amrina and Lutfia Vilsi (Citation2015), Kim, Kara, and Kayis (Citation2014), and Jawahir et al. (Citation2006):
Direct indicators: These indicators can be measured quantitatively. They are generic for any product, and their values depend exclusively on the nature of the product and the resources involved.
This category of indicators depends on the type of constructive materials of the product and the processes involved in its transformation or manipulation across the life cycle. Examples of these indicators in the environmental dimension are energy consumption, waste generation, the quantity of hazardous materials and similar indicators. In the case of economic dimension, material cost, energy cost, labour cost and others. Moreover, risk and health condition of the worker in the social dimension.
(2) Indirect indicators: This category comprises corporate indicators that are not directly measurable from the identification of the direct impacts on the product life cycle. They require gathering and analysis of corporate information such as surveys, questionnaires, human resources studies, among others. These indicators are mainly employed to measure the satisfaction of the workers and users involved in any stage of the product life cycle and also the degree of compliance according to the well-being, participation, human rights and legal regulations associated with corporate social and environmental responsibility. Mainly, indirect indicators are related to economic and social dimensions. Some examples of these indicators are the degree of satisfaction of the workers in the manufacturing, material production or product disposal, the positive reviews or the number of complaints from the customer, the ethical participation into the company and training degree of workers among others.
This classification of indicators aims to differentiate indicators based on technical information derived exclusively from the product life cycle and indicators based on subjective sources. The RAISE method proposed in this paper is oriented to direct indicators due to the universality of transformation process regarding the life cycle of products.
4. Proposed method
The RAISE method is an iterative approach based on the measurement and analysis of direct indicators associated with the negative impacts generated during the product life cycle. The method consists of five stages: (1) identification of negative impacts and generic indicators, (2) selection of specific indicators, (3) product evaluation, (4) normalisation and display of results, and (5) overall sustainability performance measurement (see ).
Figure 1. RAISE method stages and outputs.
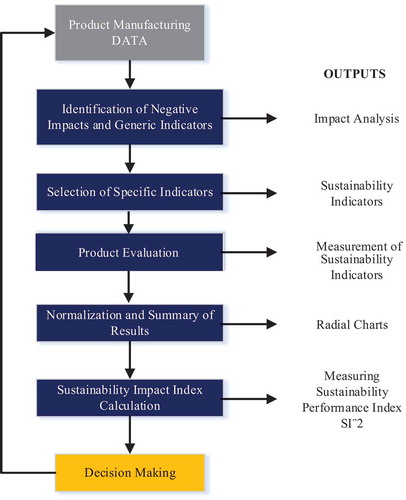
Each step of the RAISE method is explained in detail below, and the implementation of each stage is described in the next section through a case study. In this paper, the RAISE method is presented only for direct indicators; nevertheless, indirect indicators can be considered if the corporate information is available. The case study is focused on negative impacts during the manufacturing stage, but the RAISE method is not limited to this stage of the life cycle, and it can be even developed considering an LCA approach for analysing global sustainability impacts. In the latter case, a great deal of information is required regarding the use and recycling of the product.
4.1 Determination of negative impacts and generic indicators
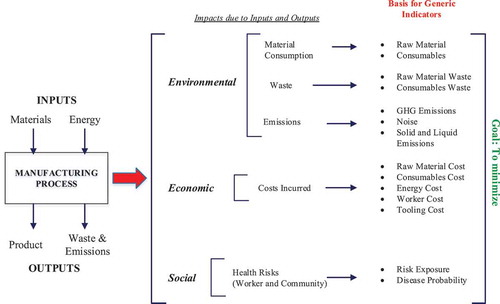
The first step of RAISE method is the identification of sustainability negative impacts and generic indicator. Sustainability negative impacts are defined as the non-desirable impacts associated with emissions, consumptions, waste generation, costs and health risks (e.g. the generation of NOx and SOx in the manufacture of any product is a negative impact regarding air quality and worker health). A generic indicator is defined as a basic indicator relevant to any product life cycle stage regardless of the type of product (e.g. the raw material waste is the amount of waste material obtained after a manufacturing process, this generic indicator applies for any machined, sintered, moulded and assembled product). After the establishment of generic indicators, specific indicators which define the measurement units can be established according to the particular case study. These specific indicators are employed in the RAISE methodology to measure and compare the sustainability performance of products. shows the impacts and generic direct indicators that are generated from any manufacturing process. This analysis of impacts must be verified with the particular case under study.
Figure 2. Generic impacts and direct indicators for sustainability in a generic manufacturing process.
4.2 Selection of specific indicators
Once the generic indicators are identified, they are discretised in specific indicators that can be measured quantitatively and qualitatively and include the measurement units. shows a list of recommended specific indicators and their conventional measurement units. This list of indicators is based on the set of direct generic indicators obtained from the negative impacts mentioned previously in . It should be noted that it is possible to add indirect indicators if the necessary information is available (corporate social reports or surveys). The recommended indicators are shown taking into account the need for a balanced assessment of environmental, economic and social dimensions.
Table 4. Specific indicators for measuring sustainability in manufacturing processes.
The set of indicators proposed in this method aims to provide an objective perspective to measure sustainability in any manufacturing process regardless of the manufacturing technology and context. Commonly, sustainability indicators are selected based on contextual issues and stakeholders interest, which increases the complexity concerning the robust selection of suitable indicators (Niemeijer and De Groot Citation2008). Therefore, the RAISE method is suggested as an objective sustainability assessment method centred on the material and energy flows applicable to any transformation process.
In the case of direct social indicators, a particular scale is proposed. The description of this scale is shown in Section 4.2.3.
The set of indicators proposed in the RAISE method is described below according to sustainability dimensions.
4.2.1 Environmental indicators
Environmental indicators are directly associated with the use of material and energy resources during the manufacturing process. These indicators are measured in mass and energy units (e.g. kg and MJ) for material consumption and energy consumed in the manufacturing process, respectively. Nevertheless, it is also possible to use indicators based on efficiency, such as the mass fraction of waste from raw material or consumable. In the latter case, the per cent of waste is measured by the amount of raw material required in the process. The chosen indicators can be expressed as relative measurements of the material consumption, and this decision depends on the user criteria.
4.2.2 Economic indicators
The proposed economic indicators refer to all possible cost involved in the consumption of material and energy, the cost of the workforce, machinery and tooling. All the indicators in this dimension are expressed in monetary units (USD) to homogenise the measurements. Other costs that can be considered are those derived from the management process, risks mitigation, marketing and campaigns related to the product development; however, those costs are considered indirect indicators in the proposed method.
4.2.3 Social indicators
The set of specific indicators associated to the social dimension in the RAISE method is focused on the health of the worker and the community considering these as the direct indicators with major relevance over aspects such as well-being, comfort and life expectancy of people. The RAISE method supports the measurement of risk exposition following the values obtained from the analysis and risk evaluation stipulated in the standard ISO 31000: 2009. Under this standard, severity and incidence probability of accidents is determined using numerical scales. The following is a list of the most common hazards in manufacturing (OSHA Citation2017):
Biological: Related to the use or contact with blood and other body fluids, fungi, bacteria, viruses, insect bites, plants, animal and bird droppings.
Chemical: Related to the physical, chemical and toxic properties of the substances. This category includes liquids, vapour, fumes, gases, pesticides, flammable and volatile materials.
Ergonomic: Related to repetitive movements, improper set up of the workstation, frequently lifting, poor postures and vibration.
Physical: Related to radiation, magnetic fields, X-ray, pressure extremes, noise and electrical hazards.
Safety: Related to slipping/tripping hazards, inappropriate machine guarding, equipment malfunctions or breakdowns.
On the other side, the probability of disease is measured regarding a five-level scale. This evaluation must be developed considering whether the relationship between manufacturing processes, materials and energy involves a disease acquisition propensity in workers and the community. shows the values for risk exposure. For better understanding and objectivity in these measurements, it is recommendable to keep a record of features for the manufacturing process and materials employed involved in the product development and posterior stages of its life cycle.
Table 5. Social direct indicators: risk exposure.
Values for disease acquisition probability are classified into five categories using a quantitative scale: almost certain (5), likely (4), possible (3), unlikely (2) and rare/remote (1).
It is highly recommended to take into account a balance between the numbers of indicators selected in each dimension to analyse sustainability from a holistic perspective. However, each case study will have its particular characteristics, and the number of indicators required will depend on corporate or user criteria, whereby the selection of indicators is unique and particular for each case study. The indicators shown in are recommendations based on the analysis of previous works and the identification of adverse impacts in the manufacturing process.
4.3 Product evaluation
The chosen specific indicators are measured in a particular reference product establishing the impact of its manufacturing process over the environmental, economic and social dimensions. This initial measurement in the reference product is known as the diagnosis since it determines the initial sustainability performance of the product. In the same way, the evaluation of product alternatives is carried out taking into account the same specific indicators employed in the diagnostic.
4.4 Normalisation and summarising
The RAISE method proposes to compare the results between the reference product and the alternatives through a radial chart. For this, it is necessary to normalise the obtained values of specific indicators in both reference measurement (diagnosis) and alternatives measurement. This procedure is realised taking into account whether each indicator increases or decreases in the reference value of the diagnostic. Due to the measurement of negative impacts, the ideal improvement is the reduction of all specific indicators to zero. It is possible that specific indicators can reach values above 100% after normalisation. This situation can hinder the visualisation of the radial chart with respect to the indicators values of the reference product and manufacturing scenarios, resulting in large graphical scaling differences for product manufacturing. Hence, it is recommended to employ logarithmic scales for the graphical axles to obtain a suitable visualisation of the comparison on the radial chart.
4.5 Sustainability impact index (SI2)
The total area of the polygon generated in the radial chart is proposed as a composite index that involves environmental-, social- and economic-specific indicators. The proposed index is called sustainability impact index or SI2 (see Eq. (1)), and it can be measured in each dimension or portion of the radial chart, or as a holistic total measurement.
where SI2 is the sustainability impact index, x1 is the x coordinate of vertex 1 and yn is the y coordinate of the nth vertex. Equation (1) provides an easy way to calculate the area of any polygon from the X, Y coordinates of all vertices comprising the polygon. shows the generic calculation procedure for a four vertices polygon.
Figure 3. Area calculation for four vertices polygon.

Another way to measure the area of the polygons is by CAD software in which the measurement results very easy and practical.
5. Case study
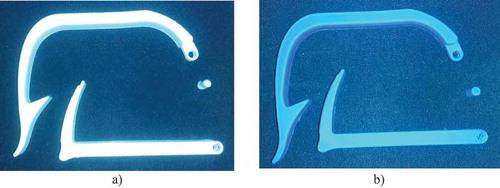
The methodology proposed above is illustrated using the manufacturing of a guitar capo (see ) as a case study considering the manufacturing stage and direct indicators only. The guitar capo is manufactured initially in high-density polyethylene (HDPE) through a plastic injection process. This initial product is known as the reference product in the proposed approach. It is important to clarify that the functionality of the product is not modified during the implementation of the RAISE method, which is focused on the sustainability performance improvement.
Figure 4. Guitar capo model: (a) top view; (b) isometric view.
To demonstrate the RAISE applicability and benefits, two manufacturing scenarios for the capo are analysed assuming changes in the material and manufacturing process. The new manufacturing scenarios employ additive manufacturing process. Manufacturing scenario 1 uses acrylonitrile butadiene styrene (ABS) material, and manufacturing scenario 2 uses polylactic acid (PLA). The stages of the RAISE method are implemented below for the reference product versus the manufacturing scenarios proposed.
shows the 3D printed models of the guitar capo for the new manufacturing scenarios. Once the product reference and manufacturing scenarios are well established, it is possible to continue with the generation of generic and specific indicators.
Figure 5. Manufactured guitar capo: (a) guitar capo manufactured in PLA; (b) guitar capo manufactured in ABS.
The implementation of RAISE method is developed in further sections as follows: (1) negative impacts and generic indicators are established according to the current manufacturing scenario (reference product) and material and energy flow analysis. (2) The specific indicators are established from generic indicators. (3) The product evaluation is developed for all manufacturing scenarios considered. (4) Evaluation results are normalised and summarised into radial charts, and finally, (5) an overall sustainability impact measurement is calculated using the sustainability impact index (SI2).
5.1 Negative impacts and generic indicators
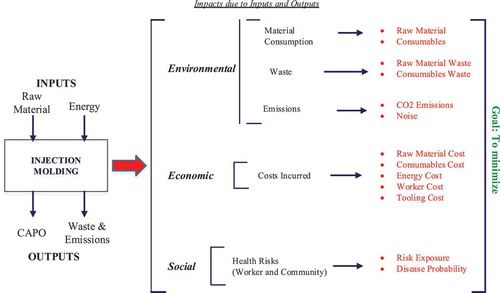
The negative impacts associated with the manufacturing process of the guitar capo for the reference product are shown in . Generic indicators are identified from the attributes of the manufacturing process. Depending on the differences between the manufacturing scenarios, these generic indicators can vary. In this case, the direct generic indicators are established taking into account the characteristics and properties of the polymer through injection and 3D printing.
Figure 6. Generic impacts and indicators in the manufacturing of a guitar capo through injection moulding.
5.2 Selection of specific indicators
The specific indicators are selected from and are described with their measurement units in . It is recommended to describe each indicator to avoid confusions and redundant measurements. The amount and type of specific indicators employed must be balanced according to the sustainability concept including environmental, economic and social issues. In the case under consideration, four environmental-specific indicators, three economic-specific indicators and five social-specific indicators are used.
Table 6. Specific indicators and values for guitar capo.
5.3 Product evaluation
The evaluation of the specific indicators is carried out using material and process properties obtained from literature review and CES Selector® software databases (commercial software package for material and manufacturing process selection https://www.grantadesign.com/es/products/ces/. Product reference and manufacturing scenarios 1 and 2 are assessed to develop a consistent comparison of sustainability using the same set of specific indicators shown in .
Table 7. Manufacturing scenarios attributes for calculation of specific indicators.
The measurement of specific indicators requires many different sources, and the use of database software is recommended at this stage. Direct impacts facilitate the analysis of indicators, whose data can be obtained from online databases and materials books and journals. Some databases such as the Repository of Sustainable Manufacturing Indicators (Sarkar et al. Citation2011) and the Product Environmental Performance Indicators are also recommended (Singh, Goodyer, and Popplewell Citation2007). shows the relative values of specific indicators for product reference and manufacturing scenarios. The values of specific indicators for each product alternative were calculated using the CES Selector® Software, which provides environmental, economic and social measurements for materials and manufacturing processes. shows in detail the calculation parameters to obtain the values of specific indicators for each manufacturing scenario.
The estimated worker cost is projected assuming the overhead ratio for workforce taking into account the manufacturing time for injection moulding and fused deposition methods. For manufacturing the guitar capo, the estimated time is assumed as 6 min (0.1 h) and 18 min (0.3 h) for injection moulding and fused deposition modelling, respectively. The cost per hour of technician is assumed as 20 USD/h.
Specific indicators for risks exposure and disease probability were assessed using technical information according to each alternative (manufacturing material) and measurement scales proposed in .
5.4 Normalising and summarising
The values obtained in the previous step are normalised with respect to the reference product. The quantities of the specific indicators are converted in dimensionless numbers that provide a better understanding of the changes on the reference product. summarises the normalised values of the reference product and manufacturing scenarios considered.
Table 8. Relatives values of specific indicators for product reference and alternatives.
Table 9. Normalised values for reference product and manufacturing scenarios.
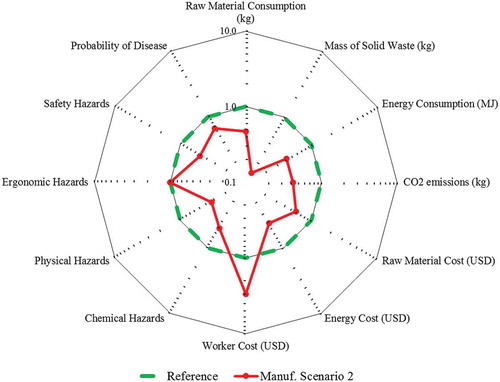
The normalised values are displayed in using a linear scale. The regular polygon with green layout corresponds to the reference product, and the blue and red polygons correspond to the manufacturing scenarios 1 and 2, respectively. The designer in the RAISE method aims to reduce the negative impacts. In other words, the aim is to reach the minimum possible area. However, in some cases, it is impossible to improve indicators without worsening others. In , manufacturing scenarios 1 and 2 have important reductions over environmental indicators, but other economic indicators were affected. For a better understanding of the radial chart, it is highly recommended to analyse each comparison separately. and show the contrast between the reference product and manufacturing scenarios 1 and 2, respectively. These radial charts are displayed using a logarithmic scale aiming to provide a better visualisation of the performance of the indicators.
Figure 7. Radial chart comparison of reference product and manufacturing scenarios 1 and 2 (linear scale).
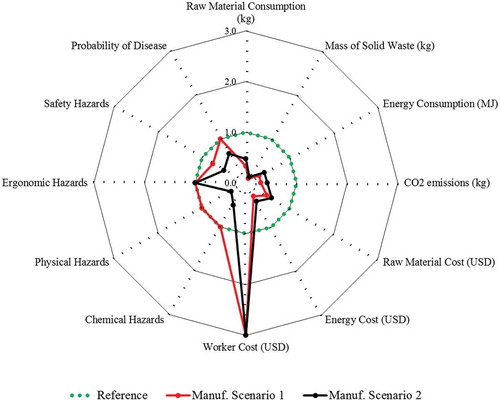
Figure 8. Radial chart comparison between reference product and manufacturing scenario 1 (logarithmic scale).
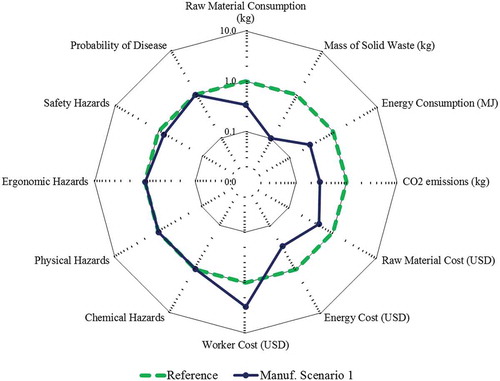
Figure 9. Radial chart comparison between reference product and manufacturing scenario 2 (logarithmic scale).
5.5 Calculation of sustainability impact index (SI2)
The SI2 is measured for the reference product and manufacturing scenarios 1 and 2. The results of the areas, the percentage changes of areas, and the improved and worsened indicators are summarised in . This kind of summary is recommended to support the further decisions of the engineering design department. If the change of area in the scenarios represents a decrease, then the manufacturing scenarios offer a better sustainability performance; nevertheless, the worsened indicators should be monitored or targeted in further manufacturing scenarios. In the case of critical indicators, the decision-making is a responsibility of the designer.
Table 10. Sustainability impact index measurement.
Analysing the case study, the best manufacturing scenario according to the SI2 is manufacturing scenario 2, which offers a reduction of the SI2 of 44.7% on the reference product; however, the worker cost and raw material impacts are higher in this scenario. Manufacturing scenario 1 also showed a very important reduction of 34.5% with only one worsened indicator related to the worker’s cost. The further use of weighted ratings considering different importance levels in the indicators will help the decision-making when critical indicators are worsened despite achieving a better SI2 value.
6. RAISE in life cycle
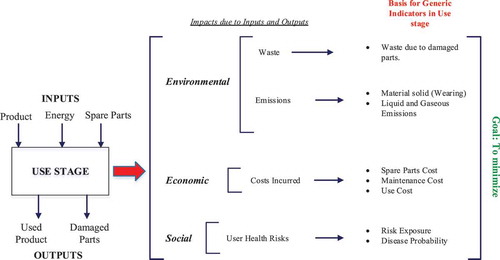
The RAISE method can be employed in different life cycle stages such as use and final disposal. The analysis of generic impacts can be performed in both stages taking into account the direct indicators. A generic input–output analysis is shown in and concerning use and final disposal, respectively. It is essential to clarify the basis for generic indicators vary due to the inputs and outputs of each stage. The user is critical in the case of use stage; meanwhile, the worker in the case of final disposal. Despite the suitability for the implementation of RAISE method in further life cycle stages, the most relevant impacts in the reduction of sustainability impact can be reached from early design and product development phases (Figure 11).
Figure 10. Inputs and outputs analysis for use stage.
7. Future work
The proposed method is developed to establish the first approach in the measurement of relative sustainability performance among different scenarios of product manufacturing taking into account the negative impacts. According to the literature review and the tasks developed in the method proposed, the following research opportunities were identified:
To consider weighted rating methods such as weighted sum model, analytical hierarchical process (AHP) or fuzzy AHP to establish the relative importance of environmental, economic and social dimensions. The RAISE method described in this work does not consider weighted ratings in the assignment of indicators importance.
To establish correlations and perform sensibility analysis between sustainability indicators to determine the most influential indicators in the decision-making process. The increase or decrease of a sustainable indicator can affect the overall sustainability performance of the product significantly.
To develop software tools dedicated to measuring relative sustainability based on the RAISE method to facilitate the calculation of specific indicators, the SI2 index and the graphical comparison between the manufacturing scenarios considered.
The integration of database software and the establishment of direct indicators provide a faster and integrated measurement of sustainability. Nevertheless, the selection and measurement of indirect indicators using software is still a challenging task which involves very particular contextual issues according to each of the company’s objectives. Despite the use of direct indicators, the consideration of indirect indicators related to social issues involves higher complexity during decision-making tasks associated with subjective topics that do not depend on the material and energy flows in the transformation process such as material production, manufacturing and recycling.
The analysis of materials and manufacturing processes is critical to developing approaches such as RAISE method. Emissions, material and energy consumptions, CO2 footprint need to be estimated accurately to ensure a robust measurement of the sustainability performance.
8. Conclusions
The RAISE method provides a methodological and simplified approach for assessing sustainability performance taking into account specific indicators and a global index (SI2). The steps of the method were established based on the measurement of the negative impacts of the product during the manufacturing stage, the selection and normalisation of the values obtained in the selected indicators and the comparison of sustainability performance through graphical and geometrical tools. The method is proposed initially to measure relative sustainability in the manufacturing stage; however, the application can be extended to all life cycle stages considering a consistent set of indicators and the requirements of the designer. It is recommended to maintain equal value for the three dimensions for the analysis of sustainability performance to avoid the bias commonly found in the literature that provides more emphasis to the environment. The assumption of an equal distribution of importance for all criteria was made in this work; nevertheless, the evaluation of scenarios with weighted ratings in the measurement of indicators can also be added to the method through fuzzy logic tools, surveys or heuristic designer criteria. The classification and definition of types of indicators presented in this paper serve as a basis for the standardisation of sustainability performance in product and services. Indirect indicators can be added to the RAISE method if the information and data are available from the manufacturing company.
Appendix includes two application forms for the implementation of the RAISE method (Tables 11 and 12). The aim of Appendix is to facilitate the data management during the implementation of RAISE method from the selection of specific indicators to the holistic sustainability analysis concerning comparison and improvement assessment. RAISE form I involves the specific indicators measurement and comparison; on the other hand, RAISE form II includes the radial chart comparison and holistic sustainability analysis. Forms proposed are suitable for further modifications if the user requires it.
Acknowledgments
This work was partially supported by COLCIENCIAS through the Ph.D. National Scholarship Program No 617-2. Contract UN-OJ-2014-24072, and by the office of the Engineering Technology and Commonwealth Engineering at Penn State University.
Disclosure statement
No potential conflict of interest was reported by the authors.
Additional information
Funding
Notes on contributors
Jaime Mesa
Jaime A. Mesa was born in Tierralta, Colombia in 1988. He received the B.E degree in Mechanical Engineering from the Universidad Pontificia Bolivariana, Montería, Colombia in 2010. In addition, he obtained the Master of Science degree in Mechanical Engineering from the Universidad del Norte, Colombia in 2013. Currently, Jaime is a PhD Candidate in Mechanical Engineering at the same university sponsored by the PhD Scholarships program of Colciencias.In 2010, he joined the Department of Mechanical Engineering, Universidad del Norte as Instructor. In 2013 he was Assistant Professor at Universidad Pontificia Bolivariana. Lately, the worked as instructor in the Department of Mechanical Engineering at the Universidad del Norte as Instructor and researcher from 2014 to 2017. His current research interest include Product Design Methods, Design of Sustainable Products, Persuasive Design, Lifecycle assessment, Engineering Education, Failure Analysis among others.
Iván Esparragoza
Dr. Ivan Esparragoza obtained his bachelor degree in Mechanical Engineering in 1987 from Universidad del Norte in Colombia. He completed his MSc and PhD in Mechanical Engineering at Florida International University in 1993 and 1998 respectively. Dr. Esparragoza spent three years as Visiting Assistant Professor in the Department of Mechanical Engineering at Florida International University. In 2001, he joined the Pennsylvania State University - Brandywine Campus as an Assistant Professor of Engineering where he is currently a Professor and the Director of Engineering Technology and Commonwealth Engineering. Dr. Esparragoza has a strong interest in engineering education, design, sustainability, and global collaboration. He has published several papers in those areas in conference proceedings and technical journals. As a scholar, he has received several recognitions for his excellence in engineering education including the Penn State Brandywine Distinguish Teaching Award (2014), International Engineering Educator Honoris Causa “Ing.Paed.IGIP.h.c.” in 2012, and the prestigious The Pennsylvania State University Teaching Fellow Award in 2009. Dr. Esparragoza also has a solid record of service to professional organizations. He was involved with the Latin American and Caribbean Consortium of Engineering Institutions (LACCEI) for 12 years where he served as VP for Region I, VP of Research, VP of Finances and member of the Administrative Board. In the American Society for Engineering Education (ASEE), he served on the Board of the International Division, and in the International Federation of Engineering Education Societies (IFEES), he served as VP for the Americas and First VP.
Heriberto Maury
Dr. Heriberto Maury obtained his bachelor degree in Mechanical Engineering in 1988 from Universidad del Norte in Colombia. He completed his PhD in Mechanical Engineering at Universidad Politécnica de Cataluña Spain in 2000. Dr. Heriberto has been Faculty member in the Department of Mechanical Engineering at Universidad del Norte, Barranquilla Colombia, since 1995 – Also, during this time Dr. Maury has been visiting professor, in some Universities, for seasonal periods as the Universidad de Magallanes, Chile. He has a strong interest in the following research subjects: Engineering education, Engineering Design, sustainability, and Structural Integrity. He has published several papers in those areas in conference proceedings and technical journals. As a scholar, he has received several recognitions for his academic excellence in (2008), winner of the innovative teaching prices in 2007 and 2009 at the Universidad del Norte, Winner in DAAAM 2010 of FESTO PRICE, Austria to the best paper. In addition, he has been the author of several patents in technological developments.
References
- Alsaffar, A. J., K. Raoufi, K.-Y. Kim, G. E. Kremer, and K. R. Haapala. 2016. “Simultaneous Consideration of Unit Manufacturing Processes and Supply Chain Activities for Reduction of Product Environmental and Social Impacts.” Journal of Manufacturing Science and Engineering 138 (1): 101009–1 to 101009–18. doi:10.1115/1.4034481.
- Amrina, E., and A. L. Vilsi. 2015. “Key Performance Indicators for Sustainable Manufacturing Evaluation in Cement Industry.” Procedia CIRP 26: 19–23. doi:10.1016/j.procir.2014.07.173.
- Bao, H. P., and S. Bodapati. 2011. “Development of Sustainable Indicators for Products and Processes.” Proceedings of the ASME 2011 International Design Engineering Technical Conferences & Computers and Information in Engineering Conference, Washington, DC, August 28–31. doi:10.1115/DETC2011-48273.
- Berardi, U. 2011. “Sustainability Assessment in the Construction Sector: Rating Systems and Rated Buildings.” Sustainable Development 20 (6): 422–424. doi:10.1002/sd.532.
- Bogue, R. 2014. “Sustainable Manufacturing: A Critical Discipline for the Twenty-First Century.” Assembly Automation 34 (2): 117–122. doi:10.1108/AA-01-2014-012.
- De Silva, N., I. S. Jawahir, O. Jr. Dillon, and M. Rusell. 2009. “A New Comprehensive Methodology for the Evaluation of Product Sustainability at the Design and Development Stage of Consumer Electronic Products.” International Journal of Sustainable Electronic Products 1 (3): 251–264. doi:10.1504/IJSM.2009.023973.
- Dewulf, J., L. Mancini, G. A. Blengini, S. Sala, C. Latunussa, and D. Pennington. 2015. “Toward and Overall Analytical Framework for the Integrated Sustainability Assessment of the Production and Supply of Raw Materials and Primary Energy Carriers.” Journal of Industrial Ecology 19 (6): 963–977. doi:10.1111/jiec.12289.
- Eastwood, M. D., and K. R. Haapala. 2015. “A Unit Process Model Based Methodology to Assist Product Sustainability Assessment during Design for Manufacturing.” Journal of Cleaner Production 108: 54–64. doi:10.1016/j.jclepro.2015.08.105.
- EUROSTAT. Official Website of EUROSTAT. 2017. Accessed April 10 2017. http://ec.europa.eu/eurostat.
- Feng, C., and Y. Mai. 2016. “Sustainability Assessment of Products Based on Fuzzy Multi-Criteria Decision Analysis.” International Journal of Advanced Manufacturing Technology 85 (1–4): 695–710. doi:10.1007/s00170-015-7978-1.
- Ghadimi, P., A. H. Azadnia, M. Y. Noordin, and M. Z. Mat Saman. 2012. “A Weighted Fuzzy Approach for Product Sustainability Assessment: A Case Study in Automotive Industry.” Journal of Cleaner Production 33: 10–21. doi:10.1016/j.jclepro.2012.05.010.
- GRI. 2013. “Global Reporting Initiative. G4 Sustainability Reporting Guidelines.” Accessed April 10 2017. https://www.globalreporting.org/resourcelibrary/GRIG4-Part1.
- Haapala, K., J. L. Rivera, and J. W. Sutherland. 2008. “Application of Life Cycle Assessment Tools to Sustainable Product Design and Manufacturing.” International Journal of Innovative Computing, Information & Control 4 (3): 577–591.
- Hallstedt, S. I. 2015. “Sustainability Criteria and Sustainability Compliance Index for Decision Support in Product Development.” Journal of Cleaner Production 140: 251–266. doi:10.1016/j.jclepro.2015.06.068.
- Hemdi, A. R., M. Z. Mat Saman, and S. Sharif. 2011. “Sustainability Evaluation Using Fuzzy Interference Methods.” International Journal of Sustainable Energy 32 (3): 169–185. doi:10.1080/14786451.2011.605947.
- Howarth, G., and M. Hadfield. 2006. “A Sustainable Product Design Model.” Materials and Design 27 (10): 1128–1133. doi:10.1016/j.matdes.2005.03.016.
- Hur, T., J. Lee, J. Ryu, and E. Kwon. 2005. “Simplified LCA and Matrix Methods in Identifying the Environmental Aspects of a Product System.” Journal of Environmental Management 75: 229–237. doi:10.1016/j.jenvman.2004.11.014.
- Jawahir, I. S., O. W. Dillon Jr., K. E. Rouch, K. J. Joshi, A. Venkatachalam, and I. H. Jaafar. 2006. “Total Life-Cycle Considerations in Product Design for Sustaianbility: A Framework for Comprehensive Evaluation.” 10th International Research/Expert Conference “Trends in the Development of Machinery and Associated Technology TMT, Barcelona, Spain, September 11–15.
- Jawahir, I. S., K. E. Rouch, O. W. Dillon, L. Holloway, and A. Hall. 2007. “Design for Sustainability (DFS): New Challenges in Developing and Implementing a Curriculum for Next Generation Design and Manufacturing Engineers.” International Journal of Engineering Education 23 (6): 1053–1067.
- Khan, F. I., R. Sadiq, and T. Husain. 2002. “GreenPro-I: A Risk-Based Life Cycle Assessment and Decision-Making Methodology for Process Plant Design.” Environmental Modelling & Software 17: 669–692. doi:10.1016/S1364-8152(02)00028-2.
- Khan, F. I., R. Sadiq, and B. Veitch. 2004. “Life Cycle iNdeX (Linx): A New Indexign Procedure for Process and Product Design and Decision Making.” Journal of Cleaner Production 12: 59–76. doi:10.1016/S0959-6526(02)00194-4.
- Kim, S. J., S. Kara, and B. Kayis. 2014. “Economic and Environmental Assessment of Product Life Cycle Design: Volume and Technology Perspective.” Journal of Cleaner Production 75: 75–85. doi:10.1016/j.jclepro.2014.03.094.
- Laxasa, E., J. L. Santolaya, C. Roche, and C. Velasco. 2016. “Sustainability Assessment in Product Development Projects.” 18th International Conference on Engineering and Product Design Education, Aalborg, Denmark. 424–429.
- Lu, B., J. Zhang, D. Xue, and P. Gu. 2011. “Systematic Lifecycle Design for Sustainable Product Development.” Concurrent Engineering: Research and Applications 19 (4): 307–323. doi:10.1177/1063293X11424513.
- Luglietti, R., P. Rosa, S. Terzi, and M. Taisch. 2016. “Life Cycle Assessment Tool in Product Development: Environmental Requirements in Decision Making Process.” Procedia CIRP - 13th Global Conference on Sustainable Manufacturing - Decoupling Growth from Resource Use 40: 202–208. doi:10.1016/j.procir.2016.01.103.
- Ma, J., and G. E. Okudan Kremer. “A Modular Product Design Method to Improve Product Social Sustainability Performance.” 2015. Proceedings of the ASME 2015 International Design Engineering Technical Conferences & Computers and Information in Engineering Conference, Boston, Massachusetts. August 2–5. doi:10.1115/DETC2015-46623.
- Mohd Turan, F., K. Johan, N. H. M. Nor, and B. Omar. 2017. “Sustainability Assessment Model in Product Development.” IOP Conference Series: Materials Science and Engineering, doi: 10.1088/1757-899X/226/1/012021.
- Moldavaska, A., and T. Welo. 2015. “On the Applicability of Sustainable Assessment Tools in Manufacturing.” Procedia CIRP 29: 621–626. doi:10.1016/j.procir.2015.02.203.
- Moldavska, A., and T. Welo. 2015. “Development of Manufacturing Sustainability Assessment Using Systems Thinking.” Sustainability 8 (5): 1–26. doi:10.3390/su8010005.
- Niemeijer, D., and R. S. De Groot. 2008. “A Conceptual Framework for Selecting Environmental Indicator Sets.” Ecological Indicators 8 (1): 14–25. doi:10.1016/j.ecolind.2006.11.012.
- OCED. 2001. OECD Environmental Indicators: Towards Sustainable Development. Paris: OECD Publishing.
- OSHA. 2017. “Official Page Occupational Safety and Health Administration/Recommended Practices for Safety and Health Programs.”. Accessed April 03, 2017. https://www.osha.gov/shpguidelines/hazard-Identification.html#ai3.
- Palousis, N., L. Luong, and K. Abhary. 2010. “Sustainability Risk Identification in Product Development.” International Journal of Sustainable Engineering 3 (2): 70–80. doi:10.1080/19397031003686900.
- Sabaghi, M., C. Mascle, P. Baptiste, and R. Rostamzadeh. 2016. “Sustainability Assessment Using Fuzzy-Inference Technique (SAFT): A Methodology toward Green Products.” Expert Systems with Applications 69–79. doi:10.1016/j.eswa.2016.02.038.
- Sala, S., B. Ciuffo, and P. Nijkamp. 2015. “A Systemic Framework for Sustainability Assessment.” Ecological Economics 119: 314–325. doi:10.1016/j.ecolecon.2015.09.015.
- Sarkar, P., C. B. Joung, J. Carrell, and S. C. Feng. 2011. “Sustainable Manufacturing Indicator Repository.” Proceedings of the ASME 2011 International Design Engineering Technical Conferences & Computers and Information in Engineering Conference, Washington, DC. USA. August 29–31. ASME.
- Senthil, K., S. K. Ong, A. Y. C. Nee, and B. H. Tab. 2003. “A Proposed Tool to Integrate Environmental and Economical Assessment of Product.” Environmental Impact Assessment Review 23 (1): 51–72. doi:10.1016/S0195-9255(02)00032-X.
- Singh, S., J. Goodyer, and K. Popplewell. 2007. “Integrated Environmental Process Planning for the Design and Manufacture of Automotive Components.” International Journal of Production Research 45: 4189–4205. doi:10.1080/00207540701472710.
- Sutherland, J. W., J. S. Richter, M. J. Hutchins, D. Dornfeld, R. Dzombak, J. Mangold, M. Z. Stefanie Robinson, A. B. Hauschild, P. Schönsleben, and F. Friemann. 2016. “The Role of Manufacturing in Affecting the Social Dimension of Sustainability.” CIRP Annals - Manufacturing Technology 65: 689–712. doi:10.1016/j.cirp.2016.05.003.
- Wilhelm, M., M. Hutchins, C. Mars, and C. Benoit-Norris. 2015. “An Overview of Social Impacts and Their Corresponding Improvement Implications: A Mobile Phone Case Study.” Journal of Cleaner Production 102: 302–315. doi:10.1016/j.jclepro.2015.04.025.
- Willems, B., W. Dewulf, and J. R. Duflou. 2008. “A Method to Assess the Lifetime Prolongation Capabilities of Products.” International Journal of Sustainable Manufacturing 1 (1/2): 122–144. doi:10.1504/IJSM.2008.01923.
- Xing, K., M. Belusko, L. Luong, and K. Abhary. 2007. “An Evaluation Model of Product Upgradeability for Remanufacture.” International Journal of Advanced Manufacturing Technology 35 (1–2): 1–14. doi:10.1007/s00170-006-0698-9.
Appendix.
RAISE application forms (recommended)
Table 11. RAISE form part 1.
Table 12. RAISE form part 2.
