
 ?Mathematical formulae have been encoded as MathML and are displayed in this HTML version using MathJax in order to improve their display. Uncheck the box to turn MathJax off. This feature requires Javascript. Click on a formula to zoom.
ABSTRACT
Appropriate suppliers are essential for optimizing cost in contemporary supply chain decisions. Supplier selection is a challenging issue that requires the evaluation of both quantitative and qualitative criteria based on imprecise and limited information. This study proposes a framework to assess sustainable supplier selection methods using a fuzzy analytical hierarchy process (FAHP) and the preference ranking organization method for enrichment evaluation (PROMETHEE). Based on a literature review and expert opinions, 20 sustainable supplier selection criteria were grouped into economic, environmental, social, and transportation dimensions. FAHP was then used to determine the weights of the criteria and PROMETHEE was used to rank the suppliers. The proposed framework was implemented in a ready-made garment company in Bangladesh. The findings showed that ‘price of product,’ ‘profit on product,’ ‘quality of product,’ ‘environmental management system,’ and ‘green packaging and labeling’ were the top five sustainable supplier selection criteria. Business professionals and managers will benefit from this study when identifying suppliers to ensure sustainability in the supply chain.
1. Introduction
Supplier selection is an important strategic decision. Practitioners argue that 60% of manufacturing cost is dependent on the raw material suppliers (Arabsheybani et al. Citation2018), which clearly impacts the economic condition of any organization. Selecting suitable supplier groups can fortify a company’s social and economic structure by minimizing cost and ensuring continuous customer satisfaction (Zimmer, Fröhling, and Schultmann 2016). Investors must select appropriate suppliers to gain a competitive advantage and increase the company’s legitimacy (Pradhan and Routroy Citation2018).
The increasing consciousness of sustainability, rigorous government enactments, and growing community standards have escalated organizations’ responsibility in considering sustainability in various domains of business (Luthra et al. Citation2017). Sustainability facilitates efficacious procurement by considering economic, environmental, and social dimensions (Gold and Awasthi Citation2015). Both private and public sectors are integrating sustainability into supply chain management networks (Jauhar and Pant Citation2017), which incorporate all stages from raw material purchasing to the ultimate manufacturing and distribution of the product (Gören Citation2018).
To meet an organization’s requirement for sustainability, choosing sustainable suppliers across the supply chain process is required (Zimmer, Fröhling, and Schultmann 2016. Suppliers play a prominent role in assuring sustainability by maintaining green criteria in accordance with societal and economic expectations (Kannan, Govindan, and Rajendran Citation2015; Luthra et al. Citation2017). The literature on sustainable supplier selection considered economic, environmental, and social dimensions (Amindoust et al. Citation2012; Gören Citation2018; Zimmer, Fröhling, and Schultmann 2016. Transportation can also play a significant role in the sustainability of supply chains, with significant financial and environmental implications (Ali et al. Citation2017; Wilson Citation2007; Carter and Ferrin Citation1995). To the best of the authors’ knowledge, no previous studies have documented transportation criteria in a sustainable supplier selection framework. In emerging economies, supplier selection is a substantial part of supply chain management systems. The extant literature lacks validating frameworks for supplier selection that use data from emerging economies.
To address the above research gaps, the Delphi method, the fuzzy analytical hierarchy process (FAHP), and the preference ranking organization method for enrichment evaluation (PROMETHEE) approaches were integrated for sustainable supplier selection. The Delphi method was used to collect expert opinions on sustainable supplier selection criteria. The FAHP method was used to calculate the weights of the economic, environmental, social, and transportation criteria, and the PROMETHEE method was applied to aggregate the criteria and rank the suppliers. FAHP was considered suitable for the supplier selection process (Gopal and Thakkar Citation2015; Lima Junior, Osiro, and Carpinetti Citation2014), because of its resemblance to human reasoning with respect to imprecise and ambiguous information. However, a large number of pairwise comparisons was required for the FAHP method, in order to differentiate between bad or good scores on the criteria (Kabir and Sumi Citation2014; Lima Junior, Osiro, and Carpinetti Citation2014). PROMETHEE is a widely used ranking method, because if its ability to determine preferences among multiple decisions and to handle uncertainty in input values, similar to human perspectives (Brans and Mareschal Citation2005; Chen, Wang, and Wu Citation2011). The PROMETHEE method assumed that the decision makers were capable of providing the criteria weights, and thus, did not provide any specific guidelines on how to evaluate the weights (Gervásio and Simões Da Silva Citation2012; Govindan, Kadziński, and Sivakumar Citation2017). Therefore, the integrated FAHP-PROMETHEE framework was proposed to eliminate the limitations of the individual methods and to provide a systematic and effective decision-making process for sustainable supplier selection.
This study contributes to the sustainable supplier selection domain as follows:
Integrates economic, environmental, social, and transportation criteria for evaluating sustainable supplier selection decisions.
Proposes an integrated FAHP-PROMETHEE-based framework in order to assess and rank potential suppliers effectively.
Provides a graphical representation to recognize the strong and weak dimensions of the alternatives with respect to the criteria.
Tests the applicability of the proposed framework on a ready-made garment company in an emerging economy.
The remainder of the paper is structured as follows. The related literature is discussed in the next section. In Section 3, the methodology is illustrated. An application of the proposed framework in a practical case is given in Section 4. The results and discussion of the findings are presented in Section 5, and Section 6 concludes this paper.
2. Literature review
Today’s business world experiences rapid industrial and economic global growth, which is amplified by efficient and responsive supply chain management policies. Supplier selection is a substantial and tactical part of supply chain management, as it affects the capital investment, business viability, profit margin, and the corporate/social image of an organization (Gören Citation2018; Luthra et al. Citation2017). Strategic supplier selection is an elementary decision when focusing on sustainability in supply chain management (Amindoust et al. Citation2012).
To achieve a competitive advantage, managers are responsible for selecting the most appropriate suppliers that align with the company’s goals (Govindan, Shankar, and Kannan Citation2018). Supplier selection has a tremendous impact on maintaining sustainability (Lo et al. Citation2018). Sustainability is the philosophy of meeting the needs of existing demands, while considering the capacity to meet future demands (Arabsheybani et al. Citation2018). The three pillars of sustainability are economic, social, and environmental, which must be ensured for an effective supplier selection process (Su and Chen Citation2018).
Sustainable supplier selection is becoming increasingly important for an organization’s overall performance (Jauhar and Pant Citation2017). Studies show that quality, cost, reliability, and delivery time are traditional criteria for selecting a supplier (Adeinat and Ventura Citation2018; Hashemi, Karimi, and Tavana Citation2015). Govindan, Shankar, and Kannan (Citation2018) explained that the pressure of external and internal stakeholders, as well as customer satisfaction are considerable criteria for a company that values green and economic perspectives. Additionally, in recent years, social criteria (for example, human rights, government legislations, community standards, training, etc.) have gained notable attention when selecting suppliers (Gören Citation2018).
Systematic supplier selection, including social, economic, and environmental criteria, has become a key strategy for a successful business organization (Luthra et al. Citation2017; Pradhan and Routroy Citation2018). Companies that practice sustainability tend to have a better public image and customer satisfaction, which helps companies improve performance (Lo et al. Citation2018). Maintaining sustainability in each and every level of the supply chain, including supplier selection, creates a positive impression among supply chain stakeholders and improves interrelationships. Chen, Wang, and Wu (Citation2011) applied the fuzzy PROMETHEE approach to evaluating a suitable outsourcing supplier for a bank in Taiwan. Dobos and Vörösmarty (Citation2014) considered traditional and environmental factors when evaluating suppliers. Data envelopment analysis was applied using the common weights method. Mani, Agarwal, and Sharma (Citation2014) proposed a framework for socially sustainable supplier selection using AHP in decision making. Considering sustainability risks, Gold and Awasthi (Citation2015) suggested a two-step fuzzy AHP approach for selecting suppliers.
Hashemi, Karimi, and Tavana (Citation2015) considered both environmental and economic criteria and proposed a green supplier selection model using an analytic network process and modified grey relational analysis. Yu et al. 2016 suggested using both commercial factors and environmental factors when selecting suppliers. Carbon dioxide emissions during transportation of the product were calculated, and an incentive mechanism was proposed to force the supplier to reduce emissions and use green materials. Jauhar and Pant (Citation2017) suggested that sustainable supplier selection should include a number of criteria, including price, quality, delivery time, lead time, reliability, environmental effects, and social responsibility. Govindan, Kadziński, and Sivakumar (Citation2017) presented an integrated methodology that included the revised Simos procedure, PROMETHEE methods, group compromise ranking algorithms, and robustness analysis. The acceptability and proficiency of the proposed approach were ensured using a case study in the Indian food industry.
Rao et al. (Citation2017a) designed a two-stage mechanism for selecting suppliers considering economic and supply chain risk criteria. Suppliers were ranked based on the grey correlation degree of mixed sequence. Rao, Goh, and Zheng (Citation2017b) proposed a decision mechanism for sustainable supplier selection based on linguistic 2-tuple grey correlation degree. The authors integrated economic, environmental, and social criteria to evaluate sustainable suppliers. In another study, Because customers appreciate eco-friendly products, business organizations tend to include environmental criteria in selecting suppliers (Adeinat and Ventura Citation2018). Previous literature did not explicitly consider uncertainties in human judgment when evaluating sustainable suppliers.
Transportation criteria (for example, cost, related risks, and mode of transportation) play an important role in achieving sustainability across a supply chain, as well as enhancing supply chain performance (Ali et al. Citation2017). Previous studies did not explicitly consider transportation criteria in the supplier selection problem. Even though transportation cost (an important criterion) contributes significantly to the total logistics cost, little attention was paid to include it in the supplier selection model (Aguezzoul and Ladet Citation2007). Several studies have highlighted the role of transportation in the sustainable development of enterprises and supply chains. For example, Acar and Dincer (Citation2018) investigated the role of hydrogen as a transportation fuel to combat global warming, and concluded that fuel cell vehicles outperformed conventional vehicles. Mosaberpanah and Khales (Citation2013) opined that strategies such as pricing policies, transportation planning, vehicle technology improvement, and use of clean fuels are useful for promoting sustainable development.
Considering the importance of transportation in achieving a sustainable supply chain, this paper treats transportation criteria separately rather than merging it with the economic dimension of the sustainable supply chain. For decision making, managers would have more insight into transportation criteria if it were modeled separately in a sustainable supplier selection mechanism. This study fills these research voids by integrating the FAHP and PROMETHEE methods. Section 3 details the proposed theoretical framework for sustainable supplier selection.
3. Theoretical framework
To conduct this research, a three-phase methodology was adopted. In first phase, the main criteria and sub-criteria for sustainable supplier selection were determined using a literature review and expert input via the Delphi method. In the second phase, FAHP was utilized to evaluate the weights of the criteria and sub-criteria. Finally, in the third phase, the suppliers were ranked based on the criteria and weight by applying the PROMETHEE method. shows the theoretical framework of sustainable supplier selection.
Figure 1. Framework of sustainable supplier selection.
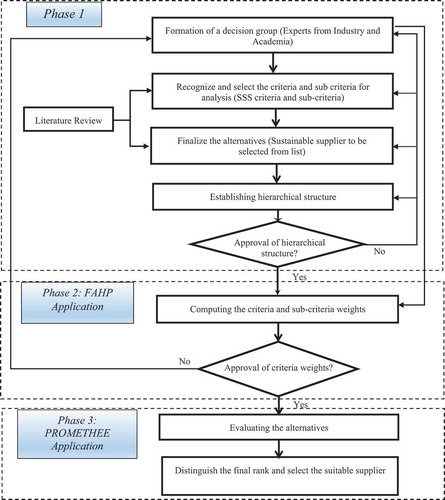
3.1 Delphi method
The Delphi method is a well-organized communication tool or methodology that depends on a panel of experts. It is based on the principle that forecasts or decisions from a classified group of professionals are more precise than those from unorganized groups (Ashok et al. Citation2017). This method was conducted using face-to-face meetings termed mini-Delphi or estimate-talk-estimate. In this approach, the opinions of experts were gathered and analyzed randomly in written form or discussions (Kaufmann Citation2016). Individual experts implemented experience and related knowledge to reach an agreement. Individuals’ opinions and literature can also be used to assess general views within the process. Therefore, evaluation and selection of the criteria and sub-criteria for sustainable supplier selection were conducted using the Delphi method. Meeting were arranged with corresponding experts in this sector. Murry and Hammons (Citation1995) showed that the Delphi method is based on a scale ranging from 10 to 30.
3.2 Fuzzy AHP
In practical decision-making situations, uncertainty exists. Integrating uncertainty or vagueness considerations into the decision making model for supplier selection is a prerequisite for ensuring an efficacious framework (Şen and Çinar Citation2010; Ilgin Citation2017). The selection of subjective values for pairwise comparison in orthodox AHP might not be adequate for practical problems. However, the uncertainty must be incorporated in some or all of the pairwise comparison values (Sangwan and Jindal Citation2013).
According to Kabir and Hasin (Citation2011), Saaty’s AHP had the following limitations:
The application of the AHP method was prominent in close-to-crisp quantifiers.
The process appraised an individual’s judgment that possessed uncertainty.
Experts’ opinions contributed to evaluating the AHP criteria.
The AHP method contained a vague ranking system.
The evaluation scale in the AHP method was customary and did not meet the requirements.
However, the literature suggested that interval judgments are more convenient than fixed-value judgments, because of the fuzzy characteristics of the comparison system (Şen and Çinar Citation2010). The fuzzy approach can handle the pessimism/optimism evaluation nature of the problem, such that trapezoidal or triangular fuzzy numbers (TFN) can be used to order the indicator functions in a classical set. Preference ratings are an alternative to the traditional numerical equivalence method (Lima Junior, Osiro, and Carpinetti Citation2014; Şen and Çinar Citation2010), which has made FAHP more effective and appropriate for an ambiguous situation (Gold and Awasth Citation2015; Kutlu and Ekmekçioǧlu Citation2012). Numerous techniques, such as fuzzy least squares method, geometric mean method, direct fuzzification method, synthetic extent analysis, fuzzy modification of the logarithmic least squares method, and fuzzy preference programming, are preferred to incorporate uncertainty into the results of FAHP (Kabir and Hasin Citation2012). To assess the problem, a modified version of Chang’s extent analysis (Citation1996) was incorporated in this study.
A triangular fuzzy number (TFN), given by where l < m < u, had a triangular-type membership function, as shown in Equation 1.
In this study, the professionals were implored to identify the relative weight of two assessment indicators in the indifferent matrix using the scale presented in . For combining group decisions, aggregation of decision makers’ (DMs) pairwise comparisons were achieved by implementing geometric mean applications (Davies Citation1994).
Table 1. Linguistic terms and corresponding fuzzy scales (Kabir and Hasin Citation2012; Şen and Çinar Citation2010).
After accumulating the group decisions, the consistency ratio (CR) was checked. A graded mean aggregation process was applied to defuzzify the matrix. In the graded mean integration method, a fuzzy number, , was changed into a crisp number by applying Equation 3.
The CR of the matrix was attained by the defuzzification of each value in the matrix, utilizing a randomly generated consistency index (RI), as shown in . The CR was then checked to ensure it had a value smaller than 0.1.
Table 2. RI for different sizes of matrix (Mani, Agarwal, and Sharma Citation2014).
To determine the relative weights of the criteria from pairwise comparisons, a modified Chang extent analysis method was employed (Kutlu and Ekmekçioǧlu Citation2012; Şen and Çinar Citation2010). was the normalized weight vector of a triangular fuzzy comparison matrix. The relative weights of criteria in crisp form were then determined. The steps for calculating this vector are given below (Ilgin Citation2017; Kutlu and Ekmekçioǧlu Citation2012; Sangwan and Jindal Citation2013).
Firstly, the fuzzy synthetic extent value of each pairwise comparison was calculated. was the TFN of the pairwise comparison of criterion
over criterion
, presented as
. According to Chang (Citation1996), the value of fuzzy synthetic extent, with respect to the criterion
, was denoted as
, and could be calculated via Equation 4.
where n represented the size of the fuzzy judgment matrix. To obtain , fuzzy additional operation of
values gave:
To obtain , fuzzy additional operations on
values were performed.
The inverse vector of Equation 6 was obtained by utilizing Equation 7.
The normalization formula of Equation 7 was corrected by Wang, Luo, and Hua 2008, as in Equation 8.
In the second step, the fuzzy ranking value of was calculated by comparing it to other extent synthetic values of
. According to Chang (Citation1996), the degree of possibility of
was obtained using Equation 9 (Ju, Wang, and Liu Citation2012; Şen and Çinar Citation2010):
where p is the ordinate of the highest intersection point P between and
, as shown in . In the case of comparing
and
, both the values of
and
were needed.
Figure 2. The intersection between and
.
The extent analysis method was utilized to determine the rating of probability, which is a platform for comprehending two TFNs (Kabir and Hasin Citation2012). In this regard, normalized degrees of possibility showed a greater TFN, whereas the combination of relative significance was not possible (Wang, Luo, and Hua 2008.
To avoid this limitation, Liou and Wang (Citation1992) propounded a systematic method of calculating the integral value that accumulates the weight of the synthetic extent values using Equation 10 (Kabir and Hasin Citation2012):
where is the index that shows the rate of optimism for DMs. If
approaches one or zero, the DMs tend to be more optimistic or pessimistic, respectively (Şen and Çinar Citation2010; Kabir and Hasin Citation2012). The normalized importance weight vector
of the fuzzy judgment matrix was calculated using Equation 11 (Şen and Çinar Citation2010; Kabir and Hasin Citation2012):
where is a non-fuzzy number.
3.3 The PROMETHEE approach
The PROMETHEE approach was introduced by Brans (Brans Citation1982) and further modification was made by Brans and Vincke (Citation1985) and Brans and Mareschal (Citation2005). For determining local scores according to the DMs’ preferences, pairwise comparisons of the individual criteria were conducted. To attain the global score, all local scores were accumulated that corresponded to the PROMETHEE I or PROMETHEE II ranking (Brans and Vincke Citation1985). Here, PROMETHEE I, PROMETHEE II, and geometrical analysis for interactive aid (GAIA) approaches are briefly discussed.
3.3.1 Theoretical basis
For each criterion, the preference formation in PROMETHEE was founded on the pairwise formation (Brans and Mareschal Citation2005), where gaps between the evaluations of two substitutes of each criterion were considered. In the case of larger pitfalls, a greater preference to the best alternative was allocated by the DM. If the difference was negligible, the DM might allocate little or no preference. The preference became larger when the deviation was large (Brans and Mareschal Citation2005), and varied between zero and one. For observed deviations, Equation 12 represents the function of the preference of criterion over criterion
, if a criterion was to be maximized:
for which,
Here, is the equation which expresses the amplitude of the deviations between the assessments of the alternatives within each criterion. In the case of minimizing the criteria, the preference function would be reversed, as in Equation 13.
For each criterion, a generalized criterion had to be defined. Six categories of specific preference functions are shown in , which have been used in this research (Gervásio and Simões Da Silva Citation2012). Other forms of generalized criteria could also be considered.
Table 3. Types of generalized criteria of preference function (Modified from Gervásio and Da Silva Citation2012).
The largest deviation was represented by the parameter a, which was the indifference threshold, below which the decision-maker considered it negligible. Parameter b was used to initiate a full preference, which represented the smallest deviation. The preference function did not have any discontinuities for the Gaussian criterion, which increased continuously for all deviations. Here. the inflection point was defined by parameter c (Gervásio and Simões Da Silva Citation2012).
3.3.2 PROMETHEE I approach
When applying PROMETHEE I, outranking flows and the calculation of accumulated preference indices are two prerequisites. The gathered preference indices, π(x, y), represent the ratingpreferred over
regarding all criteria, while π (y, x) indicates how y is preferred over x. This assumes that x, y
A, as in Equation 14.
where , indicates a strong global preference of x over y, while
indicates a poor global preference of x over y (Brans and De Smet Citation2016). Each alternative x faces (n – 1) other alternatives in A. Two outranking flows were defined as:
The positive outranking flow:
shows that alternativeoutranks all others. The higher the value of Ø+ (x), the better alternative.
The negative outranking flow:
shows that alternativeis outranked by all others. The lower the value of
, the better the alternative. Using the positive and negative outranking flows, the PROMETHEE I partial ranking can be obtained, as below:
where ID1, PR1, and IC1 indicate the indifference, priority, and incomparability, respectively. A higher power of one alternative is linked to a lower debilitation of the other, in the case of xIC1y. Accordingly, both alternative flows provide data that is inconsistent and incomparable (Gervásio and Simões Da Silva Citation2012).
3.3.3 PROMETHEE II approach
A complete ranking process of the alternatives was derived from PROMETHEE II (Kabir and Sumi Citation2014). In this case, the difference between the positive and the negative outranking flows was the net outranking flow :
PROMETHEE II eliminated all incomparability of alternatives in PROMETHEE I. Here, all alternatives were comparable (Brans and Smet Citation2016). When Ø(x) > Ø(y), y is outranked by x on all criteria.
3.3.4 GAIA plane
GAIA fortified the ranking system of PROMETHEE and facilitated a geometric visualization approach. GAIA provided visual direction for the major criteria used for ranking alternatives (Herva and Roca Citation2013). From a calculation of the net outranking flow, the GAIA matrix was demonstrated as Ø(x). The matrix was then manifested on a GAIA biplot using a principal component analysis (PCA) algorithm (Herva and Roca Citation2013; Kabir and Sumi Citation2014). While reducing the loss of information, PCA minimized the number of degrees. The conversion of a multi-criteria decision problem to a two-dimensional space and geometrical manifestation of relations between alternatives and criteria resulted in an unavoidable loss of some qualitative relations. The quantity of data conserved was determined by monitoring its contribution in the GAIA plane (values that were larger than 70% were considered reliable) (Herva and Roca Citation2013).
4. Application of the proposed methodology
Sustainable supplier selection is a significant strategic decision made by an organization’s top management. It influences an organization’s profitability, efficiency, and relationships with stakeholders. Decisions regarding supplier selection can be made using the proposed combined FAHP and PROMETHEE methodology.
To verify the applicability of the proposed model, a leading apparel manufacturing company in Bangladesh, herein called ABC, was selected. ABC is a leading manufacturer of a wide range of top-quality denim, jeans, sportswear, and vintage denim. The company exports manufactured items to the USA, Canada, and European countries. By studying the company’s policy, production cycle, and procurement system, sourced items can be divided into two classes: merchandising items (e.g. fabrics, thread, accessories), and non-merchandising items (e.g. cleaning and safety equipment, stationary items).
The procurement process of merchandising items was studied. These items include fabrics, threads, buttons, and zippers, among others, that were used for manufacturing general denim products. The company must fulfill the buyers’ requirements accurately. Most of the time, the buyers themselves select the company’s suppliers for specific raw materials. Therefore, the company has no or little choice in the matter. However, in the case of thread selection, the buyers provide standards in the requirement policy, and the company selects the thread supplier. Therefore, supplier selection for the thread used in denim item production was selected as the case study.
4.1 Case statement
In ABC, the procurement decisions for merchandising items are made by the merchandising department. Several discussion sessions with this department were conducted and a case study on thread selection for a specific style of the product was used for the analysis. The style required six shades (types) of thread for 12 different operations. There were five competitive suppliers shortlisted for evaluation. In this study, the best competitive supplier was identified for a long-term sustainable relationship with the buyer and supplier.
4.2 Identification of alternatives, criteria, and sub-criteria
The five suppliers were denoted S1, S2, S3, S4, and S5. Based on the literature review and the opinions of the DMs in the company, four major criteria (economic, environmental, social, and transportation) were selected. Seven sub-criteria were considered under the economic criteria. Similarly, four, four, and five sub-criteria were considered under the environmental, social, and transportation criteria, respectively. In total, 20 sub-criteria were considered in this study. The decision hierarchy is given in .
Figure 3. Decision hierarchy model (Source: Amindoust et al. Citation2012; Dobos and Vörösmarty Citation2014; Gold and Awasthi Citation2015; Hashemi, Karimi, and Tavana Citation2015; Mani, Agarwal, and Sharma Citation2014; Rao et al. Citation2017a, 2017c; Zimmer, Fröhling, and Schultmann 2016.
4.3 Evaluation sequence
The evaluation sequences are discussed below.
4.3.1 Delphi method
After defining the alternative suppliers and the evaluation criteria, an expert panel was assigned to provide opinions in order to select the most applicable sub-criteria based on professional experience. A decision hierarchy model was generated (). Data from five alternative suppliers were then gathered from multiple sources. Some information was numeric, while some was qualitative. A five-state qualitative scale was used to evaluate the data ().
Table 4. Symbols and qualitative scales.
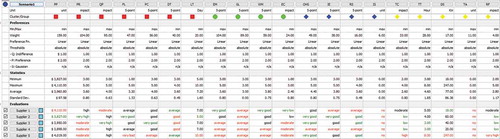
Details about the alternate suppliers regarding attributes (sub-criteria) were gathered. Some of the data collected met the minimum values and others met the maximum depending on the nature of the criteria and the corresponding supplier. These data are presented in .
Table 5. Alternative suppliers’ performance with respect to criteria.
4.3.2 Fuzzy AHP
Following the decision hierarchy model of , it was necessary to assign the importance weights to the attributes. The professionals were instructed to construct pairwise comparisons for the main and sub-criteria using fuzzy scales. This is given in .
Table 6. Pairwise comparison matrix and weights with respect to major criteria.
To check the consistency ratio, these fuzzy numbers were then transformed into a crisp value according to Equation 3. The pairwise comparison matrix was transformed, as in . After the defuzzification of the matrix, the CR was checked. It was 0.046, which is less than 0.1. Thus, the matrix was consistent and reliable for use in further operations.
The fuzzy synthetic extent values with respect to each criterion were calculated. These values were measured according to Equation 4, and are shown in . In the next step, the integral values (Ii) were determined using α = 0.5, and are shown in . The normalized importance weight vector, Wi, was calculated according to Equation 11 and is displayed in . Similarly, the weights of the sub-criteria with respect to the major criteria were determined. shows the local and global weights of all sub-criteria.
Table 7. Weight distribution of all Sub-criteria.
4.3.3 PROMETHEE method
The status rating of each alternative supplier regarding the 20 sub-criteria () and the weights () were used in the PROMETHEE method. In this case, only one scenario was considered. The difference in threshold values of highest and lowest ratings were used to maintain 5% variety for each criterion. Alternatively, to maintain 60% of the variation between the highest and lowest rating for each criterion, prioritized thresholds were selected. The c thresholds were 30% of the difference between the lowest and highest rating for each criterion in the Gaussian criterion (Gervásio and Simões Da Silva Citation2012). The alternative supplier was assessed and ranked by Visual PROMETHEE after identifying the evaluation matrix and the preference function.
To implement the PROMETHEE and GAIA approach, Visual PROMETHEE software was used. in the Appendix shows the graphical view of Visual PROMETHEE. In visual PROMETHEE, a set of actions (the suppliers S1, S2, S3, S4, and S5), a set of criteria (the major criteria), and a criteria group (sub-criteria) define a decision problem. It offers the option to use a qualitative scale (five-point, seven-point, etc.) rather than numbers. The qualitative scale uses several ordered states or levels (from worst to best). The preferences of the DMs were:
Whether the criterion should be minimized or maximized.
Weight or importance of one criterion over the others.
Preference function.
Figure A1. Stainable supplier selection using Visual PROMETHEE. a,PROMETHEE I partial ranking. b) PROMETHEE II complete ranking.
The PROMETHEE I partial ranking was constructed on the calculation of and
, which provided contrasting rankings and could not avoid actions becoming unparalleled. The complete ranking of PROMETHEE II was founded on the net preference flow (Ø). The PROMETHEE table shows
,
, and Ø scores and ranks the actions (suppliers) according to the PROMETHEE II complete ranking. GAIA analysis is a multidimensional manifestation of the judgment problem with dimensions up to the number of criteria (20 sub-criteria).
From the PROMETHEE table, the positive , negative
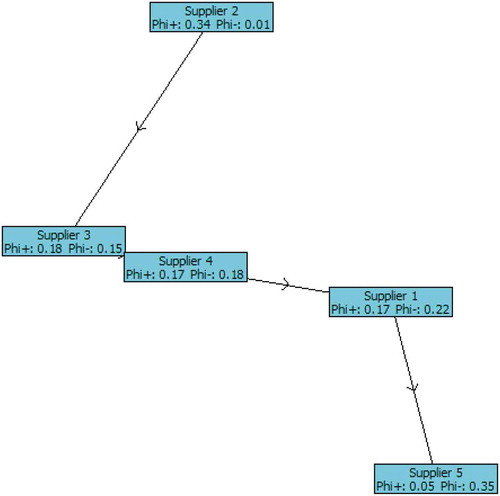
(PROMETHEE I), and the net flow (Ø) values (PROMETHEE II) were obtained. These values are presented in . The PROMETHEE II shows that S2 (supplier 2) outranked other alternatives. This indicates that S2 is the best choice as a sustainable supplier under the given circumstances. The next highest preferences were S3, S4, S1, and S5.
Table 8. The PROMITHEE II complete ranking.
is the visual representation of the PROMETHEE I partial ranking ((a)) and PROMETHMEE II complete ranking ((b)). Using the PROMETHEE Network, the alternate choice of supplier was identified in case the best-evaluated supplier failed and alternate options were needed. According to , the first choice was S1. If S1 fails, due to uncertain circumstances, the hierarchy then leads to S3, then to S4, S1, and S5.
Figure A2. PROMETHEE ranking.
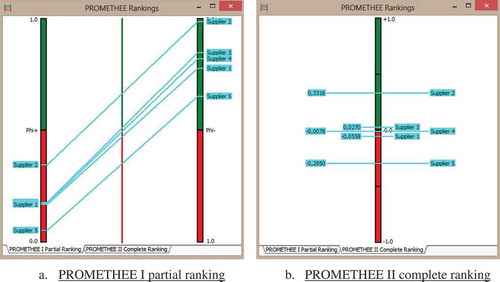
Figure A3. PROMETHEE network of supplier selection.
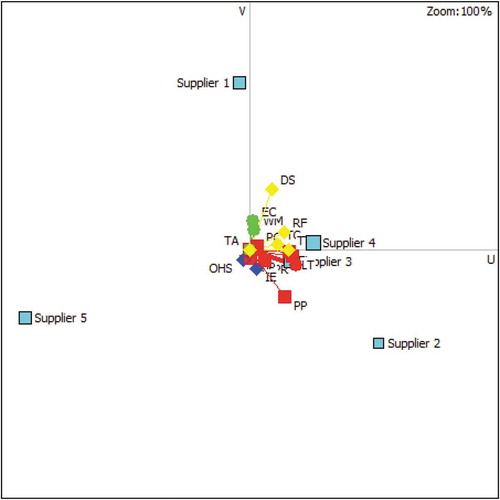
The supplier selection problem was also visualized in the two-dimensional GAIA plane using PCA. shows the GAIA plane for supplier selection and the quality level for visualization was 87.9%. The decision axis represents the PROMETHEE II ranking and the criteria weights. Both suppliers and criteria are presented in the plane. In , the economic, environmental, social, and transportation criteria are represented using red, blue, green, and yellow, respectively. The suppliers are highlighted using cyan. indicates that supplier 2 was close to the economic and environmental criteria, though far from the transportation and social criteria. Supplier 1 was close to the transportation and social criteria, but far from the economic and environmental criteria. As the weights of the economic (0.521) and environmental (0.277) criteria were higher than the transportation (0.093) and social (0.109) criteria, supplier 2 was the appropriate supplier. Similarly, supplier 5 was ranked last, as it was far from most criteria.
Figure 4. GAIA plane of supplier selection.
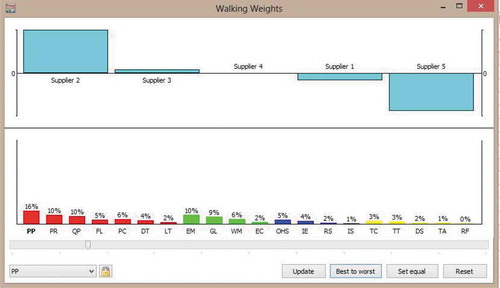
One of the special features in Visual PROMETHEE is the ease of sensitivity analysis. It has an option termed ‘walking weight’ that grants a change in the significant weights in order to see the derived variation of the PROMETHEE II ranking (). In this figure, the upper bar chart shows the PROMETHEE II complete ranking for the five supplier alternatives, whereas the lower bar chart shows the importance weights of the sub-criteria given by the DMs in the FAHP methodology. In the beginning, the sub-criteria product price (PP) was selected for the analysis (). The change in the ranking of the suppliers was analyzed by altering the weights of the sub-criteria’s PP with the help of the slider under the lower bar chart. A similar analysis was conducted to observe the sensitivity of the rank of the suppliers, due to the weight change of the other sub-criteria. Because of space limitations, all figures are not presented here. Based on the analysis, Supplier 2 was the best alternative, whereas Supplier 5 was the worst alternative.
Figure 5. Sensitivity analysis using walking weight.
5. Results and discussions
This study presented a hybrid model for selecting a sustainable supplier considering the economic, environmental, social, and transportation criteria. As various departments of a company have different preferences for supplier selection criteria, a ranking model is essential for decision-making (Lo et al. Citation2018; Wang, Luo, and Hua 2008). Fuzzy AHP is a value measurement model and PROMETHEE is an outranking model. In the PROMETHEE method, the weights of the criteria obtained by FAHP hold a greater level of compatibility, consonance, inter-relation, and precision than weights determined by professionals’ judgment and experience. In FAHP, there is no preference function for each criterion determined by the DMs; instead, each criterion is assessed on an indifferent platform. In addition, specific normalization is needed in FAHP methods, which can affect the results. However, this was eliminated by using PROMETHEE when ranking the suppliers. A combined approach demonstrated greater reliability.
Considering all the criteria and sub-criteria, the evaluation of FAHP and PROMETHEE methodologies suggested that Supplier 2 (S2) was the most sustainable for the company. In this study, the transportation criterion was embedded to analyze the supplier selection problem. If all conditions and data considered in the methodology remained constant, the company should select Supplier 2 for the long term. Supplier 2 demanded the lowest product cost and the weight of this sub-criterion was the highest, whereas the weight of risk factor was the lowest. The weights of environmental management, occupational health and safety, and transportation cost were quite high. Supplier 2 carried a high impact for these criteria. Thus, Supplier 2 was the most sustainable selection.
If any supply chain has other priorities, the weights of the sub-criteria would be different, which would produce a different result. In a developing country, such as Bangladesh, product price is the prime indicator when considering any supplier in a garment industry. Product quality and environmental management criteria have considerable influence on selecting a sustainable supplier. For a food supply chain, Govindan, Kadziński, and Sivakumar (Citation2017) explained that quality assurance and environmental safety are the most favorable conditions when selecting suppliers. Nguyen and Chen (Citation2018) found that the price of the purchased product, fixed contracted cost, and minimum supply quantity were the essential drivers for supplier selection in a biomass supply chain. Arabsheybani et al. (Citation2018), Gören (Citation2018), and Su and Chen (Citation2018) integrated risk assessment, quantity discount, and lost sales analysis to determine the optimum supplier. Lo et al. (Citation2018) embedded order allocation while solving the supplier selection problem. Based on corporate social responsibility practices, Govindan, Shankar, and Kannan (Citation2018) found that environmental and customer requirements played a vital role in selecting suppliers. According to the findings of Luthra et al. (Citation2017), in an Indian automotive company, environmental cost carried the highest weight and technological and financial capability occupied the lowest weight for sustainable supplier selection.
Based on the above it can be concluded that the required dimension for selecting a sustainable supplier varies according to region, industry type and preferences, product type, business environment, and customer requirements. Considering the current economic state of Bangladesh, product purchase cost outweighs the other requirements, making supplier 2 the most desired.
6. Conclusions
For any supply chain network, one of the most significant decisions is selecting appropriate suppliers. Suppliers acquire and provide raw materials or other resources to execute supply chain functions. Traditional supplier selection is based on price, quality, and lead time, which may not fit into the current business environment. In this paper, an integrated FAHP-PROMETHEE framework was proposed for sustainable supplier selection. The framework was tested using a real-world company in Bangladesh. The company implemented the proposed framework to select the raw material supplier for sewing thread.
The characteristics of the proposed integrated FAHP-PROMETHEE framework compared to existing supplier selection methods, such as AHP, TOPSIS, and VIKOR method, are as follows.
The proposed study considered sustainability criteria, namely economic, environmental, and social. In addition, transportation criteria were also considered making this study more applicable.
The proposed FAHP-PROMETHEE framework combined the strengths of both methods. The traditional PROMETHEE method did not provide any specific guidelines to calculate the weights of the criteria, whereas the FAHP method could not consider different preference functions for each criterion. The FAHP method was used to determine the weights of the criteria considering the vagueness and ambiguity of the decision makers, whereas the PROMETHEE method ranked the alternatives considering the preference functions.
The developed GAIA plane provided a graphical representation of the alternatives and criteria, and supported the decision makers in identifying the strong and weak points of the alternatives.
The proposed framework determined the ranking order of the suppliers. To resolve conflicts in decision-making, the proposed framework determined groups of criteria expressing similar preferences.
This framework can help industry managers make decisions on which sub-criteria are the most and least important. Because of the consideration of various dimensions (i.e. social, environmental, and transportation) along with economic criteria, the interaction between various levels of employees and suppliers increases.
The sustainable supplier selection process can improve relationships with each level of customer, because environmental management criteria ensure eco-friendly products for sustainably conscious consumers.
One of the limitations of this study was that the evaluation factors considered for sustainable supplier selection focused on the procurement process in an apparel manufacturing company. Further or different adaptation of the factors would be required depending on specific industries, such as leather producers, pharmaceuticals, automotive companies, chemical plants, and cement manufacturers. Because of issues with data availability, some of the factors, such as profit of product, environmental cost, and transportation cost, were qualitative. More accurate results could have been achieved if quantitative values of these factors were considered. The fuzzy AHP method could not represent the interrelationships among the criteria. To address this issue, a fuzzy analytic network process could be coupled with the PROMETHEE method for sustainable supplier selection problems. In order to capture the vagueness and ambiguity of the PROMETHEE methods, fuzzy PROMETHEE could be also analyzed in the future. The proposed framework could be compared to other multi-criteria decision-making methods, including TOPSIS, ETE: CTRE, VIKOR and/or MOORA.
Disclosure statement
No potential conflict of interest was reported by the authors.
Additional information
Notes on contributors
Saikat Anjan Roy
Saikat Anjan Roy received his BSc from the Department of Industrial and Production Engineering at Bangladesh University of Engineering and Technology (BUET). His research interests include supply chain management, applied operations research, and intelligent decision making.
Syed Mithun Ali
Dr. Syed Mithun Ali is an Associate Professor in the Department of Industrial and Production Engineering at Bangladesh University of Engineering and Technology. Dr. Syed Mithun Ali received his Ph.D. majoring in supply chain risk management from Nagoya Institute of Technology, Japan in 2016. His research interests include logistics and supply chain management and supply chain risk management and tying that to supply chain sustainability.
Golam Kabir
Dr. Golam Kabir is an Assistant Professor in Industrial Systems Engineering Program at the Faculty of Engineering and Applied Science, University of Regina, SK, Canada. He received his Ph.D. in Civil Engineering from UBC on 2016. His research interests include system risk, reliability, resilience assessment, interdependent network resilience analytics, multi-criteria decision analysis under risk and uncertainty, sustainable system analytics, data-driven decision making, and multi-objective optimization.
Rafid Enayet
Rafid Enayet received his BSc from the Department of Industrial and Production Engineering at Bangladesh University of Engineering and Technology (BUET). His research interests include logistics management and application of soft computing techniques in industrial problem-solving.
Saima Ahmed Suhi
Saima Ahmed Suhi received her BSc from the Department of Industrial and Production Engineering at Bangladesh University of Engineering and Technology (BUET). Her research interests include supply chain management and supply chain risk management.
Tasmiah Haque
Tasmiah Haque received her BSc from the Department of Industrial and Production Engineering at Bangladesh University of Engineering and Technology (BUET). Her research interests include supply chain management and multi-criteria decision making.
Rifat Hasan
Rifat Hasan received his BSc from the Department of Industrial and Production Engineering at Bangladesh University of Engineering and Technology (BUET). His research interests include supply chain risk, modelling and simulation, applied operations research.
References
- Acar, C., and I. Dincer. 2018. “The Potential Role Of Hydrogen as a Sustainable Transportation Fuel to Combat Global Warming.” International Journal Of Hydrogen Energy. https://doi.org/10.1016/j.ijhydene.2018.10.149.
- Adeinat, H., and J. A. Ventura. 2018. “Integrated Pricing and Supplier Selection in a Two-Stage Supply Chain.” International Journal of Production Economics 201: 193–202. doi:10.1016/j.ijpe.2018.03.021.
- Aguezzoul, A., and P. Ladet. 2007. “A Nonlinear Multiobjective Approach for The Supplier Selection, Integrating Transportation Policies.” Journal Of Modelling in Management 2 (2): 157-169.
- Ali, S.M., G. Kabir, A. Ali, S. Shake, and M.A. Moktadir (2017). Transportation Mode Selection Framework for Apparel Industries: A Fuzzy AHP Approach. Selected Studies on Economics and Finance, Cambridge Scholars Publishing, England.
- Amindoust, A., S. Ahmed, A. Saghafinia, and A. Bahreininejad. 2012. “Sustainable Supplier Selection: A Ranking Model Based on Fuzzy Inference System.” Applied Soft Computing 12: 1668–1677. doi:10.1016/j.asoc.2012.01.023.
- Arabsheybani, A., M. M. Paydar, and A. S. Safaei. 2018. “An Integrated Fuzzy MOORA Method and FMEA Technique for Sustainable Supplier Selection considering Quantity Discounts and Supplier’s Risk.” Journal of Cleaner Production 190: 577–591. doi:10.1016/j.jclepro.2018.04.167.
- Ashok, S., H. R. Tewari, M. D. Behera, and A. Majumdar. 2017. “Development of Ecotourism Sustainability Assessment Framework Employing Delphi, C&I and Participatory Methods: A Case Study of KBR, West Sikkim, India.” Tourism Management Perspectives 21: 24–41. doi:10.1016/j.tmp.2016.10.005.
- Brans, J. P. (1982). Lingenierie de la decision. Elaboration dinstruments daide a la de-cision. Methode PROMETHEE. In: Nadeau R, Landry M, editors. Laide a laDecision: Nature, Instruments et Perspectives Davenir. Quebec, Canada:Presses de Universite Laval (pp. 183–214).
- Brans, J. P., and B Mareschal. (2005). PROMETHEE methods. In Multiple criteria decision analysis: state of the art surveys (pp. 163–186). New York, NY: Springer.
- Brans, J. P., and P. Vincke. 1985. “Note—A Preference Ranking Organisation Method.” Management Science 31: 647–656. doi:10.1287/mnsc.31.6.647.
- Brans, J. P., and Y. De Smet. 2016. “PROMETHEE Methods.” International Series in Operations Research and Management Science 233: 187–219.
- Carter, J. R., and B. G. Ferrin. 1995. “The Impact of Transportation Costs on Supply Chain Managemen.” Journal of Business Logistics 16 (1): 189.
- Chang, D.-Y. 1996. “Applications of the Extent Analysis Method on Fuzzy AHP.” European Journal of Operational Research 95: 649–655. doi:10.1016/0377-2217(95)00300-2.
- Chen, Y.-H., T.-C. Wang, and C.-Y. Wu. 2011. “Strategic Decisions Using the Fuzzy PROMETHEE for IS Outsourcing.” Expert Systems with Applications 38: 13216–13222. doi:10.1016/j.eswa.2011.04.137.
- Davies, M. A. P. 1994. “A Multicriteria Decision Model Application for Managing Group Decisions.” Journal of the Operational Research Society 4594: 47–58. doi:10.1057/jors.1994.6.
- Dobos, I., and G. Vörösmarty. 2014. “Green Supplier Selection and Evaluation Using DEA-type Composite Indicators.” International Journal of Production Economics 157: 273–278. doi:10.1016/j.ijpe.2014.09.026.
- Gervásio, H., and L. Simões Da Silva. 2012. “A Probabilistic Decision-Making Approach for the Sustainable Assessment of Infrastructures.” Expert Systems with Applications 39: 7121–7131. doi:10.1016/j.eswa.2012.01.032.
- Gold, S., and A. Awasthi. 2015. “Sustainable Global Supplier Selection Extended Towards Sustainability Risks from (1+N)Th Tier Suppliers Using Fuzzy AHP Based Approach.” IFAC-PapersOnLine 28: 966–971. doi:10.1016/j.ifacol.2015.06.208.
- Gopal, P. R. C., and J. Thakkar. 2015. “Development of Composite Sustainable Supply Chain Performance Index for the Automobile Industry.” International Journal of Sustainable Engineering 8 (6): 366–385. doi:10.1080/19397038.2014.947392.
- Gören, H. G. 2018. “A Decision Framework for Sustainable Supplier Selection and Order Allocation with Lost Sales.” Journal of Cleaner Production 183: 1156–1169. doi:10.1016/j.jclepro.2018.02.211.
- Govindan, K., M. Kadziński, and R. Sivakumar. 2017. “Application of a Novel PROMETHEE-based Method for Construction of a Group Compromise Ranking to Prioritization of Green Suppliers in Food Supply Chain.” Omega 71: 129–145. doi:10.1016/j.omega.2016.10.004.
- Govindan, K., M. Shankar, and D. Kannan. 2018. “Supplier Selection Based on Corporate Social Responsibility Practices.” International Journal of Production Economics 200: 353–379. doi:10.1016/j.ijpe.2016.09.003.
- Hashemi, S. H., A. Karimi, and M. Tavana. 2015. “An Integrated Green Supplier Selection Approach with Analytic Network Process and Improved Grey Relational Analysis.” International Journal of Production Economics 159: 178–191. doi:10.1016/j.ijpe.2014.09.027.
- Herva, M., and E. Roca. 2013. “Ranking Municipal Solid Waste Treatment Alternatives Based on Ecological Footprint and Multi-Criteria Analysis.” Ecological Indicators 25: 77–84. doi:10.1016/j.ecolind.2012.09.005.
- Ilgin, M. A. 2017. “An Integrated Methodology for the Used Product Selection Problem Faced by Third-Party Reverse Logistics Providers.” International Journal of Sustainable Engineering 10 (6): 399–410. doi:10.1080/19397038.2017.1317873.
- Jauhar, S. K., and M. Pant. 2017. “Integrating DEA with DE and MODE for Sustainable Supplier Selection.” Journal of Computational Science 21: 299–306. doi:10.1016/j.jocs.2017.02.011.
- Ju, Y., A. Wang, and X. Liu. 2012. “Evaluating Emergency Response Capacity by Fuzzy AHP and 2-Tuple Fuzzy Linguistic Approach.” Expert Systems with Applications 39: 6972–6981. doi:10.1016/j.eswa.2012.01.061.
- Kabir, G., and M. A. A. Hasin. 2011. “Comparative Analysis of AHP and Fuzzy AHP Models Formulticriteria Inventory Classification.” International Journal of Fuzzy Logic Systems 1: 1–16.
- Kabir, G., and M. A. A. Hasin. 2012. “Multiple Criteria Inventory Classification Using Fuzzy Analytic Hierarchy Process.” International Journal of Innovative Technology and Exploring Engineering 3: 123–132.
- Kabir, G., and R. S. Sumi. 2014. “Power Substation Location Selection Using Fuzzy Analytic Hierarchy Process and PROMETHEE: a case Study from Bangladesh.” Energy 72: 717-730.
- Kannan, D., K. Govindan, and S. Rajendran. 2015. “Fuzzy Axiomatic Design Approach Based Green Supplier Selection: A Case Study from Singapore.” Journal of Cleaner Production 96: 194–208. doi:10.1016/j.jclepro.2013.12.076.
- Kaufmann, P. R. 2016. “Integrating Factor Analysis and the Delphi Method in Scenario Development: A Case Study of Dalmatia, Croatia.” Applied Geography 71: 56–68. doi:10.1016/j.apgeog.2016.04.007.
- Kutlu, A. C., and M. Ekmekçioǧlu. 2012. “Fuzzy Failure Modes and Effects Analysis by Using Fuzzy TOPSIS-based Fuzzy AHP.” Expert Systems with Applications 39: 61–67. doi:10.1016/j.eswa.2011.06.044.
- Lima Junior, F. R., L. Osiro, and L. C. R. Carpinetti. 2014. “A Comparison between Fuzzy AHP and Fuzzy TOPSIS Methods to Supplier Selection.” Applied Soft Computing 21: 194–209. doi:10.1016/j.asoc.2014.03.014.
- Liou, T. S., and M. J. J. Wang. 1992. “Ranking Fuzzy Numbers with Integral Value.” Fuzzy Sets and Systems 50: 247–255. doi:10.1016/0165-0114(92)90223-Q.
- Lo, H. W., J. J. H. Liou, H. S. Wang, and Y. S. Tsai. 2018. “An Integrated Model for Solving Problems in Green Supplier Selection and Order Allocation.” Journal of Cleaner Production 190: 339–352. doi:10.1016/j.jclepro.2018.04.105.
- Luthra, S., K. Govindan, D. Kannan, S. K. Mangla, and C. P. Garg. 2017. “An Integrated Framework for Sustainable Supplier Selection and Evaluation in Supply Chains.” Journal of Cleaner Production 140: 1686–1698. doi:10.1016/j.jclepro.2016.09.078.
- Mani, V., R. Agarwal, and V. Sharma. 2014. “Supplier Selection Using Social Sustainability: AHP Based Approach in India.” International Strategic Management Review 2: 98–112. doi:10.1016/j.ism.2014.10.003.
- Mosaberpanah, M. A., & Khales, S. D. 2013. “The role of transportation in sustainable development.” In ICSDEC 2012: Developing the Frontier of Sustainable Design, Engineering, and Construction (pp. 441–448).
- Murry, J. W. J., and J. O. Hammons. 1995. “Delphi: a Versatile Methodology for Conducting Qualitative Research.” The Review Of Higher Education 18 (4): 423–436.
- Nguyen, D. H., and H. Chen. 2018. “Supplier Selection and Operation Planning in Biomass Supply Chains with Supply Uncertainty.” Computers & Chemical Engineering. doi:10.1016/j.compchemeng.2018.0.
- Pradhan, S. K., and S. Routroy. 2018. “Improving Supply Chain Performance by Supplier Development Program through Enhanced Visibility.” Materials Today: Proceedings 5: 3629–3638. doi:10.1016/j.matpr.2017.11.613.
- Rao, C., M. Goh, and J. Zheng. 2017b. “Decision Mechanism for Supplier Selection under Sustainability.” International Journal of Information Technology & Decision Making 16 (01): 87–115. doi:10.1142/S0219622016500450.
- Rao, C., X. Xiao, M. Goh, J. Zheng, and J. Wen. 2017a. “Compound Mechanism Design of Supplier Selection Based on Multi-Attribute Auction and Risk Management of Supply Chain.” Computers & Industrial Engineering 105: 63–75. doi:10.1016/j.cie.2016.12.042.
- Sangwan, K. S., and A. Jindal. 2013. “An Integrated Fuzzy Multi-Criteria Evaluation of Lithium-Ion Battery Recycling Processes.” International Journal of Sustainable Engineering 6 (4): 359–371. doi:10.1080/19397038.2012.735717.
- Şen, C. G., and G. Çinar. 2010. “Evaluation and Pre-Allocation of Operators with Multiple Skills: A Combined Fuzzy AHP and Max-Min Approach.” Expert Systems with Applications 37: 2043–2053. doi:10.1016/j.eswa.2009.06.075.
- Su, C. J., and Y. A. Chen. 2018. “Risk Assessment for Global Supplier Selection Using Text Mining.” Computers & Electrical Engineering 68: 140–155. doi:10.1016/j.compeleceng.2018.03.042.
- Wang, Y. M., Y. Luo, and Z. Hua. 2008. “On the Extent Analysis Method for Fuzzy AHP and Its Applications.” European Journal of Operational Research 186: 735–747. doi:10.1016/j.ejor.2007.01.050.
- Wilson, M. C. 2007. “The Impact of Transportation Disruptions on Supply Chain Performance.” Transportation Research Part E: Logistics and Transportation Review 43 (4): 295–320. doi:10.1016/j.tre.2005.09.008.
- Yu, F., L. Xue, C. Sun, and C. Zhang. 2016. “Product Transportation Distance Based Supplier Selection in Sustainable Supply Chain Network.” Journal of Cleaner Production 137: 29–39. doi:10.1016/j.jclepro.2016.07.046.
- Zimmer, K., M. Fröhling, and F. Schultmann. 2016. “Sustainable Supplier Management–A Review of Models Supporting Sustainable Supplier Selection, Monitoring and Development.” International Journal of Production Research 54 (5): 1412–1442. doi:10.1080/00207543.2015.1079340.
Table A1. Pairwise comparison matrix according to major criteria (defuzzified).
Table A2. Fuzzy synthetic extent values (Si) with respect to major criteria.
Table A3. Integral values (Ii) with respect to major criteria.