
ABSTRACT
The aim of this article is to analyse the performance of the Photovoltaic (PV) and to study the effect of soiling on the energy generation under Muscat environmental conditions. The generated energy is consumed in the eco-house, and the access energy is fed back to the electric grid. Two-ways metre was used to record the energy taken from the grid or fed back to the grid. The system was monitored from December 2014 until today. Various performance parameters of the plant were evaluated which include system efficiency, performance ratio (PR), capacity factor (CF) and different types of PV system losses and yields. The annual average values of recorded ambient temperature and solar radiation were 32°C and 482 W/m2, respectively.
The total annual energy produced was 23,595 kWh, whereas the annual average daily reference yield, array yield and final yield were 5.59, 3.78 and 3.64 kWh/kWP/day, respectively. The annual average daily PR and CF were 0.67 and 0.15, respectively, while the annual average system efficiency was 10.3%. Furthermore, the annual average daily capture, system and cell temperature losses were 1.82, 0.14 and 2.95 h/day,respectively, with a small reduction in energy production when modules left uncleaned.
1. Nomenclature
| = | PV array area, m2 | |
| CF | = | Capacity factor |
| = | ambient temperature, °C | |
| = | module temperature, °C | |
| = | measured PV module temperature,, °C | |
| NOCT | = | nominal operating cell temperature = 45°C |
| G | = | solar irradiance, kW/m2 |
| = | solar irradiation, W/m2 | |
| = | total generated daily energy, kWh | |
| = | total generated monthly energy, kWh | |
| = | AC output energy, kWh | |
| = | AC energy output temperature corrected, kWh | |
| = | DC energy output, kWh | |
| = | global in-plan solar insolation, | |
| = | array capture losses, | |
| = | system losses, | |
| = | Cell temperature losses, | |
| = | number of days in the month | |
| PR | = | performance ratio |
| = | AC output power, W | |
| = | inverter power capacity, kW | |
| = | inverter output AC power at each instant of time | |
| = | PV array full load power at STC, kW | |
| STC | = | standard test conditions |
| = | array yield, | |
| = | final yield, | |
| = | final yield, | |
| = | temperature coefficient of the PV module maximum power, °C |
2. Introduction
Owing to the importance of renewable energy resources to reduce environmental issues, many countries have set target for this resource that should be achieved. Photovoltaic (PV) has fast technological development with declining in cost as well as has special characteristics such as modularity, simplicities of installation and can be integrated within building structure. Global electricity generation capacity of PV has raised from 40 GW in 2010 to 402 GW in 2017 (Renewable Global Status Report Citation2018).
The performance of the PV system depends on several factors such as the type of technology used, temperature, plan of array irradiation, degradation, soiling and spectral irradiance distribution. Many studies have been conducted on the PV power plant performance in different geographical locations and climate conditions and were reported in Adaramola (Citation2015); Lima, Ferreira, and Morais (Citation2017); Micheli et al. (Citation2014), to name a few.
The energy performance analysis of on-grid three different PV technologies was presented in Başoğlu et al. (Citation2015). The cadmium-telluride module resulted in higher value of performance ratio (PR) and mean array efficiency than other under weather conditions of Northwest of Turkey. The performance analysis of a 2.2-kWp grid-connected PV system in northeastern of Brazil was discussed in De Lima, Ferreira, and Morais (Citation2017). The PR and capacity factor (CF) were found to be 0.829 and 0.192, respectively. The results obtained from monitoring a 1.72 kWp rooftop grid-connected PV in Ireland for 1 year were presented in Ayompe et al. (Citation2011). The annual average daily system losses and capture losses were 0.23 and 0.22 h/day, respectively. The results of a 11.2-kWp roof top grid-connected PV system in Eastern India, monitored for 1 year, were discussed in Sharma and Goel (Citation2017). The final yield of the system was 3.67 h/day, PR was 0.78 and system efficiency was 12.05%. A techno-economic study of a 1-kWp grid-connected PV system in Indonesia found that the system technically can meet the basic energy need of a household with a payback period of 17.6 years (Tarigan and Kartikasari Citation2015). Padmavathi and Daniel (Citation2013) reported the performance analysis of a 3-MW grid-connected PV plant for 1 year located in India. Daily and seasonal variations in the plant output were presented using monitored data at 5-minute intervals. The annual average CFPR and system efficiency of 190-kWp grid-connected PV system in India were found to be 0.0927, 0.74 and 8.3%, respectively (Sharma and Chandel Citation2013)
Oman has very hot and humid climate. The summer season is extremely hot (May–August) and rainfall is very low throughout the year. Solar energy in Oman is considered as one of the highest in the world, as well as good wind speed is also available mainly in the southern part of Oman (Al-Badi, Citation2011a). Several papers about Oman’s solar and wind energy resource assessment and utilisation studies were published (Al-Badi, Citation2011b, Kazem et al. Citation2014). Oman PV market is growing especially because of the recently introduced law that encourages the homeowners to install PVs on their rooftop and sell their excess solar energy back to the grid at market rates which can reach during the peak times five times as much as they pay for consuming electrical energy. The goal of this paper is to analyse 20.4-kWP polycrystalline rooftop PV performance under Oman’s environmental conditions. The system was installed in December 2014. In this paper, the most recent data for 1 year (May 2017–April 2018) are presented. The modules were left unclean. Different performance parameters were calculated from the measured results. The parameters include the following: annual average energy generated, the annual average daily yields (array yield, final yield and reference yield), annual average efficiency of the system, PR, CF and losses (array capture, system and cell temperature), as well as the effect of the dust on the performance is discussed.
3. System configuration
3.1 Rooftop PV system
The system consists of 80 PV modules with an overall power of 20.4 kWp, 20 kW inverter, an eco-house and a grid. Each 20 modules are connected in series which make one string and each two strings are connected in parallel at the junction box to form one array. The two arrays are feeding the DC side of the inverter. The schematic diagram for the whole system is illustrated in . The modules are mounted on metal structure tilted 23.5° south above the flat roof of the eco-house as shown in . shows the specification of the inverter, while displays the electrical and mechanical properties of PV modules. The eco-house is located in Sultan Qaboos University (23.6 N, 58.2 E), Oman. The PV system was installed in December 2014 and far away from any obstacles which can cause shading on the PV cells. The measurements were started in December 2014 and continue till today. The modules were left unclean.
Figure 1. Schematic layout of the system.
Figure 2. Pictures of photovoltaic panels on the rooftop of the eco-house.
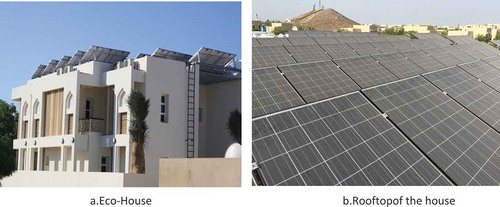
Table 1. SMA Sunny tripower 20000TL inverter specification.
Table 2. PV module specifications.
3.2. Data logging system
This system consisted of a PC, data logger, pyranometer to measure the global solar radiation, temperature sensor to measure the ambient temperature and sensor for measuring the wind speed. The following are some of the data that are recorded by the data logger and saved on a daily basis: produced energy by the PV, voltage, current, energy consumed by the house, energy taken/fed back from/to the grid, ambient temperature, each room temperature, humidity, wind speed and the illumination in each room. The measurements were taken every 20 s since December 2014 until today. The results discussed in this paper are for one whole year (May 2017–April 2018). The modules were left unclean. The evaluation of uncertainty of the measured results is done by calculating the minimum, maximum and average values of each parameter. For solar irradiance, any value exceeds 1600 W/m2 or less than 0 was disregarded, and with respect to the current, any value exceeds the rated current by large percentage also was omitted.
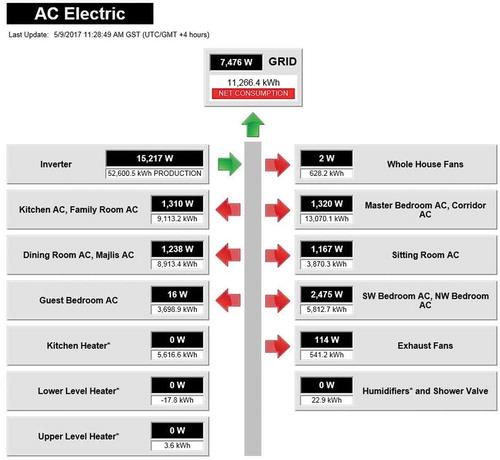
The load of the house in May 2017 together with the total energy consumed and the amount of energy generated by PV and fed back to grid are presented in .
Figure 3. The load of the house in May 2017 and the amount of energy generated by PV and fed back to grid.
4. Meteorological data
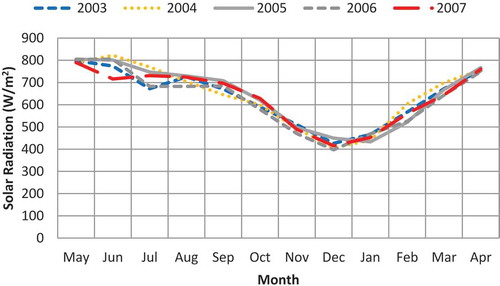
All results presented in this paper are the monthly average daily for the one whole year. presents the measured total solar radiation and wind speed from May 2017 to April 2018. These values varied from 384 W/m2 in December to 538 W/m2 in May. From the measured results, it is clear that the solar radiation during the whole year in Oman is high with annual average value of 486 W/m2. The solar radiation during Winter is lower compared with the other seasons. The wind speed ranges between 1.2 m/s in January to 2.5 m/s in May; in general, the wind speed in Muscat governorate is low compared with other sites in Oman. High wind speeds are beneficial to PV due to the cooling effect on the modules. The 5 years measured average values for solar irradiations in Muscat are depicted in , these were obtained from Public Authority for Civil Aviation (PACA), Directorate General of Meteorology. The general trend of solar irradiations presented in is similar to what is shown in .
Figure 4. Measured monthly global plane-of-array irradiation at tilt angle of 23.5° south and wind speed from May 2017 to April 2018.
Figure 5. Measured average monthly total plane-of-array irradiation obtained from PACA for 5 years.
4.1 Modelling of the module temperature
The module temperature ( can be calculated by applying the following equation (Lugue Citation2003)
where G is the solar irradiance in kW/m2, Ta is the ambient temperature in °C, NOCT is the nominal operating cell temperature (45 oC as specified by manufacturer’s data sheet).
displays the measured average monthly ambient temperature, the sun-shine duration over 1 year and the calculated module temperature. The ambient temperature (daytime hours) varied between 22.9°C in January to 38.7oC in May, whereas the sun-shine duration varied between 9.67 h in December to 12.9 h in June. The worst effect of the module temperature on the power production is during summer, the module temperature reached 55.5°C in May.
Figure 6. Measured monthly average ambient temperature and the sun-shine duration over the monitored period, and the calculated module temperature.
5. System analysis
The grid-connected PV system performance is normally evaluated using IEC 61,724 Standard (International Electrotechnical Commission Citation1998). The parameters include the following: energy produced, yields (array yield, final yield and reference yield), system efficiency, PR, CF and losses (array capture, system and cell temperature). Energy quantities are calculated and normalised to full load PV power and denoted to as yields, this represents the actual PV operation relative to its full load capacity (Padmavathi and Daniel Citation2013). Efficiencies are normalised to PV module area. These normalised parameters provide a basis for comparison for grid-connected PV system working under different operating conditions (Adaramola & Vagnes, Citation2015).
5.1 AC energy
The total monthly alternating current (AC) energy generated by the PV system can be calculated as:
where is the number of days in the month and
is the total generated daily energy.
The instantaneous AC energy output from the inverter was measured on 20-s intervals. The total energy produced per month is illustrated in . The total energy output per month ranged between 1465 kWh in November to 3473 kWh in March. The total annual energy produced was 27,067 kWh. The most productive period of the PV system is from March to May during which relatively higher solar radiations were recorded that increased the generated output energy.
Figure 7. Measured total energy generated per month over the monitored period.
Although Muscat has low annual rainfall, however rain fall is mostly from December to April. The total AC power generated from the PV modules, for three random consecutive days in December 2017, after the inverter is depicted in .
The variations of power at each instant in time can be calculated by taking the difference between two consecutive samples (Santiago et al. Citation2015):
where and
are the inverter output AC power at each instant of time
and at the following one,
, respectively.
is the inverter power capacity.
Furthermore, the variations in power at each instant of time (20 s) are also represented in the Figure. As shown, the PV output power has almost the same changes through the year but with a change in the peak power. These variations make the PV energy forecast straightforward which should allow extensive integration of PV into Oman future power network with the presence of Energy Management System. To cover the load during the night and to stabilise the system energy, storage will be required.
Figure 8. The measured PV production and variation through three consecutive days in December 2017.
5.2 System yields
These consist of array, final and reference yields. The yields represent the actual PV operation relative to its full load capacity.
5.2.1 Array yield
It is defined as the ratio of the total direct current (DC) energy output from a PV array over a defined period (year, month or day) to the PV array full load power at standard test conditions (STC) and is given as (International Electrotechnical Commission, Citation1998; Ayompe et al. Citation2011):
The STC are done at irradiation of 1000 W/m2, module temperature of 25°C and air mass (AM) of 1.5.
5.2.2 Final yield
It is the ratio between the total AC energy generated of the PV system and the full load power at STC and is given as [38] [34]:
5.2.3 Reference yield
It is the ratio between the global in-plan solar insolation (kWh/m2) and the array reference irradiance (1 kW/m2). It represents the solar energy available at a given location for a certain period and is given as (International Electrotechnical Commission, Citation1998; Ayompe et al. Citation2011):
shows the reference, array and final yields over one whole year. The final, reference and array varied between 2.4 and 5.5 kWh/kWp-day, 3.7 and 6.9 kWh/kWp-day and 2.5 and 5.6 kWh/kWp-day, respectively. The annual average final, reference and array yields were 3.64 kWh/kWp-day, 5.59 kWh/kWp-day and 3.78 kWh/kWp-day, respectively. Relatively lower level of solar radiation in November resulted in low final yield. The higher value of reference yield during summer indicating more solar radiation is available during summer. However, the monthly average value of the final yield is small during summer owing to the excessive ambient temperature. The difference between the array yield and final yield is owing to the inverter losses. The final yields previously reported are: Oman, Sohar city, 5.1 kWh/kWp-day (Kazem et al. Citation2014), Kuwait, 4.5 kWh/kWp-day (Al-Otaibi Citation2015), Morocco, 4.45 kWh/kWp-day (Attari, Elyaakoubi, and Asselman Citation2016), India, 3.8 kWh/kWp-day (De Lima, Ferreira, and Morais Citation2017), Singapore, 3.12 kWh/kWp-day (Wittkopf et al. Citation2012), Germany, 1.8 kWh/kWp-day (Jahn and Nasse Citation2004). The final yield for Muscat city is 3.47 kWh/kWp-day, Oman is lower compared with Sohar city, Kuwait, Morocco, and close to India but higher than other places.
Figure 9. Monthly average final, reference and array yields over 1 year.
5.3 System efficiency
It is defined as inverter AC output power divided by the multiplication of total in-plan solar irradiation (W/m2) and PV array area (m2), and is given as:
where is the PV array area (m2) and
is the global irradiation on the array plane (W/m2).
5.4 Capacity factor (CF)
It is the actual total energy generated per year divided by the amount of energy generated by the PV system when operated at full load for a year. The CF would be unity, if the generation system supplied full load power continuously and is given as (International Electrotechnical Commission Citation1998; Kymakis, Kalykakis, and Papazoglou Citation2009):
5.5 Performance ratio (PR)
It is the ratio between the actual and theoretical energy production of PV plant on a given time basis. It represents the effect of losses on a PV module’s normal power output and allows comparison of PV systems independent of geographical location, tilt angle, orientation and plant capacity. It is given as the final energy yield of the PV system divided by the reference yield (International Electrotechnical Commission Citation1998; Shiva Kumar and Sudhakar Citation2015).
displays the PV CF and PR over 1 year. The CF varied between 0.11 in June and 0.23 in March, and with an annual average of 0.15. The average annual value of CF (0.15) is almost similar to CF of a typical plant in Morocco (0.1484) (Attari, Elyaakoubi, and Asselman Citation2016), and in India (0.1569) (Padmavathi and Daniel Citation2013) but higher compared to that in Norway (0.1058) (Adaramola & Vagnes, Citation2015) and in Serbia (0.1288)(Dragana and Tomislav Citation2015). The PR varied between 0.37 in June and 0.96 in March, with an average of 0.67 per year which is similar to what was reported in (Al-Badi Citation2018). The PR reported in southern Algeria was varied from 0.67 to 0.86 (Necaibia et al. Citation2018), whereas the annual average reported in northern Ghana and in Algerian Sahara were 0.7 (Mensah, Yamoah, and Adaramola Citation2019) and 0.72 (Sahouane et al. Citation2019), respectively. Their values are not far compared to the results presented in this paper. The values of the PR are relatively low, which could be explained due to the fact that the high temperatures during summer increase the module temperatures, thus resulting in high capture and cell temperature losses which cause a reduction in system efficiency as shown in . PR values and system efficiency are higher in winter than in summer owing to the cooling of module surface in winter.
Figure 10. Performance ratio and capacity factor per month over 1 year.
5.6 PV energy losses
There are a variety of losses occurred in the PV system and these are: array capture, system and cell temperature losses. There are additional losses that can occur in the PV system such as (Krauter Citation2006) reflection losses, soiling, degradation and thermal losses due to the increase in cell temperature, mismatch and losses due to shadowed cell and wiring losses. The energy output for the PV modules can degrade gradually (system’s age) owing to the climate factors effect such as temperature and humidity.
5.6.1 Array capture losses
They are owing to PV array losses, it indicates the losses that result from PV operation since the PV is not able to fully utilise the available radiation (due to such as dust accumulation, partial shading and inhomogeneous irradiance) and is given as (International Electrotechnical Commission Citation1998; Ayompe et al. Citation2011):
5.6.2 System losses
They are due to losses in the system components (such as wiring losses, diodes losses and system ageing) and are given as (International Electrotechnical Commission Citation1998; Ayompe et al. Citation2011):
5.6.3 Cell temperature losses
They are caused by operating PV modules above the standard test condition (irradiance 1000 W/m2, module temperature 25°C and air mass 1.5). Based on , the peak power of the PV module decreases by 0.429% for every 1°C increase in the temperature of the cell above standard test conditions. The temperature losses can be calculated as (Sidi et al. Citation2016; Ueda et al. Citation2009):
where (kWh) is the AC output energy;
(kWh) is the AC energy output temperature corrected and calculated as (Ueda et al. Citation2009):
where is the temperature coefficient of the PV module maximum power (−0.458%/℃) and
is the measured PV module temperature (°C).
The capture, system and cell temperature losses over 1 year are shown in . The system losses varied between 0.1 h/day in November and 0.2 h/day in April with an average value of 0.14 h/day, the capture losses varied between 0.38 h/day in February and 4.2 h/day in June with an average value of 1.82 h/day, and the cell temperature losses varied between 0.22 h/day in January and 5.8 h/day in May with an average value of 2.95 h/day. The cell temperature losses reached small value during the winterbut had a large increase during summer due to the increase in ambient and module temperatures. The capture losses have higher values in summer compared with winter which indicates that although solar radiation is high during summer, but due to high temperature, the modules are not able to generate the expected energy. The system losses are almost the same during the whole year with a little increase during summer time since this represents the losses in different system components.
Figure 11. The average capture, system and cell temperature losses per month over 1 year.
5.6.4 Factors affecting the cell temperature losses
The measured solar irradiation, ambient temperature and wind speed in an arbitrary week for 3 days in summer and winter are illustrated in . All these factors (high solar irradiation, increased in ambient temperature and low wind speed) can increase the module temperature, as a result increases the cell temperature losses as shown in . Furthermore, other factors may affect the module temperature such as type of PV cell and type of mounting structure.
Figure 12. Effects of ambient temperature, wind speed and solar irradiation on cell temperature losses during (a) winter; (b) summer.
5.7 Effect of dust on PV performance
PV modules must be cleaned regularly to avoid dust accumulation that reduces the transmittance of the glass of the PV modules, as a result energy production is affected. Dust pollution deposition is affected by several factors such as weather conditions and different site-specific environments (Darwish et al. Citation2015). The impact of dust accumulation, humidity level and wind speed on the efficiency of PV were discussed in Mekhilefa, Saidurb, and Kamalisarvestani (Citation2012). Kaldellis and Kokala (Citation2010) reported that Solar radiation is the main factor which affects PV power output, but soil and dirt can cause degradation up to 15% of the PV efficiency. Ibrahim et al. (Citation2009) stated that a dusty module produced 25% and 35% lower energy compared to a cleaned one after a period of 3 months and 1 year, respectively. A study on a solar PV system near Riyadh, Saudi Arabia, indicated a 32% reduction in power, after 8 months, in comparison with an identical PV cleaned daily (Salim, Huraib, and Eugenio Citation1988). Bird dropping makes a hot spot which leads to local overheating of the module (Ghazi, Sayigh, and Kenneth Citation2014). The heat produced instead of electrical power decreases both the efficiency and the lifetime of the module. Power losses due to dust depend on the cleaning schedule of PVs, type of dust accumulated and length of time since the last rainfall. To investigate the effect of dust on the eco-house rooftop PV, the modules were left uncleaned.
Figure 13. Picture of unclean photovoltaic panels.
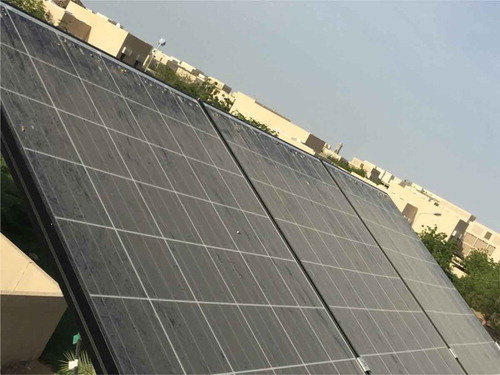
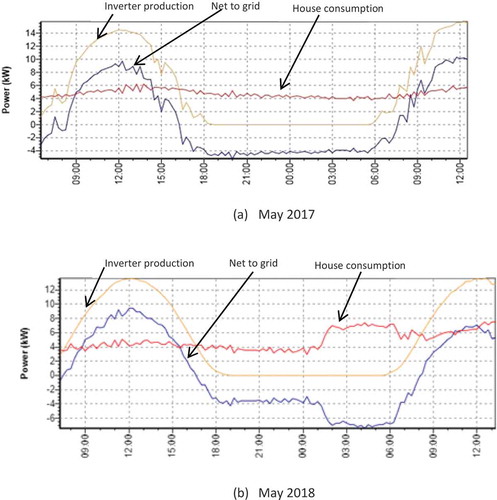
The picture of unclean PV panels is depicted in . The presence of few bird droppings and little dirt on the modules is obvious in the picture. It should be noted that the amount of dust accumulated on the PV in this area is limited owing to the presence of mountains, and the PV panels were tilted. The percentage of reduction is small because of the Sultan Qaboos University-specific environment which is characterised by low dust accumulation. The instantaneous power generated during an arbitrary day in May 2017 and May 2018 are presented in . The reduction in the peak power is clear ). The peak power was close to 15 kW in May 2017, however it was reduced to 13 kW in May 2018.
Figure 14. The instantaneous power generated in (a) May 2017 and (b) May 2018.
6. Conclusions
In this research paper, the measured results of 20.4 kWP grid-connected PV plant, under Muscat governorate environmental conditions, are discussed. The system was monitored since December 2014 until today. The facility is placed on the rooftop of Sultan Qaboos University eco-house, Oman. The produced energy is consumed in the eco-house and the access energy is fed back to the electric grid. Two-ways metre was used to record the energy taken from the grid or fed back to the grid.
The total annual energy produced was 23,595 kWh, whereas the annual average daily reference yield and array yield were 5.59 and 3.78 kWh/kWP/day respectively. The annual average daily CF was 0.15, while the annual average system efficiency was 10.3%. Furthermore, the annual average daily capture losses, system losses and cell temperature losses were 1.82, 0.14 and 2.95 h/day, respectively.
The annual average value of the PR for the rooftop PV was 0.67 and the final yield for this system was 3.64 kWh/kWP/day. These values fluctuate over the year which could be attributed to the high temperatures during summer that increase the module temperatures, thus resulting in high capture and cell temperature losses which cause a reduction in system efficiency.
To investigate the effect of dust on the eco-house rooftop PV, the modules were left uncleaned. The percentage of reduction of energy generated is small because of the Sultan Qaboos University-specific environment which is characterised by low dust accumulation.
The results of this paper are compared with results obtained from other researchers which internationally revealed that the monthly average daily CF reached 15% which is either higher or similar to other systems installed in different locations worldwide, whereas the annual average daily final yield reached 3.64 kWh/kWp-day which is either lower or higher compared with other systems around the world. The average system efficiency over 1 year reached 10.3% compared with the name plate PV module efficiency (15.33%) at STC.
Acknowledgements
The author would like to acknowledge The Research Council, Oman and Sultan Qaboos University for providing the financial support for construction of the Eco House and providing all required equipment, sensors and tools to do research.
Disclosure statement
No potential conflict of interest was reported by the author.
Additional information
Funding
Notes on contributors
Abdullah Al-Badi
Abdullah Al-Badi obtained the B.Sc. in Electrical Engineering from SQU, Oman, in 1991. He received the degree of M.Sc. and Ph.D from UMIST, UK, in 1993 and 1998, respectively. He has published more than 160 publications in many well-known international journals, proceedings of refereed international conferences and technical reports. He carried out 44 research projects and consultancy (Main or co-investigator), with total attracted fund of + US$2.2 million. His research interests include renewable energy, distributed generation, power quality, power system analysis and power electronics and drives. He is a Senior Member of the Institute of Electrical Engineering and Electronics, IEEE, USA and a consultant in Oman Society of Engineers. He is IEEE program evaluator for Accreditation Board for Engineering and Technology (ABET) and External Reviewer for Oman Academic Accreditation Authority (OAAA). In 2009 he was appointed as a Dean for the Deanship of Admissions and Registration and in Feb. 2014 was appointed as a Dean for the College of Engineering, he is currently a Professor in Electrical & Computer Engineering Department in Sultan Qaboos University.
References
- Adaramola, M. 2015. “Techno-economic Analysis of a 2.1 kW Rooftop Photovoltaic-grid-tied System Base on Actual Performance.” Energy Convers Management 101: 85–93. doi:10.1016/j.enconman.2015.05.038.
- Adaramola, S., and T. Vagnes. 2015. “Preliminary Assessment of a Small-scale Rooftop PV-grid Tied in Norwegian Climatic Conditions.” Energy Conversion and Management 90: 458–465. doi:10.1016/j.enconman.2014.11.028.
- Al-Badi, A. 2011a. “Wind Power Potential in Oman.” International Journal of Sustainable Energy 30: 110–118. doi:10.1080/1478646X.2010.509497.
- Al-Badi, A. 2011b. “Hybrid (solar and Wind) Energy System for Al Hallaniyat Island Electrification.” International Journal of Sustainable Energy 30: 212–222. doi:10.1080/1478646X.2010.503276.
- Al-Badi, A. 2018. “Measured Performance Evaluation of a 1.4 kW Grid Connected Desert Type PV in Oman.” Energy for Sustainable Development 47: 107–113. doi:10.1016/j.esd.2018.09.007.
- Al-Otaibi, A. 2015. “Performance Evaluation of Photovoltaic Systems on Kuwaiti School’s Rooftop.” Energy Conversion and Management 95: 110–119. doi:10.1016/j.enconman.2015.02.039.
- Attari, K., A. Elyaakoubi, and A. Asselman. 2016. “Performance Analysis and Investigation of a Grid-connected Photovoltaic Installation in Morocco.” Energy Reports 2: 261–266. doi:10.1016/j.egyr.2016.10.004.
- Ayompe, L., A. Duffy, S. McCormack, and M. Conlon. 2011. “Measured Performance of a 1.72 kW Rooftop Grid Connected Photovoltaic System in Ireland.” Energy Conversion and Management 52: 816–825. doi:10.1016/j.enconman.2010.08.007.
- Başoğlu, M., A. Kazdaloğlu, T. Erfidan, M. Bilgin, and B. Çakır. 2015. “Performance Analyzes of Different Photovoltaic Module Technologies under Izmit, Kocaeli Climatic Conditions.” Renewable and Sustainable Energy Reviews 52: 357–365. doi:10.1016/j.rser.2015.07.108.
- Darwish, Z., K. Kazem, K. Sopian, M. Al-Goul, and H. Alawadhi. 2015. “Effect of Dust Pollutant Type on Photovoltaic Performance.” Renewable and Sustainable Energy Reviews 41: 735–744. doi:10.1016/j.rser.2014.08.068.
- De Lima, L., F. Ferreira, and D. Morais. 2017. “Performance Analysis of a Grid Connected Photovoltaic System in Northeastern Brazil.” Energy for Sustainable Development 37: 79–85. doi:10.1016/j.esd.2017.01.004.
- Dragana, D., and M. Tomislav. 2015. “Performance Analysis of A Grid-connected Solar PV Plant in Niš, Republic of Serbia.” Renewable and Sustainable Energy Reviews 44: 423–435. doi:10.1016/j.rser.2014.12.031.
- Ghazi, S., A. Sayigh, and I. Kenneth. 2014. “Dust Effecton Flat Surfaces – A Review Paper.” Renewable and Sustainable Energy Reviews 33: 742–751. doi:10.1016/j.rser.2014.02.016.
- Ibrahim, M., B. Zinsser, H. El-Sherif, E. Hamouda, G. Makrides, E. Georghiou, M. Schubert, and J. Werner (2009, Jan). “Advanced Photovoltaic Test Park in Egypt for Investigating the Performance of Different Module and Cell Technologies.” Proceedings of the 24th sympo- sium photovoltaic solar energy, Staffelstien, Germany.
- International Electrotechnical Commission. 1998. IEC 61724, Photovoltaic System Performance Monitoring Guidelines for Measurement, Data Exchange and Analysis. 1st ed. Geneva: IEC: International Electrotechnical Commission.
- Jahn, U., and W. Nasse. 2004. “Operational Performance of Grid-connected PV Systems on Buildings in Germany.” Progress in Photovoltaic 12: 441–448. doi:10.1002/pip.550.
- Kaldellis, K., and A. Kokala. 2010. “Quantifying the Decrease of the Photovoltaic Panels’ Energy Yield Due to Phenomena of Natural Air Pollution Disposal.” Energy 35: 4862–4869. doi:10.1016/j.energy.2010.09.002.
- Kazem, H., T. Khatib, K. Sopian, and W. Elmenreich. 2014. “Performance and Feasibility Assessment of 1.4 kW Roof Top Grid-connected Photovoltaic Power System under Desertic Weather Conditions.” Energy and Buildings 82: 123–129. doi:10.1016/j.enbuild.2014.06.048.
- Krauter, W. 2006. Solar Electric Power Generation: Photovoltaic Energy Systems. Berlin: Springer.
- Kymakis, E., S. Kalykakis, and M. Papazoglou. 2009. “Performance Analysis of a Grid Connected Photovoltaic Park on the Island of Crete.” Energy Conversion and Management 50: 433–438. doi:10.1016/j.enconman.2008.12.009.
- Lima, L., L. Ferreira, and F. Morais. 2017. “Performance Analysis of a Grid Connected Photovoltaic System in Northeastern Brazil.” Energy for Sustainable Development 37: 79–85. doi:10.1016/j.esd.2017.01.004.
- Lugue, A. 2003. Handbook of Photovoltaic Science and Engineering. England: John Wiley & Sons.
- Mekhilefa, S., R. Saidurb, and M. Kamalisarvestani. 2012. “Effect of Dust, Humidity and Air Velocity on Efficiency of Photovoltaic Cells.” Renewable and Sustainable Energy Reviews 16: 2920–2925. doi:10.1016/j.rser.2012.02.012.
- Mensah, D., O. Yamoah, and S. Adaramola. 2019. “Performance Evaluation of a Utility-scale Grid-tied Solar Photovoltaic (PV) Installation in Ghana.” Energy for Sustainable Development 48: 82–87. doi:10.1016/j.esd.2018.11.003.
- Micheli, D., S. Alessandrini, R. Radu, and I. Casula. 2014. “Analysis of the Outdoor Performance and Efficiency of Two Grid Connected Photovoltaic Systems in Northern Italy.” Energy Conversion and Management 80: 436–445. doi:10.1016/j.enconman.2014.01.053.
- Necaibia, A., A. Bouraiou, A. Ziane, N. Sahouane, S. Hassani, M. Mostefaoui, R. Dabou, and S. Mouhadjer. 2018. “Analytical Assessment of the Outdoor Performance and Efficiency of Grid-tied Photovoltaic System under Hot Dry Climate in the South of Algeria.” Energy Conversion and Management 171: 778–786. doi:10.1016/j.enconman.2018.06.020.
- Padmavathi, K., and S. Daniel. 2013. “Performance Analysis of a 3 MWp Grid Connected Solar Photovoltaic Power Plant in India.” Energy for Sustainable Development 17: 615–625. doi:10.1016/j.esd.2013.09.002.
- Renewable Global Status Report (2018). www.ren21.net/gsr_2018_full_report_en
- Sahouane, N., R. Dabou, A. Ziane, A. Neçaibia, A. Bouraiou, and B. Rouabhia. 2019. “Energy and Economic Efficiency Performance Assessment of a 28 kWp Photovoltaic Grid-connected System under Desertic Weather Conditions in Algerian Sahara.” Renewable Energy 143: 1318–1330. doi:10.1016/j.renene.2019.05.086.
- Salim, A., F. Huraib, and N. Eugenio (1988). “PV Power-study of System Options and Optimization.” Photovoltaic Solar Energy Conference (pp.688–692), Netherlands doi:10.1203/00006450-198812000-00007.
- Santiago, I., D. Trillo-Montero, J. Luna-Rodríguez, R. Real-Calvo, and A. Moreno-Munoz (2015, Mar). “Analysis of Variations in PV Production, Focusing on Storage and Dispatchability Decisions.” IEEE International Conference on Industrial Technology (ICIT), Seville, Spain
- Sharma, R., and S. Goel. 2017. “Performance Analysis of a 11.2 kWp Roof Top Grid-connected PV System in Eastern India.” Energy Reports 3: 76–84. doi:10.1016/j.egyr.2017.05.001.
- Sharma, V., and S. Chandel. 2013. “Performance Analysis of a 190 kWp Grid Interactive Solar Photovoltaic Power Plant in India.” Energy 55: 476–485. doi:10.1016/j.energy.2013.03.075.
- Shiva Kumar, B., and K. Sudhakar. 2015. “Performance Evaluation of 10 MW Grid Connected Solar Photovoltaic Power Plant in India.” Energy Reports 1: 184–192. doi:10.1016/j.egyr.2015.10.001.
- Sidi, C., M. Ndiaye, M. El Bah, A. Mbodji, A. Ndiaye, and P. Ndiaye. 2016. “Performance Analysis of the First Large-scale (15 MWp) Grid-connected Photovoltaic Plant in Mauritania.” Energy Conversion and Management 119: 411–421. doi:10.1016/j.enconman.2016.04.070.
- Tarigan, E., and F. Kartikasari. 2015. “Techno-economic Simulation of a Grid-connected PV System Design as Specifically Applied to Residential in Surabaya, Indonesia.” Energy Procedia 65: 90–99. doi:10.1016/j.egypro.2015.01.038.
- Ueda, Y., K. Kurokawa, K. Kitamura, M. Yokota, K. Akanuma, and H. Sugihara. 2009. “Performance Analysis of Various System Configurations on Grid Connected Residential PV Systems.” Solar Energy Materials and Solar Cells 93: 945–949. doi:10.1016/j.solmat.2008.11.021.
- Wittkopf, S., S. Valliappan, L. Liu, K. Ang, and S. Cheng. 2012. “Analytical Performance Monitoring of a 142.5 kWp Grid-connected Rooftop BIPV System in Singapore.” Renewable Energy 47: 9–20. doi:10.1016/j.renene.2012.03.034.