
 ?Mathematical formulae have been encoded as MathML and are displayed in this HTML version using MathJax in order to improve their display. Uncheck the box to turn MathJax off. This feature requires Javascript. Click on a formula to zoom.
ABSTRACT
Public policy has become increasingly stringent in response to environmental challenges, both global and local. In this scenario, materials play a crucial role in the innovation of environmentally responsible products. Design for environment can be identified as the effort to adjust the present design methods to correct known, measurable, environmental degradation. It should be applied in all the phases of the design process, such as the concept, embodiment and detailed analysis. Mostly, it needs to take into account an emerging drawback linked to those raw materials that are considered critical by European Union because of their high supply risk and economic importance. Alloys that minimise the environmental impact of a product may suffer of a supply risk because of the presence, inside them, of high mechanical properties inducing alloy critical elements. A multi-objective design approach is thus proposed that takes into account both the environmental impact reduction and the criticality issues linked to raw materials. The method is illustrated with an example.
1. Introduction
The transition from a ‘Design for Needs’ to a ‘Design for Environment’ first began in the early 1970s. Design for Environment (DfE) is aimed to discover product innovations that will meet cost and performance objectives while reducing pollution and waste throughout the life-cycle.
To reach this goal, different techniques are available. Some of them are used to identify the environmental impact of a product throughout its life cycle such as life-cycle assessment; others help designers to improve the environmental performance of their products. These last are summarised in the work by Telenko, Seepersad, and Webber (Citation2008). Most of the existing DfE guidelines focus on a single life-cycle stage. Examples include Design for Disassembly, Design for Recycling, and Design for Energy Efficiency (Crul and Diehl Citation2006; Fiksel Citation1996). These kinds of strategies are developed separately so that there is the risk that the designer loses the holistic, life-cycle perspective that allows him to follow the best design strategy. It is interesting to know that many industries developed in the past their own strategies to minimise the environmental impact of their products. Volvo (Citation2005), for example, defined a black, grey and white list of prohibited, cautionary, and clean materials. Philips (Meinders Citation1997; White Citation1995) and Siemens (Citation2000) produced their own list of Eco-Design guidelines. On the other hand, different regulations were developed for products in specific industrial sectors. The Restriction of Hazardous Substances (ROHS) and Waste Electrical and Electronic Equipment (WEEE) directives are two recognised sets of rules for prohibited materials in electronics (http://www.icer.org.uk/). Unfortunately, such rules are not useful to the designer in realising new, environmentally friendly concepts and inspiring innovation. Finally, most of the DfE strategies are focused on the industrial production rather than to the product design. They are thus mainly addressed to managers or manufacturing process specialists, rather than product designers.
Ashby (Citation2012) proposed an eco-design strategy based on the observation that in most cases the life-cycle of a product is dominated by only one stage (say, the material production or the product use). The designer should focus on that ‘target stage’ in order to obtain the best results in terms of environmental impact reduction. DeMendonça and Baxter highlighted in their work (Citation2001) how the application of the DfE principles in the first stages of process design can change a product life cycle by not only reducing overall cost, but also the environmental impact of production and disposal.
DfE was defined by Billatos and Basaly (Citation1997) as ‘a design process that must be considered for conserving and reusing the earth’s scarce resources; where energy and material consumption is optimised, minimal waste is generated and output waste streams from any process can be used as the raw materials (inputs) of another’. Unfortunately, they did not know, at that time, of a new emerging drawback linked to raw materials. In fact, nowadays, some raw materials suffer from another emerging problem, different from their possible scarcity in the Earth’s crust, but rather related to their supply risk. Such critical raw materials (CRMs) are identified by the European Commission (EC) (Citation2017) according to some criticality indicators among these probably the most recognised are the economic importance and the supply risk. They are: Antimony, Beryllium, Borates, Cobalt, Coking Coal, Fluorspar, Gallium, Germanium, Indium, Magnesium, Natural Graphite, Niobium, Phosphate Rock, Silicon Metal, Tungsten, Platinum Group Metals, Light Rare Earths and Heavy Rare Earths, Baryte, Bismuth, Hafnium, Helium, Natural Rubber, Phosphorus, Scandium, Tantalum, and Vanadium. The CRMs list is updated every three years. It is important to observe that these materials are classified as ‘critical’ because:
They have a significant economic importance for key sectors in the European economy, such as consumer electronics, environmental technologies, automotive, aerospace, defence, health and steel;
They have a high-supply risk due to the very-high import dependence and high level of concentration of set critical raw materials in particular countries;
There is a lack of (viable) substitutes, due to the very unique and reliable properties of these materials for existing, as well as future applications.
CRMs are linked to clean technologies. They are irreplaceable in solar panels, wind turbines, electric vehicles, and energy-efficient lighting. A smartphone, for example, might contain up to 50 different kinds of metals, all of which contribute to its small size, light weight and functionality.
The criticality assessment related to raw materials is a very difficult task and a great effort was made in literature to reach that goal (Achzet and Helbig Citation2013; Blengini et al. Citation2017; Cimprich et al. Citation2019; Helbig et al. Citation2017). An excellent review of the criticality concept, as well as the methodologies used in its assessment, was presented by Frenzel et al. (Citation2017). In that work, the authors also discussed a number of risks present in global raw materials markets that are not captured by most criticality assessments and, finally, they propose measures for the alleviation of such risks.
In a recent paper, Hofmann et al. (Citation2018) showed that material scientists seem frequently not concerned with the criticality of raw materials in their work so that they suggested to advance the implementation of the concept of materials criticality in materials research and development.
Because the product efficiency strictly depends on CRMs, it is clear that the raw materials criticality concept must be urgently included in the DfE. Materials that minimise the environmental impact do not necessarily reduce the criticality issues related to their CRMs content; thus, a multi-objective strategy taking advantage from trade-off diagrams is necessary.
In the first part of the work the eco-design strategy is summarised. In the second part, a method to quantify the criticality issues linked to raw materials is described and trade-off plots are proposed that link eco-design objectives with the product criticality reduction in a CRMs perspective. Finally, two simplified case studies are illustrated to show the potentiality of the proposed approach in product design.
2. Eco-design strategies
The eco-design strategies take advantage from the analysis of the product life cycle (Life Cycle Assessment (LCA)) (). Ore and feedstock are first mined and processed to yield a material. These are manufactured into a product that is used and, at the end of its life, discarded or recycled. Energy and materials are consumed in each phase, generating waste heat and solid, liquid and gaseous emissions. Each phase of the product life cycle is quantified by an eco-attribute that for the sake of simplicity is the energy consumption or the corresponding CO2 emission.
Figure 1. The material life cycle
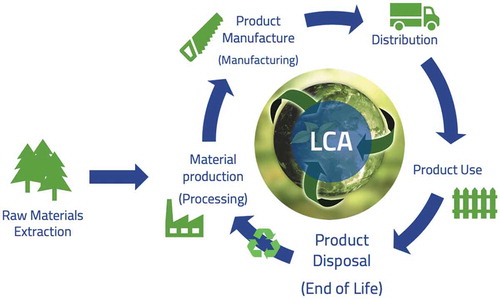
Most of the energy consumed in all the phase of the life-cycle of the product is derived from fossil fuels. In particular, regarding the material production, the fossil-fuel energy consumed in making one kilogram of material is called material production energy (Hp).
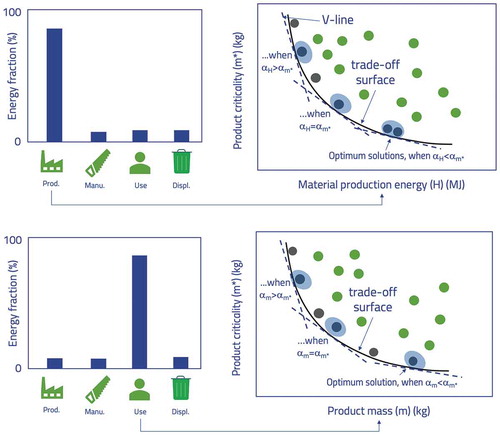
Compared to a single-valued indicator coming from LCA (Ashby Citation2012) that has no simple physical significance, CO2 generation or energy consumption are measurable quantities and carry more convictions in defending design decisions. shows the schematic LCA output of two products, a car and a bicycle. The first one requires energy to perform its primary function (energy-intensive product); the second one provides its primary function without any need for energy than human effort (material-intensive product).
Figure 2. Approximate values for the energy consumed at each phase of for two products (car and bicycle)
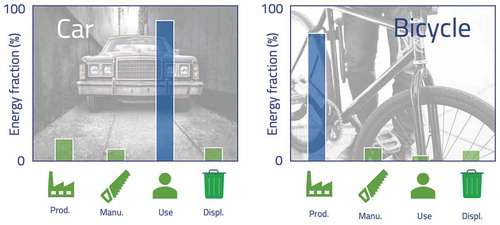
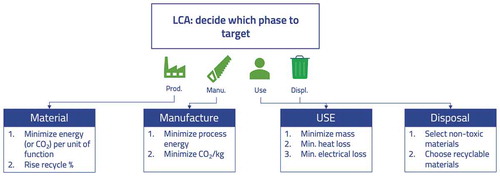
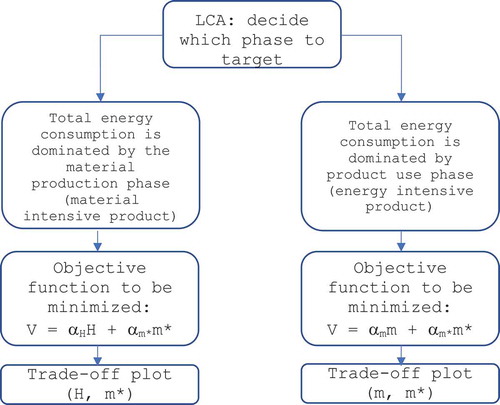
It is generally true that, according to the analysed product, one of the four phases of its life cycle dominates the picture (). If large changes are to be achieved, it is this phase that must be the target. Furthermore, when differences are as great as those of , precision is not an issue. It means that expansive, long and precise LCA is not necessary for eco-design. Approximate data are sufficient to find the dominant life-cycle phase. summarises the strategies to be used in the DfE. A rational procedure starts with an analysis of the phase of life to be target. This decision then guides the method used to minimise the impact of the phase on the environment as shown in .
Figure 3. Eco-design strategies
3. Critical raw materials and criticalities assessment
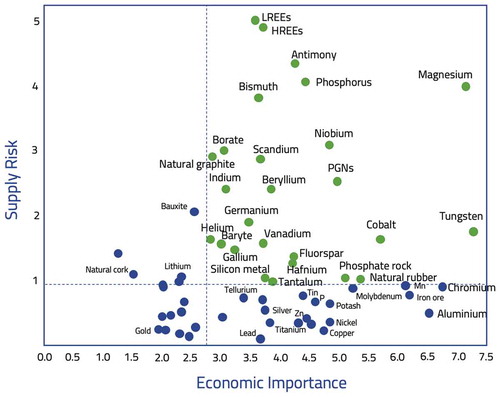
In , raw materials are classified by EU according to their supply risk and economic importance values. Critical raw materials (CRMs) are those located within the criticality zone (supply risk ≥1 and economic importance ≥2.8) of the graph (European Commission Citation2017).
Figure 4. Raw materials classification (European Commission Citation2017)
More in detail, the criticality issues linked to each raw material are quantified by a series of indexes such as the abundance risk, the sourcing and geopolitical risk, the environmental country risk, the supply risk, the economic importance and finally, the end of life recycling input rate defined in Appendix A. These index values may change during time and they are thus updated every three years by the European Commission (Citation2017). In order to use such indicators in design, it is first necessary to aggregate the above-mentioned indexes in an overall general indicator for each critical raw material. One possibility should take the normalised value of each index in order to remove the units and reduce them to a common scale (Helbig et al. Citation2018). Then, they may eventually be weighted to reflect the perceived seriousness of each criticality, and finally, the weighted, normalised measures should be summed or averaged to give the indicator. For the sake of simplicity, in this work the criticality indicator for a CRM ‘i’ (CICRMi) is obtained by averaging the different normalised criticalities indexes defined in Appendix A. As a consequence, the criticality index (CIA) for a generic alloy can be quantified by the following equation:
where n is the number of CRMs in the alloy chemical composition and PCRMi is the weight amount of CRM ‘i’ in the alloy. It is observed that the alloy criticality index (CIA) represents an overall criticality value per unit of mass of the alloy. In a CRMs perspective, the objective to be minimised will be the criticality of the designed component. This objective is formulated by multiplying the mass of the component (m) by the alloy criticality index (EquationEquation 2(2)
(2) ) (Ferro and Bonollo Citation2019; Ferro, Bonollo, and Cruz Citation2020):
Since CIA represents an overall criticality value per unit of mass of the alloy, m* quantifies the criticality of the whole component in a CRMs perspective. This concept can most straightforwardly be applied to metallic alloys.
4. Eco- & criticality-informed material choice
The goal to be reached in the present product design is the minimisation of both the environmental impact and the reduction of the alloy supply risk due to the possible presence of CRMs inside its chemical composition. Strategies that minimise the environmental impact could not reduce at the same time the product criticality. The proposed design strategy is described by the flowchart of . In most cases products can be classified as energy-intensive or material-intensive (). If the material-intensive product is the case, the objective function (V) to be minimised during the design process can be defined by EquationEquation (3)(3)
(3) :
Figure 5. Schematic of the strategies used for eco & criticality-informed material choice
where V is called value function (Ashby Citation2000) or penalty function (a global objective), and it is measured conventionally in units of currency ($, €, etc.), while H is the material production energy per unit of function and αH and αm* are the so-called exchange constants (Ashby Citation2000) or parameter influence coefficients, defined by the following relations:
The exchange constant converts the units of one metric (say, H or m*) into the other, cost, making the sum of different metrics (H and m*) possible. It measures the value of a unit change of the performance metric (i.e.: H or m*) (EquationEquation 4(4)
(4) ). In particular, αm* quantifies the penalty (in units of currency) provided or perceived by a unit increase of m* and αH is the penalty V, quantified in terms of currency, provided or perceived by a unit increase of H.
On the other hand, if the energy-intensive product is the case, the objective function to be minimised may be (EquationEquation (5)(5)
(5) ):
where m is the mass per unit of function (but also the heat or electrical loss per unit of function, ) and αm is the change in value V associated with unit increase in m.
In order to minimise the functions (3) and (5), a trade-off plot is needed (). Each circle in the plots of represents a different material. Those which have the characteristic that no other solution exists with lower values of both the performance metrics are said to be non-dominated solutions; the line on which they lie (approximated with a smooth continuous line, without sharp corners ()) is called the optimal trade-off surface. Now, by rearranging EquationEquations (3)(3)
(3) and (Equation5
(5)
(5) ), the following relations are obtained:
Figure 6. Trade-off plots for material-intensive and energy-intensive products
EquationEquations (6)(6)
(6) and (Equation7
(7)
(7) ) define a linear relationship between m* and H and m* and m, respectively. They are two family of parallel lines called V-lines of slope -αH/αm* and -αm/αm*, respectively. The value of V decreases towards the bottom to the left. Best choice lies nearest the point at which a V-line is tangential with the trade-off surface, since is the one with the smallest value of V. It is interesting to observe that the best material choice depends on V-line slope. It is a question of relative importance assigned to the two objectives to be minimised.
5. Applications
5.1. Air cylinder for a track
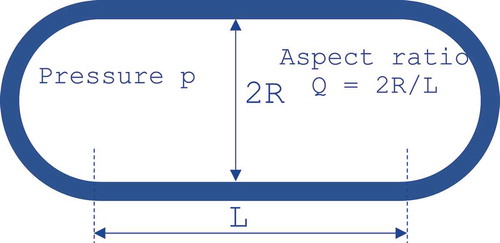
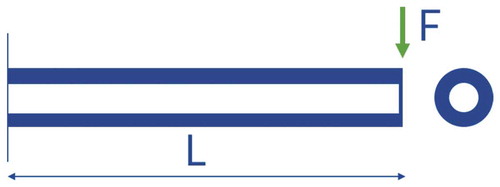
In the following, the DfE in a CRMs perspective of an air cylinder for a truck is illustrated. Trucks rely on compressed air for braking and other power-actuated systems. The air is stored in one or a cluster of cylindrical pressure tanks like that shown in (length L, diameter 2R, hemispherical ends). Most are made of low-carbon steel, and they are heavy. For this reason, it is supposed that the life-cycle phase to target is that of use. In fact, the air cylinder is part of the track; it adds to its weight and thus to its fuel consumption.
Figure 7. Air cylinder for a track
The environmental impact is thus minimised by reducing the mass of the air cylinder (EquationEquation (8)(8)
(8) ):
where Q = 2R/L is the aspect ratio, t is the thickness of the cylinder and ρ is the material density. On the other hand, the drawbacks linked to CRMs used to produce the tank are reduced if the criticality per unit of function (m*) is minimised (EquationEquation (9)(9)
(9) ):
The stress induced by the pressure inside the tank must not exceed the yield strength of the material of the tank wall:
Now, substituting for t (the free variable) in EquationEquations (8)(8)
(8) and (Equation9
(9)
(9) ) gives:
m and m* are minimised by materials that minimise the so-called material indexes M = ρ/σy and M* = (CIAρ)/σy, respectively. In order to minimise both of them, one has to seek the minimum of the value function (V):
By rearranging the terms of EquationEquation (13)(13)
(13) the following family of parallels V contours are obtained (with varying the V value):
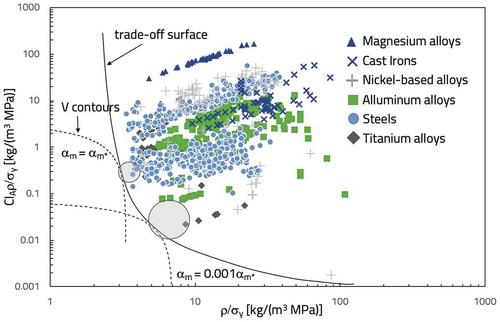
shows the trade-off plot, M against M*. It provides data for about 1000 alloys belonging to the most important metallic materials used in mechanical engineering. The trade-off surface is also shown that identifies the non-dominated solutions. It is observed that materials that minimise the environmental impact, do not do the same for the criticality issues. According to the values assigned to the exchange constants (αm, αm*), the best solutions will lie in the vicinity of the tangential point between the trade-off surface and the V-contour (EquationEquation 14(14)
(14) ) (corresponding to the minimum value of V). For αm = αm* (meaning the criticality issues and environmental impact are valued equally) the steel UNS T5160 (annealed, oil quenched and tempered at 175–260°C) and the titanium alloy Ti-6Al-2Sn-2Zr-2Mo are the two identified potential solutions. If the criticality issues are valued much more seriousness than environmental impact (i.e.: αm = 0.001 αm*), the solution moves to the Titanium grade 4 (EN DIN 3.7065). The analysed case-study was deliberately simplified in order to demonstrate the potentiality of the method in integrating the DfE with the nowadays increasing issues related to CRMs. The obtained solutions must be evaluated by using supporting information and by taking into account other possible constraints defined by the designer such as fracture toughness, maximum thickness and so on. Despite this, the definition of the alloy criticality index allows to integrate the objective of reducing the criticality issues with the objective of minimising the environmental impact in a systematic approach.
Figure 8. Trade-off plot
5.2. Bicycle forks
The first consideration in bicycle design is that the forks should not yield or fracture in normal use. The forks are loaded predominantly in bending () and, for racing purpose, they should be as light as possible. But if the issues associated with environmental impact and critical raw materials are of primary importance, which will be the best alloy to use?
Figure 9. The bicycle forks are loaded predominantly in bending

In this case, the life-cycle phase to target is that of material production energy per unit of function, as shown in . The design has to focus on that phase if he wants to reduce significantly the environmental impact.
For the sake of simplicity, the forks are modelled as beams of length L that must carry a maximum load F without plastic collapse or fracture (). The objective equations are the material production energy required to produce a fork (H) (EquationEquation 15(15)
(15) ) and the function m* (EquationEquation 16
(16)
(16) ), while the constraint equation (EquationEquation 17
(17)
(17) ) ensures that the material does not yield under the load F.
Figure 10. Schematic of a fork
In EquationEquations (15)(15)
(15) and (Equation16
(16)
(16) ), r is the inner radius of the cross-section, t is the thickness of the cross-section (free variable), Hp is the material primary production energy per unit of mass, L is the length of the fork and z is the section modulus (≈ ᴨr2t). Using the constrain equation, the expression of the free variable, t is:
Now, substituting EquationEquation (18)(18)
(18) in EquationEquations (15)
(15)
(15) and (Equation16
(16)
(16) ) gives:
H and m* are minimised by materials that minimise the so-called material indexes M = ρHᴨ/σy and M* = (CIAρ)/σy, respectively. In order to minimise both of them, one has to seek the minimum of the value function (V):
lists 4 candidate materials with their properties.
Table 1. Pre-selected alloys used to produce bicycle forks
For αH = αm* (the criticality issues and environmental impact are valued equally) the steel EN 18CrMo4 is identified as potential solutions because of its lowest V value. If the criticality issues are valued much more seriousness than environmental impact (i.e.: αH = 0.0001 αm*), the solution, among the pre-selected materials, moves to the Aluminium alloy AA6061-T6. It is noted that all the alloys in are used to produce bicycle forks. Yet, the discreteness of the search space for material selection means that a given solution on the trade-off surface is optimal for a certain range of values of α; outside this range another solution becomes the optimal choice. The range can be large (as in the present example, according to how much the Pareto’s set is populated) so any value of exchange constant within the range leads to the same choice of material. Then, approximate values for exchange constant are sufficient to reach precise conclusions about the choice of materials.
6. Conclusions
Basing on the concept of alloy criticality index a systematic approach was proposed to face the design for environment that integrates the growing drawbacks linked to the use of CRMs with those related to the environmental impact. It takes advantage from the method proposed first by Ashby and the use of trade-off plots, H against m* or m against m*, proposed in this work. Best materials depend on the relative seriousness attributed to the two issues quantified by the ratio between the two corresponding exchange constants.
Acknowledgments
This work is part of the results of the European project called ‘Design of Components in a Critical Raw Materials Perspective’ (DERMAP, EIT-RM KAVA project # 17205). Authors want to thank EIT RawMaterials for the financial support and all the Project Partners (SWEREA SWEECAST AB, Mondragon University, AGH University, EURECAT, Enginsoft, Fonderie Zanardi) for their contribution to the project development. Special thanks are due also to GRANTA design® for useful remarks and suggestions.
Disclosure statement
No potential conflict of interest was reported by the authors.
Additional information
Funding
Notes on contributors
Paolo Ferro
Dr. Paolo Ferro is associate Professor of Metallurgy and Materials Selection at the University of Padua (Italy). After the degree in Materials Engineering (Summa Cum Laude) he received the Ph.D. degree from University of Padua in Metallurgical Engineering. He was scientific director of the research program 'Numerical and Experimental Determination of Residual Stresses in Welded Joints and their Influence on Fatigue Strength'. He won the prize for young researchers ‘Aldo Daccò’ 2002. He is a member of Centre for Mechanics of Biological Materials. His research is mainly focused on the analytical and numerical modelling of metallurgical processes. He is author of more than 160 papers and Editor of the book titled Residual Stress Analysis On Welded Joints by Means of Numerical Simulation and Experiments (IntechOpen publishing). In addition to his position as topic editor for the journal ‘Metals’ and his editorial role in different other journals, he frequently serves as reviewer for many international journals and national as well as international funding agencies. He is coordinator of the European project named DERMAP (Design of components in a critical Raw MAterial Perspective).
Franco Bonollo
Dr. Franco Bonollo is full Professor of Metallurgy at the Department of Management and Engineering of Padova University. His scientific activity is focussed on light alloys and composites, foundry processes and their simulation, innovative welding techniques. He is author of about 200 scientific and technical papers. He won for two times (2000 and 2004) the “Dacco' Prize”, which is yearly assigned for the best Italian paper on foundry topics. He is President of the Bachelor Course in Mechanical and Mechatronics Engineering at Padova University. He has been Scientific Coordinator of the EC Leonardo Pilot Projects COPROFOUND (on Numerical simulation of Foundry Processes) and METRO (set up of metallurgy courses with e-learning methodologies). He has been leader of the WP “Quality Mapping” inside the EU Project IDEAL (2002-2005, on the optimisation of cast Aluminium automotive components. He has been Scientific Manager of the EC IP NADIA (New automotive components Designed for and manufactured by Intelligent processing of light Alloys, 2006-2010).He has been Coordinator of the EU Project StaCast (7th FP, 2012-2014, on new Standards for Aluminium alloys) and is Scientific Manager of the EU Project MUSIC (7th PQ, 2012-2016, on process control of High Pressure Die Casting). He is Responsible, for Padova University, of the participation to the European initiative KIC (Knowledge Innovation Community) on Raw Materials. He is also responsible of various research projects, carried out in cooperation with Italian and European industrial Companies.
Sylvia A. Cruz
Sylvia A. Cruz PhD in materials science engineering by the University of Seville (2010). Master in technology and science of new materials (2008). Over 7 years of experience working on research projects in metal matrix composites and metallic materials. 8 scientific publications (6 included in JCR) and 18 contributions in national and international congress. Teaching experience at University of Seville (2008-2010). Currently, she is senior researcher in the line of light alloy into the Metallic and Ceramic Unit of Fundaciò Eurecat.
References
- Achzet, B., and C. Helbig. 2013. “How to Evaluate Raw Material Supply Risks – An Overview.” Resources Policy 38: 435–447. doi:10.1016/j.resourpol.2013.06.003.
- Ashby, M. F. 2000. “Multi-objective Optimization in Material Design and Selection.” Acta Materialia 48: 359–369. doi:10.1016/S1359-6454(99)00304-3.
- Ashby, M. F. 2012, May. Materials and the Environment. Eco-Informed Material Choice. 2nd ed. Oxford, UK: Imprint: Butterworth-Heinemann.
- Billatos, S. B., and N. A. Basaly. 1997. Green Technology and Design for the Environment. Washington, DC: Taylor & Francis.
- Blengini, G.A., Nuss P., Dewulf J., Nita V., Peirò L.T., Vidal-Legaz B., Latunussa C., et al. 2017. EU methodology for critical raw materials assessment: Policy needs and proposed solutions for incremental improvements. Resources Policy, 53: 12–19
- Chapman, A., J. Arendorf, T. Castella, P. Thompson, and P. Willis. 2013. “Study on Critical Raw Materials at EU Level, Final Report.” Oakdene Hollins and Fraunhofer ISI. https://www.google.com/url?sa=t&rct=j&q=&esrc=s&source=web&cd=1&ved=2ahUKEwin1ZjxpJXhAhVa4KYKHQVYD_0QFjAAegQIAhAC&url=https%3A%2F%2Fec.europa.eu%2Fdocsroom%2Fdocuments%2F5605%2Fattachments%2F1%2Ftranslations%2Fen%2Frenditions%2Fnative&usg=AOvVaw1JUpnQZTIwKEo38NyThHb2
- Cimprich, A., V. Bach, C. Helbig, A. Thorenz, D. Schrijvers, G. Sonnemann, S. B. Young, T. Sonderegger, and M. Berger. 2019. “Raw Material Criticality Assessment as a Complement to Environmental Life Cycle Assessment: Examining Methods for Product-level Supply Risk Assessment.” Journal of Industrial Ecology 23: 1226–1236. doi:10.1111/jiec.v23.5.
- Crul, M., and J. Diehl. 2006. “Design for Sustainability: A Practical Approach for Developing.”
- DeMendonça, M., and T. E. Baxter. 2001. “Design for the Environment (DFE) – An Approach to Achieve the ISO 14000 International Standardization.” Environmental Management and Health 12 (1): 51–56. doi:10.1108/09566160110381922.
- European Commission. 2017. “Communication from the Commission to the European Parliament, the Council, the European Economic and Social Committee and the Committee of the Regions.” Brussels, 13/ 09/2017COM(2017) 490 final.
- European Union. 2010. Report of the Ad-hoc Working Group on Defining Critical Raw Materials, 2010, available on the Enterprise and Industry Directorate General.
- Ferro, P., and F. Bonollo. 2019. “Materials Selection in a Critical Raw Materials Perspective.” Materials and Design 177: 107848. doi:10.1016/j.matdes.2019.107848.
- Ferro, P., F. Bonollo, and S. A. Cruz. 2020. “Alloy Substitution in a Critical Raw Materials Perspective.” Frattura Ed Integrita` Strutturale 51 (2020): 81–91. (in press).
- Fiksel, J. 1996. Design for Environment: Creating Eco-Efficient Products and Processes. New York: McGraw-Hill.
- Frenzel, M., J. Kullik, M. A. Reuter, and J. Gutzmer. 2017. “Raw Material ‘Criticality’ – Sense or Nonsense?” Journal of Physics D: Applied Physics 50: 123002. doi:10.1088/1361-6463/aa5b64.
- Helbig, C., A. M. Bradshaw, L. Wietschel, A. Thorenz, and A. Tuma. 2018. “Supply Risks Associated with Lithium-ion Battery Materials.” Journal of Cleaner Production 172: 274–286. doi:10.1016/j.jclepro.2017.10.122.
- Helbig, C., C. Kolotzek, A. Thorenz, A. Reller, A. Tuma, M. Schafnitzel, and S. Krohns. 2017. “Benefits of Resource Strategy for Sustainable Materials Research and Development.” Sustainable Materials and Technology 12: 1–8. doi:10.1016/j.susmat.2017.01.004.
- Hofmann, M., H. Hofmann, C. Hageluüken, and A. Hool. 2018. “Critical Raw Materials: A Perspective from the Materials Science Community.” Sustainable Materials and Technologies 17: e00074. doi:10.1016/j.susmat.2018.e00074.
- Meinders, H. C. 1997. Point of No Return. Eindhoven, The Netherlands: Philips Electronics NV.
- Siemens. 2000. “SN36350-1.pdf: Product Design, Recycling, Environmental Protection, Ecological Compatibility, Product Development.” accessed June 2019. https://www.soas.ac.uk/cedep-demos/000_P508_EAEMS_K3736-Demo/casestudies/media/CS2-Res3%20Siemens%201999%20siemens_env_comp_prod_guide.pdf
- Telenko, C., C. C. Seepersad, and M. E. Webber. 2008, August. “A Compilation of Design for Environment Principles and Guidelines.” Proceedings of IDETC/CIE 2008 ASME 2008 International Design Engineering Technical Conferences & Computers and Information in Engineering Conference, New York, USA.
- Volvo. 2005. “Black, Grey and White Lists.” Ecology Center, http://www.ecocenter.org/dust/ Web site https://ec.europa.eu/growth/tools-databases/eip-raw-materials/en/community/document/critical-raw-materials-eu-report-ad-hoc-working-group-defining-critical-raw. Web site: https://ec.europa.eu/transparency/regdoc/rep/1/2017/EN/COM-2017-490-F1-EN-MAIN-PART-1.PDF
- White, P. 1995. Green Pages, Guideline for Ecological Design. Eindhoven, The Netherlands: Philips Electronics NV, Philips Corporate Design.
Appendix A
The raw materials criticalities taken into account in the present work are: the ‘Abundance Risk Level’, the ‘Sourcing and Geopolitical Risk, the ‘Environmental country risk’, the ‘Supply Risk’, the ‘Economic Importance’ and the ‘End of Life Recycling Input Rate’. Their definition and values are summarised in the present Appendix.
The Abundance Risk Level (ARL) of the CRM ‘i’ is associated to the value of the ‘Abundance in the Earth’s crust (AEC) [ppm]’ by the following proposed relation:
where AECCRMi stays for the amount in the Earth’s crust of the CRM ‘i’ (measured in ppm) and AECCRMmax is the maximum value found in the CRMs list.
The Sourcing and Geopolitical Risk (SGR) index indicates the supply disruption risk due to political factors, based on the countries in which the element is produced and the concentration of worldwide production. A higher value means a higher risk.
In this work the SGR index of the CRM ‘i’ is given by
where HHIWGIi is the modified and scaled Herfindahl-Hirschmann Index of the critical element ‘i’ [20] while HHIWGImax is the maximum value reached by the index HHIWGIi in the CRMs list.
The Environmental country risk (ECR) indicates the risk that worldwide supply of an element may be restricted in future as a result of environmental protection measures taken by any of its producing countries. A higher value means a greater risk that environmental legislation may restrict supply in the future. It is quantified, for an element ‘i’, by the following equation:
where HHIEPImax stays for the maximum value reached by the index HHIEPIi (EU Report, Citation2010) in the CRMs list.
The Supply Risk (SR) indicator quantifies the inadequate supply of a raw material to meet industrial demand. The formula for the calculation of the SR index for the element ‘i’ is given in (EU Report, Citation2010):
In this work, the normalised SR indicator (NSR) is used
where SRmax stays for the maximum value reached by the index SRi in the CRMs list
The economic importance of a raw material ‘i’ (EIi) is calculated as the weighted sum of the individual megasectors (expressed as gross value added), divided by the European gross domestic product (GDP) (Chapman et al. Citation2013). In the present work, the normalised EI indicator is defined as follows:
where EImax stays for the maximum value reached by the indicator EIi in the CRMs list
Finally, The End of life recycling input rate (EOL-RIR) is ‘the input of secondary material to the EU from old scrap to the total input of material (primary and secondary)’. In order to assess the overall criticality index for each CRM, a recycling drawback index (RDI) is defined for the first time as follows:
A rational calculation of the criticality indicator for the CRM ‘i’ (CICRMi) is obtained by averaging the above-defined, scaled (0–10), normalised and weighted criticalities index values (EquationEquation (A.7)(A.7)
(A.7) ):
In EquationEquation (A.7)(A.7)
(A.7) k is a non-dimensional coefficient which value is in between 0 and 1, according to the seriousness of the corresponding criticality aspect.
The values of the criticality indicators in EquationEquation (A.7)(A.7)
(A.7) are calculated by using data taken from the literature (https://publications.europa.eu/en/publication-detail/-/publication/08fdab5f-9766-11e7-xb92d-01aa75ed71a1). For the reader convenience, they are collected in Table A1.
Table A1. Values of the criticality indexes for different CRMs (k = 1 for each index in EquationEquation (A.7)(A.7)
(A.7) )