
 ?Mathematical formulae have been encoded as MathML and are displayed in this HTML version using MathJax in order to improve their display. Uncheck the box to turn MathJax off. This feature requires Javascript. Click on a formula to zoom.
ABSTRACT
In this paper, the complementary characteristic of battery and flywheel in a PV/battery/flywheel hybrid energy storage system is explored for a solar PV-powered application. The impact of hybridising flywheel storage technologies with battery on the ageing of battery and its economic effectiveness when used with a PV system is presented. The ageing of a lead acid battery is modelled using Schiffer weighted Ah-throughput model while the economic analysis is modelled using total cost of ownership approach. Two scenarios (i.e. PV/Battery and PV/Battery/flywheel) are created to appreciate the complementary characteristics of a hybrid storage system in a PV-powered application. Sensitivity analysis was also carried out to understand the effect of a change in degradation and corrosion limit as well as charging and discharging current on the ageing of a lead acid battery. Some of the key results reveal that a hybrid of Battery/Flywheel presents a lower capital and total cost of ownership compared to battery only when used in a PV powered-combined fishery and poultry farm. The results also show that the life of a lead acid battery can be extended when combined with a flywheel compared to a battery only storage system.
1. Introduction
In recent years, Solar PV is considered as a sustainable renewable energy source that is capable of meeting electricity demand across the globe (Ayodele and Ogunjuyigbe Citation2015a). However, the irregular nature of solar irradiance causes erraticism in the output power of PV modules resulting in variations in the amount of energy derivable from the system (Ogunjuyigbe, Ayodele, and Akpeji Citation2018). One of the viable solutions to mitigate this is the use of storage technologies. Conversely, every storage technology has its merits and limitations (Ayodele and Ogunjuyigbe Citation2015b), hence, the need to hybridise storage technologies. This results in a strong technology that will permit the drawback of one to be compensated for by the benefit of another. Generally, Lead-Acid battery is the most used storage system in PV applications such as water pumping (Rohit and Rangnekar Citation2017). This is due to its low cost price, ripeness of technology, high energy density, considerable good life cycle under measured conditions and its market accessibility (Mahlia et al. Citation2014). The attractiveness of the battery has also been linked to its sustainability, dependability and security in terms of safety (May, Davidson, and Monahov Citation2018). However, the battery has the drawback of low power density which negatively affects the ageing (i.e. shortened lifespan) of the battery when sudden high currents are demanded from the battery. Ageing of battery is mainly as a result of an upsurge in corrosion and degradation in the battery when instantaneous (inrush) current is drawn from the battery (Ayodele, Ogunjuyigbe, and Olateju Citation2018).
In an attempt to understand the ageing pattern of the different types of battery, different researchers have built and utilised different models. For example, Kim et al. (Citation2009) used a one-dimensional model based on finite element method to estimate the capacity reduction of a lead-acid battery due to ageing taking into account electrochemical kinetics, battery cell ionic mass transfer and anodic corrosion of lead in sulphuric acid. The authors compared the results to that of measured data and demonstrated a good correlation between the model and the measured data. In another work, the effect of self-reconfiguration was investigated on lifetime and performance of a battery by Bouchhima et al. (Citation2018). The authors adopted iterative algorithm approach to determine the effect of dynamic cell switching on the ageing advancement on each cell of a battery. They developed a semi-empirical ageing model that aids battery reconfiguration for lifetime improvement and then compared to the conventional batteries. A 16% improvement in battery life was achieved for self-reconfiguration topology yielding an energy throughput improvement of about 16.8% compared to the conventional battery topology. Zhang, Du, and Salman (Citation2017) proposed a two-time-scale model-based estimation method that can estimate battery status such as SOC and SOH as well as update battery model parameters to fit the ageing status of the battery under monitoring. The experiment results showed that the proposed scheme was effective for battery state estimation even when the battery is undergoing ageing processes. It was further revealed that the updated battery model could enable prediction of accurate battery remaining useful life. Layadi et al. (Citation2015) proposed an approach for assessing the lifetime of lead-acid battery incorporated into a hybrid grid system. The proposed methodology was used to examine the effect of design as well as the management strategy of power systems on the ageing of battery. The authors concluded that both the battery and DG longevity could be decreased if there is a reduction in the depth of discharge with higher number of cycles and startups of DG. It was also revealed that the lifetime of Tube-like lead acid batteries is relatively better. The authors also opined that a reasonably over-sized battery could increase longevity of batteries.
Researchers have also made attempts to model and investigate issues associated with other batteries types other than lead acid battery. For example, Sessa et al. (Citation2016) have modelled Sodium Nickel Chloride battery using a matrix form and interpolation function with an aim of forecasting its steady-state operation in a MATLAB/Simulink environment. The measurement of the modelled results was compared to that of a real battery for validation. From the results, the maximum battery voltage difference for a 2.38A one complete discharge is 1.05% and a 38A current complete discharge is 2.04%. Also, the maximum voltage difference of 5A charging current is 4.6% and the maximum error current difference is 5.6%. It was concluded that the steady-state behavioural comparison results of the battery do not fit perfectly. Similarly, in Sessa et al. (Citation2017), the transient operation of the Sodium Nickel Chloride battery was presented with an easy but very detailed model by predicting the voltage of the battery during a very fast switch from the battery charge state to discharge state. With a precise electrical modelling approach, they modelled the key parameters in determining high accuracy battery behaviour which are the Open Circuit Voltage (OCV), internal resistance, battery Depth of Discharge (DoD) and NiCl2 reaction front. The authors later validated their model by comparing the experimental results with the transient state behaviours simulation result. The maximum error difference in the result was 1.08% while the difference between the measured charge and discharge path was less than 1V. Also, the average error in the transient state was about 1%. The authors concluded that the simulated battery behaviour fitted well with the experimental results. In another work, Reniers et al. (Citation2018) have modelled and predicted three Li-ion battery with increasing difficulties along with different battery degradation model in a grid application. Their result accuracies were now compared with an experimental result/data (i.e. Mat4Bat). It was reported that as the complexity increases so is its accuracy with a reduction in the root mean square error (RMSE) from 11% to 5%. These models alongside their degradation were then optimised to perform a year price arbitrage where the most profitable model yielded 175% improvement. It was concluded that a sophisticated model might be needed to conduct economic analyses of a grid-connected battery so as to reduce the error completely in a business case. Hesse et al. (Citation2017) investigated and analysed a Lithium-ion-based storage system design for a particular system application with a view to recommend proper battery technology.
Various authors have worked on a hybridised configuration of energy storage systems and the various reports demonstrated the good performance of a hybrid storage system over a standalone storage system. For example, Li et al. (Citation2018) proposed a hybrid energy storage system composed of superconducting storage energy system and battery to compensate for power variability in a micro grid as well as increasing the battery lifetime. The result showed that battery undergoes lesser cycles in the hybrid system compared to the battery only system and also increases the battery life from 6.3 years to 9.2 years resulting in 44.36% battery life extension. Similarly, an algorithm for a smart energy management for hybrid energy storage system was experimentally investigated by Aktas et al. (Citation2017) for smart grid application. In their study, a hybrid of battery and ultra-capacitor were used as storage system in a PV-powered system. The result shows that the proposed algorithm was capable of accurately supplying the dynamic loads while improving the battery lifetime. In another research, Veneri, Capasso, and Patalano (Citation2017) proposed a hybrid system of battery and an electric double layer super-capacitor connected to a bidirectional DC-DC converter to smoothen the electric power fluxes between the hybrid components for electric vehicle application. The authors reported that super-capacitors can improve the expected battery lifespan by about 52%. Bocklisch (Citation2015) gave an overview of the different types of energy storage systems and hybrid energy storage systems in different combinations considering the characteristic possessed by each storage system for renewable energy applications. The energy management and power flow decomposition based on peak shaving was also discussed. Kouchachvili, Yaïci, and Entchev (Citation2018) proposed hybrid battery/super-capacitor to supply the additional energy needed by an electric vehicle and also to improve the electrochemical processes in the battery. The super-capacitor was intended to improve the battery capacity as well as enhancing the cycle of the battery when sudden power consumption is demanded during acceleration of an electric vehicle. In Dambone Sessa et al. (Citation2018), a flywheel and battery hybrid storage system has been proposed to examine grid frequency regulation methodically and in detail. The batteries are made with a Lithium-manganese oxide cathode and a graphite anode while the project investigated the advantages of hybridising the battery system with a flywheel system to reduce battery ageing acceleration experience. The battery and its ageing were modelled using MATLAB/Simulink while, the output performance was compared with an experimental result of the same battery module. In the same vein, the flywheel system was modelled and implemented in a Simulink environment. Both the thermal and the electromechanical phenomena governing the electrical power exchange of the flywheel system were considered in the model. The flywheel model was thereafter hybridised with the battery, and a comparison of the battery ageing performance was performed. The authors reported that the power sharing applied to a two flywheel arrangement could lessen the battery ageing and increase battery life by more than 20% during a grid frequency regulation application. In another work, Barelli et al. (Citation2018) presented the dynamic analysis of a flywheel and a battery pack hybrid energy storage system connected to a PV generator in a grid connected application to improve grid safety and stability due to high goring of renewable plants into the grid and reducing oscillation in battery load profile. This hybrid storage system and a micro-grid were dynamically modelled and implemented along with a power management and control algorithm. The result revealed that an oscillation valued below 3A was achieved in a hybrid system while 7A oscillation value was obtained in a battery standalone system. This signified oscillation reduction for hybrid storage system compared to the standalone storage system.
A small commercial satellite (aerospace) load demand has been used to develop and size a flywheel energy system using energy balance equation by Aydin and Aydemir (Citation2016). The authors revealed that high windage losses were experienced which increased with an increase in flywheel surface area. A round trip efficiency of 58.9% was obtained experimentally under earth condition which could be increased to about 89% when operated in a vacuum environment (spacecraft) after theoretical calculations. He suggested flywheel should be operated in a vacuum environment to achieve a high efficiency and to minimise mechanical losses. In a different work, the principles and importance of different energy storages have been discussed by Hall and Bain (Citation2008). A comparison of these technologies was compared in terms of lifetime, efficiency and ability to bridge the gap between energy density and power density. Barelli et al. (Citation2019) have investigated the usefulness of different types of batteries and mechanical flywheel in a hybrid energy system for a residential micro-grid. It was revealed that the lifecycle of lead gel hybrid system improved compared to the standalone battery system while the lifetime of an hybridised lithium-ion battery packs increased to about 3.6 times. The results were validated using ageing tests on LiFePO4 cells over three equivalent years of operation. In another work, Eriksson et al. (Citation2013) developed a simulation of flywheel angular velocity for misfire and driveline disturbance. A cylinder torque was modelled using an analytical cylinder pressure model while crankshaft and driveline oscillations were modelled using a multi-body model with torsional flexibilities. Misfires, cylinder variations, changes in auxiliary load and flywheel manufacturing errors were taken into consideration in the speed variations simulation. The possibility of realising a stable levitation in flywheel over a permanent magnet by using high-temperature superconductor was presented by Kohari and Vajda (Citation2005). A high-temperature superconductor levitated flywheel and PV systems were later installed as the energy storage system and power supply, respectively, to validate the simulation report. The authors revealed that hysteresis loss and eddy current losses were determined as 0.5W and 2.5W, respectively, at 3000 rpm.
While many authors have contributed in the area of hybridisation of the various energy storage systems, i.e. battery/super-capacitor, battery/hydrogen, battery/Superconducting Magnetic Energy Storage (SMES), battery/flywheel as presented in the aforementioned studies; however, battery/flywheel energy storage system has not been sufficiently investigated. Lead-acid battery and flywheel have complementary characteristic which would make the hybrid of the duo a robust corresponding energy storage system. Flywheel technology is known to offer the following advantages: long life of 15–20 years (Beaudin et al. Citation2010), insensitivity to a depth of discharge (DOD) (Yang et al. Citation2008), considerably high power density, high peak power capacity without overheating (Chen et al. Citation2009) and very good energy efficiency (Lazarewicz and Arseneaux Citation2006). However, flywheel has very low energy density making it difficult to operate as a standalone energy storage system. Conversely, a lead acid battery has a shorter lifetime, it is very sensitive to the depth of discharge but with a high energy density. In addition, lead acid battery has low power density which could escalate the rate of degradation and corrosion when high inrush current is drawn from the battery leading to quick ageing of the battery. These complementary characteristics would make battery/flywheel a robust energy storage system if combined in hybrid form. Therefore, this paper provides an insight into the ageing of battery in a PV-powered application. It also reveals the complementary role of a flywheel at improving the ageing of battery while enhancing the battery lifetime and reducing the system lifecycle cost in a PV-powered application with a battery/flywheel storage system. The PV/Battery/Flywheel system was modelled and optimally sized based on minimum total cost of ownership, loss of load probability and dump energy using the iterative algorithm approach for a PV-powered combined fishery and poultry farm. This paper provides a useful insight into the complementary roles of a storage system as no single storage system is on its own complete.
2. Hybrid battery/flywheel for PV powered-application
In order to appreciate the complementary relationship of battery and flywheel energy storage system, two energy storage scenarios were created: scenario 1 consisting of battery only configuration and scenario 2 comprising Battery/Flywheel hybrid system. The two energy storage scenarios were separated and at different time used as storage system for a PV-powered combined fishery and poultry farm where water use is very important. Water Pressure Pumping Machine (AWPPM) which makes use of an induction motor is used as the device for pumping water into the storage tank and is powered using PV systems. Due to the intermittent nature of solar irradiation, a storage system is required. Battery only and Battery/flywheel storages were used at different time as the storage system to give room for comparison. The electrical energy demands and the daily hours of operation of electrical appliances of a selected combined fishery and poultry farm are depicted in . The farm is located in a remote part of Abeokuta, South Western Nigeria where there is no access to the electricity grid. The energy demand of the farm was determined through energy audit exercise. The daily load profile was thereafter determined as shown in ) for weekdays and weekends for the dry and the wet season, respectively.
Figure 1. Daily load profile of a typical combined fishery and poultry farm in South Western Nigeria. (a) For weekdays and weekends of the dry season (b) For weekdays and weekends of the wet season.
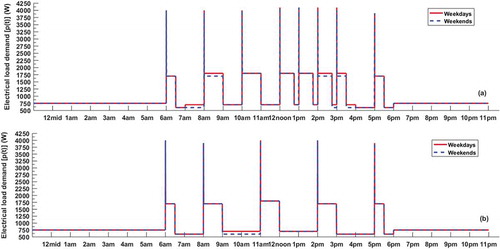
Table 1. Load profile of the farm.
The nature of fishery and poultry farming requires water to be pumped many times within a day as can be observed in . The pumping machine has a high inrush current when started (ON) because it is made up of an induction motor which has a high starting current. This caused the obvious spike at certain hours of the day in the daily load profile of . The spikes due to starting of induction motor could put high stress on the battery storage system thereby reducing its lifespan (Ayodele, Ogunjuyigbe, and Olateju Citation2018).
The Electrical power demand of a typical fishery and poultry farm can be modelled as follows:
where is the current drawn by the pumping machine when running,
is the current drawn from the line when pumping machine is started, Prated is the rated power of the pumping machine and VL-L is the line voltage, V is the phase voltage,
is the fixed base load, i.e the load of electrical appliances beside the pumping machine.
is used to denote the status of the water pumping machine during starting while
is the status when running. The status can be mathematically modelled as follows:
The total energy demand () of the fishery farm in Wh can be written as:
Where is the time of operation of the electrical load.
3. Modelling of system components
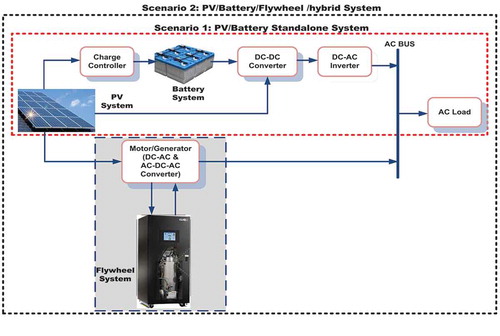
The schematic diagram depicting the two energy storage system scenarios is presented in . The topology configurations used are similar to some of the topologies described in (Singh, Bansal, and Singh Citation2019). The first scenario consist of the multi-input DC/DC Battery/PV converter configuration where the PV and the battery bank are connected to a common DC/DC converter for simplified structure (Singh, Bansal, and Singh Citation2019) while the second scenario is made of multiple converter (Singh, Bansal, and Singh Citation2019) battery/flywheel configuration where the flywheel and battery bank are individually connected through their individual converters to the AC busbar. In each of the scenarios, the system components (i.e. PV, battery and Flywheel) were modelled and thereafter optimally sized using Iteration Sizing Approach (ISA) (Aziz et al. Citation2017).
Figure 2. PV/Battery and PV/Battery/Flywheel hybrid system configurations.
3.1. PV system model
Weather is the only important factor that influences the performance of a photovoltaic system. The cells are connected in different configurations (series and/or parallel) in order to meet power capacity and voltage needed by the load. Photovoltaic system requires little maintenance and does not require a starting fuel, resulting in low maintenance cost and longer years before replacement. (Rawat, Lamba, and Kaushik Citation2017). In this paper, the PV system serves as an electricity generator for the load and also for charging the storage systems. The number of PV modules needed to meet the load requirements is calculated using the equations:
where is the PV hourly output power, ɳpv is the PV efficiency, ɳbatt is the battery efficiency, ɳinv is the inverter efficiency and ɳcon is the DC-DC converter efficiency, APV is the surface area of the PV module, Ed is the load demand as obtained in (4), GAV is the average global irradiance of the farm location, ATcf is the temperature correction factor, hr is the time in hour and Ppeak is the maximum power of the PV module. The parameters of PV module (MSX60 cell) used in the study are presented in and the solar irradiance (GAV) of the location where the farm is located is depicted in .
Figure 3. One year hourly solar irradiance of the farm location.
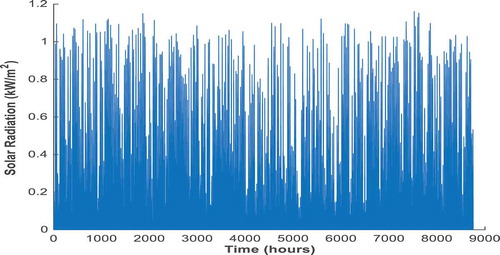
Table 2. MSX60 solar cell manufacturer specifications used in the PV modelling.
3.2. Battery system model
The amount of power that can be supplied by battery depends on the number of batteries in series and/or parallel configuration (Amrouche et al. Citation2016). A battery is reliable with high efficiency; however, in order to avoid frequent replacement and high maintenance cost due to quick ageing, it needs to be protected from supplying heavy starting current (Rohit, Devi, and Rangnekar Citation2017). The number of batteries (NBatt) required for supplying load can be estimated as follows:
where ɳs is the overall system component efficiency, ɳbatt is the battery efficiency, ɳinv is the inverter efficiency and ɳcon is the DC-DC converter efficiency, Ed is the load demand as obtained from (4), Da is the battery number of autonomy days, VB is the battery supply voltage, is the nominal energy a battery can supply, CWh is the total energy needed from the battery and DoD is the depth of discharge.
3.3. Flywheel model
A flywheel is a storage technology that stores and delivers energy in a short time. This technology can achieve about 85% round-trip efficiency (Tawadros, Zhang, and Boretti Citation2014). Flywheel has considerable high power density and can withstand high rate of charge and discharge cycle (Rohit, Devi, and Rangnekar Citation2017; Sebastián and Alzola Citation2012). The technology is environmentally friendly with low maintenance. In this paper, a flywheel is used to supply power to the water pumping machine during starting so that the inrush current needed by the induction motor is delivered by the flywheel rather than the battery.
The energy stored in the flywheel () is determined by the moment of inertia (
) and angular velocity (ω) of the rotor and can be determined as follows (Rupp et al. Citation2016)
The moment of inertial J is a function of the mass of the rotor and the rotor shape factor. Flywheel is often built as a solid or hollow cylinder ranging from short and disc type to long and drum type. For a solid cylinder or disc type flywheel, the moment of inertia is given as
where m is the mass of flywheel and r is the radius.
For a hollow cylinder flywheel with outer radius and inner radius
, the moment of inertia is
Given that the length of the flywheel is and mass density
, the moment of inertia is determined by:
Therefore, the energy stored in the flywheel can be determined using:
Coupling a motor/generator machine such as Axial-Flux Permanent Magnet Machine (AFPM) with the flywheel will reduce losses and increase power output. This is because of the machine flexible rotor design configurations, high overload capability, cooling system arrangement (Bolund, Bernhoff, and Leijon Citation2007), high overall efficiency and high speed (Faraji, Majazi, and Al-Haddad Citation2017). A mechanically double side slotted TORUS (i.e. one-statue-two-rotor topology) machine has been modelled using EquationEquations (16(16)
(16) )–(Equation19
(19)
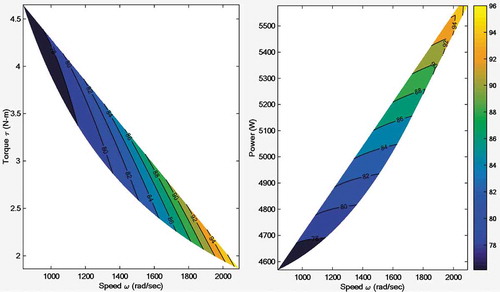
(19) ). The machine torque, power output and efficiency of the required flywheel speed were determined using the parameter/coefficients furnished in (Aydin, Huang, and Lipo Citation2001; Mahmoudi et al. Citation2012, Citation2013; Mahmoudi, Rahim, and Ping Citation2012). The diameter ratio and air-gap flux density values were varied in accordance to Aydin, Huang, and Lipo (Citation2001) to obtain the desired output power. The relationships between the motor/generator (AFPM) machine efficiency, torque, power and speed are depicted in while the efficiency map of the motor/generator machine is illustrated in .
Table 3. Double Side Slotted Axial-Flux Permanent Magnet Machine (AFPM machine) specifications.
where Pout is the electrical-machine-output power, Le is the machine’s effective axial length, Kϕ is the electrical loading ratio on rotor and stator, Ki is the current-waveform factor, KL is the aspect ratio coefficient with respect to a specific machine structure, m* is the number of phases of each stator, Bg is the flux density in air-gap, f is the converter frequency, p is the machine pole pairs, λ is the AFPM machine’s diameter ratio Di/Do, Do is the machine’s outer surface diameter, Di is the machine’s inner surface diameter. A is the total electrical loading, Ke is the EMF factor, Pcu is the copper loss, Pcor is the core loss, Prot is the rotational loss components, Ph hysteresis loss, Pe is the eddy current loss, Rs is the stator resistance, ω is rotor angular speed, cf is friction coefficient, ρr is density of the rotating part, n is rotation speed (in rad per min) and η is the machine efficiency.
Figure 4. Plots showing the relationship between (a) the torque and speed (b) output power and speed (c) efficiency and torque and (d) efficiency and speed of the AFPM machine.
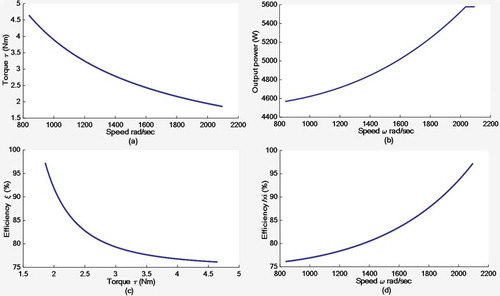
Figure 5. Efficiency map of the AFPM machine.
Bearings are nominally required to keep the rotor in place with a very low friction, yet providing a support mechanism to the flywheel (Pham and Månsson Citation2017). Superconducting Magnetic Bearing (SMB) bearing is required because high speed at free friction is required (Long and Zhiping Citation2008) (i.e. low maintenance and no lubrication). Also, SMB ensures that self-stability (Amiryar and Pullen Citation2017) at a very low temperature is provided for the flywheel system (Faraji, Majazi, and Al-Haddad Citation2017). A cryogenic cooling system is only required to avoid bearing failure (Faraji, Majazi, and Al-Haddad Citation2017). It is essential to house the system for safety reasons in the occurrence of failure. This is to reduce drag losses (Amiryar and Pullen Citation2017) as well as to achieve high efficiency (Aydin and Aydemir Citation2016). Drag losses reduce when the flywheel system is housed in a low-pressure vacuum enclosure (Amiryar and Pullen Citation2017). Also, operating flywheels in a low (rough) vacuum pressure and cooling with helium gas (due to its low density and low viscosity) will improve efficiency and extend system life (Aitchison et al. Citation2017; Sebastián and Alzola Citation2012). Evacuating vacuum down to around 0.1Pa in a Low (Rough) vacuum will require a commercial vacuum pump to maintain the flywheel housing at that very low pressure (Aitchison et al. Citation2017).
3.3.1. Flywheel system losses
Losses occur in every component of a flywheel-based-energy storage system. It can be categorised as mechanical losses (i.e. drag, bearing and frictional losses), electrical losses (i.e. hysteresis, eddy current and copper losses) as well as power converter losses (i.e. switching loss). These losses are associated with the high speed of the motor/generator and the flywheel, bearing friction, etc., which affect the total output of the flywheel system. The losses need to be reduced to the barest minimum for improved efficiency.
The bi-directional power electronic converter topologies commonly used in the flywheel-based applications are the combinations of DC/AC and/or AC/DC/AC. The working attributes and the applications of these power electronic converter determine the type of transistor (Thyristor, IGBT, BJT, SCR, etc.) and the switching mechanism to be adopted (Amiryar and Pullen Citation2017). However, power electronics losses occur as a result of switching. This is because power is dissipated as heat in the semiconductor switching operation which in turns add to the loss in the system (Abrahamsson et al. Citation2012).
The electrical losses in the motor/generator also contribute to the overall losses of a flywheel system. This is mainly due to the stator and rotor losses in the total motor/generator set. This is as a result of the total copper loss in the stator winding and the core losses in the core. The copper loss is proportional to the square of the stator current and dependent on the stator resistance/The core losses comprises the eddy current and hysteresis losses and it is a function of the electrical angular frequency and the maximum magnetic flux density.
It is essential to house the system for safety reasons in the occurrence of failure. This is to reduce drag losses (Amiryar and Pullen Citation2017) as well as to achieve high efficiency (Aydin and Aydemir Citation2016). Drag losses reduce when the flywheel system is housed in a low-pressure vacuum enclosure (Amiryar and Pullen Citation2017). Also, operating flywheels in a low (rough) vacuum pressure and cooling with helium gas (due to its low density and low viscosity) will improve efficiency and extend system life (Aitchison et al. Citation2017; Sebastián and Alzola Citation2012). Evacuating vacuum down to around 0.1Pa in a Low (Rough) vacuum will require a commercial vacuum pump to maintain the flywheel housing at that very low pressure (Aitchison et al. Citation2017).
The energy that can be delivered by the flywheel system can be evaluated as follows:
where is the flywheel roundtrip efficiency.
The details of the material used for the flywheel as well as the calculated inertia, stored and output energy are depicted in .
Table 4. The properties of materials used, stored and output energy.
4. Sizing of the system component for combine fishery and poultry PV-powered application
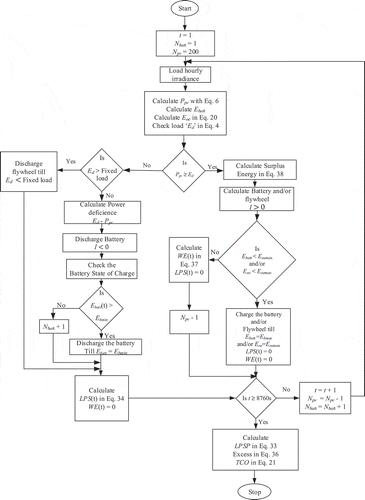
In order to obtain an effective hybrid-energy storage system for PV-powered application, it is important to determine the right sizes of the combination of system components (i.e. the PV, battery, flywheel) that will give the minimum Life Cycle Cost, minimum excess energy and maximum reliability. The reliability is determined using Loss of Power Supply Probability (LPSP) index. The TCO, excess energy and the LPSP are combined together in determining the optimal combination of the hybrid system sizes using Iteration Sizing Approach (ISA) (Aziz et al. Citation2017). The optimal combination which is the desired sizing is the combination of PV, battery and Flywheel with minimum TCO, LPSP and Excess Energy.
4.1. Total cost of ownership
Total Cost of Ownership (TCO) is the cost incurred during the lifespan of a project (Ayop, Isa, and Tan Citation2017) and it can be calculated as follows
Where TCO is the total cost of ownership is the annual system cost ($) and M is the period of loan payment.
The annual system cost consists of three components (i.e. the annual total capital cost (), the annual operation and maintenance cost (
) and the annual replacement cost (
)) and can be estimated using:
The total capital cost () involves the capital cost of the component making up the projects and other miscellaneous costs such as the cost of installation. It can be calculated using the following relations:
where is the total capital cost,
is the system component capital cost,
is the other cost besides the system component cost, NPV is the number of PV modules. NBatt is the number of batteries. NFW is the number of flywheels, CPV is the cost of PV module, CBatt is the cost a battery, CFW is the cost of a flywheel, CPCS is the power conversion cost which includes converter/MPPT, inverter, power electronics and charger. CBOP is the project construction cost, protective device and management cost which is 5% of the total capital cost. CRF is the capital recovery factor, IL is the loan interest rate, M is the period of loan payment.
While the annual operation and maintenance cost can be determined as follows:
where is the annual operation and maintenance cost,
is the operation and maintenance cost,
is the PV maintenance cost,
is the battery maintenance cost,
is the flywheel maintenance cost,
is the inflation cost and N is the project lifetime.
Some components would have to be replaced within the project lifetime such as the battery and the power conversion devices (i.e. the converter/MPPT, inverter, power electronics and charger). The annual total replacement cost of these components can be determined using the following relations:
where is the annual replacement cost of the whole system,
is the annual replacement cost for battery,
is the annual replacement cost for all power conversion components,
is the replacement cost for battery,
is the replacement cost for all power conversion components,
is the interest rate offered by the bank for a savings account.
The values used in determining the TCO are presented in and
Table 5. Cost values used in evaluating the life cycle cost.
Table 6. Parameters used in determining the TCO.
4.2. Loss of power supply probability
Loss of Power Supply Probability (LPSP) is an index that determines the reliability of power supply to the load. It is the ratio of total loss of power supply (LPS) over a period of time to the load demand i.e. the percentage of supply power from PV and battery systems that cannot fulfill the load demand. The desire is to make LPSP as minimum as possible and can be evaluated using the following (Al Riza, Gilani, and Aris Citation2015; Eteiba et al. Citation2018; Khatib, Ibrahim, and Mohamed Citation2016):
where LPS is the Loss of Power Supply, TT is the specific time period, Ed is load demand, is the energy supply by the PV and the battery. It should be noted that flywheel is not taken into consideration here because it is only used at the time of high inrush current. i.e. when pumping machine is turned ON, PPV is the hourly PV output power, Ebatt is the battery energy, Ebmin is the minimum energy that can be taken from the battery and
is the efficiency of the inverter.
4.3. Excess energy
Excess energy index () is the ratio of waste energy WE to the PV output power and the desire is to make it as minimum as possible. Waste energy is the energy that could not be utilised by load and also could not be used to charge the storage systems because they are at the fully charged state. Excess energy index can be determined using (Eteiba et al. Citation2018):
where TT is the specific time period, P(t) is load demand, WE(t) is the wasted energy, Psurp is the hourly surplus power, hr is the time in hour, PPV is the hourly PV output power, Ebatt is the battery energy and Ebmax is the maximum energy that can be taken from the battery.
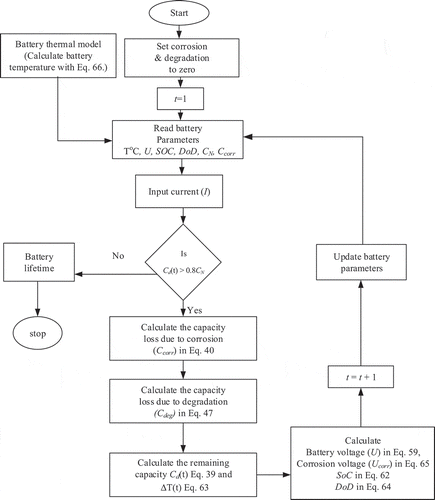
The flowchart describing the process for sizing PV, battery and flywheel to meet the load demand of the PV-powered combined fishery and poultry farm in such a manner that TCO, LPSP and will be minimum using Iteration Sizing Approach is depicted in .
Figure 6. Sizing optimisation flowchart.
5. Battery ageing model
Batteries are often replaced when used to supply high inrush currents such as currents drawn from water pumping machines. This is because a high instantaneous current leads to an increase in corrosion and degradation within the battery thereby affecting the ageing of battery negatively (T. Ayodele, Ogunjuyigbe, and Olateju Citation2018). These corrosion and degradation form the ageing mechanisms that are used in the Shepherd equation to determine the remaining capacity (Cd(t)) of a battery, corrosion voltage (Ucorr) and the battery voltage (U) (Bindner et al. Citation2005).
The capacity reduction in a lead acid battery is due to corrosion of positive grid and degradation of active mass. The battery gets to the end of its life when the remaining battery capacity Cd(t) is 80% of its nominal capacity and can be determined using (39) (Schiffer et al. Citation2007):
where is the initial battery capacity,
is the capacity loss due to corrosion and
is the capacity loss due to degradation.
5.1. Capacity loss due to corrosion
Corrosion leads into the end of battery life in two ways. (i) it causes the conversion of the lead (Pb) grid of the positive electrode into lead-oxides (PbO2) that is built on the grid as a barrier (ii) it increases the resistance across the corrosion layer thereby lowering the conductivity of the grid due to the reduction in its diameter. This results in the corrosion layer peeling off thereby breaking the contact between the grid and the positive active material leading to mechanical stress on the battery (Schiffer et al. Citation2007). Corrosion leading to capacity loss of a battery is therefore calculated in two folds: corrosion due to the conversion of positive active material, i.e. Pb to PbO2 () and corrosion causing increase in internal resistance layer of a battery (
) and can be determined using (40) (Dufo-López, Lujano-Rojas, and Bernal-Agustín Citation2014) and (41) (Schiffer et al. Citation2007), respectively
where: is the corrosion limit when the battery has reached its end of life and
is the corrosion layer resistance limit when the battery has reached its end of life and are based on assumption that the increase in internal resistance from corrosion at the end of the battery life causes 20% decrease in battery capacity, and loss of active material from corrosion causes a decrease in the remaining 80% capacity (Schiffer et al. Citation2007).
is the corrosion layer thickness.
is the corrosion layer thickness when the battery has reached its end of life.
Corrosion layer is based on the work of Lander (Lander Citation1951, Citation1956) and is used to assess the rate of growth of corrosion known as corrosion speed (). Corrosion layer thickness (
) can be determined for different corrosion voltages as follows (Schiffer et al. Citation2007):
where is the corrosion speed/voltage curve based on the work of Lander (Lander Citation1951, Citation1956), kst is temperature factor. L is the float lifetime,
is corrosion speed parameter when the battery has reached its end of life.
is the duration of one-time step, T is the battery temperature, TN is the nominal temperature.
5.2. Capacity loss due to degradation of active mass
Degradation is a capacity loss due to changes in active mass and composition caused by shedding (mechanical loosening caused by gassing and change in structure of the active mass), sulphation (lead sulphate (PbSO4) crystals that could not be converted back to the respective active material) and softening (loss of electronic conductivity caused by the break up of particles of the active mass) (Schiffer et al. Citation2007). The capacity loss by degradation () can be calculated as follows (Dufo-López, Lujano-Rojas, and Bernal-Agustín Citation2014):
Where is the degradation limit reached when the remaining battery capacity is 80% of the nominal capacity depending on cycling and not corrosion, ZW is the number of weighted cycles. CZ is the coefficient of the exponential function,
is the number of IEC cycles of a battery during its lifetime, this is when the battery capacity is 80% of its nominal capacity, and its value can be obtained in the battery datasheet,
is a weight that depends on the impact of the state of charge (SOC), discharge current, and acid stratification. This value without corrosion can be calculated as (Dufo-López, Lujano-Rojas, and Bernal-Agustín Citation2014):
where gives the impact of the acid stratification, while
accounts for the influence of the state of charge (SOC) and current,
is the discharge Ah of the battery,
is the nominal capacity of the battery, and
is the duration of one time step.
Acid stratification is an electrolyte concentration gradient that increases during repeated cycles of charging and discharging a battery. The acid stratification is modelled with two variables, the impact of acid stratification () and stratification factor (
). The stratification factor is also modelled with two sub-variables (
) and (
) to describe the build-up and breakdown of the acid stratification (Dufo-López, Lujano-Rojas, and Bernal-Agustín Citation2014). Therefore, the impact of acid stratification can be evaluated as follows (Schiffer et al. Citation2007):
where: is the factor for the decrease of acid stratification with gassing,
is the normalised gassing current for a 100 Ah nominal battery capacity at nominal voltage and nominal temperature, UN is the nominal voltage. TN is the nominal temperature. CU is the voltage coefficient. CT is the temperature coefficient. Ucell is the cell voltage. T is the battery temperature, D is the diffusion constant for sulphuric acid, Z is the height of the battery,
is the factor for the increase of acid stratification with gassing,
is the normalised reference current for current factor.
The state of charge factor () has the value ‘1’ when the battery is fully charged and increases with elapsed time until next fully charged (Schiffer et al. Citation2007) and can be determined using:
where: is the constant slope for SoC factor,
is the impact of the minimum SoC on the SoC factor,
is the lowest SoC since the last full charge, t0 is the time of the last full charge,
is the Impact of sulphate-crystal structure and can be calculated using:
where is the impact of the current factor,
is the normalised reference current for current factor, n represents a bad charge which can be defined as the state of charge that never reached 99% during charging and can be determined using; The number of bad charges is reset to zero when the state of charge reaches 0.99 (Dufo-López, Lujano-Rojas, and Bernal-Agustín Citation2014).
5.3. Battery voltage
The battery voltage equation () was modelled from Shepherd equation. The equation consists of four terms as given in (59). The first term of the equation represents the open-circuit voltage, the second term is associated with the state of charge, the third term evaluates the ohmic losses while the fourth term models the charge factor over-voltage and is significant when the battery is very close to being empty or full (Andersson Citation2006).
where U0 is the open-circuit voltage at full load, is the electrolyte proportionality constant, CN is the nominal battery capacity. I is the current and
denotes charging while
represents discharging.
is charge transfer overvoltage coefficient for charging operation,
is charge transfer overvoltage coefficient for discharging operation,
is the normalised capacity for a charge,
is the remaining battery capacity as determined in (39),
is the internal resistance for charge state and
is the internal resistance for discharge state. Both internal resistances can be determined as follows (Schiffer et al. Citation2007):
where is the initial internal resistance for charging,
is the initial internal resistance for discharging and
is the internal resistance layer of a battery due to corrosion as determined in (41)
is the state of charge of the battery, it denotes the state of charge of the battery when it is being charged from 0% to 100%. It can be modelled as follows (Schiffer et al. Citation2007):
The depth of discharge of a battery (DoD) is the state of charge of a battery when it is being discharged from 100% to 0. It can be determined as;
where is the initial SoC of the battery,
is the normalised gassing current for a 100 Ah nominal battery capacity at nominal voltage and nominal temperature, UN is the nominal voltage. TN is the nominal temperature. CU is the voltage coefficient. CT is the temperature coefficient. Ucell is the cell voltage. T is the battery temperature.
5.4. Corrosion voltage
Corrosion voltage equation is also a modified version of Shepherd equation and it is used to investigate how the corrosion layer increases at the positive grid. Corrosion voltage can be expressed as:
where is the corrosion voltage of a fully charged battery without current flow.
The flowchart for determining the ageing of a lead acid battery and is depicted in while the battery parameter adopted in this paper and the characteristics of the modelled battery are furnished in 1 (in the appendix) and . Furthermore, the lead-acid battery ageing coefficient used in EquationEquation (59)(59)
(59) is given in .
Table 7. Coefficient parameters of battery ageing EquationEquation (53)(53)
(53) .
Table 8. OGi C5 54Ah (25°C @ 2.23V/Cell) Data characteristics.
5.5. Battery thermal model
The main purpose of the thermal model is to establish the internal and external heat losses in the lead acid battery (Layadi et al. Citation2015). This heat is influenced by the surrounding temperature and affects the battery during operation. The thermal losses are caused by the gassing effect during overcharging and ohmic in the battery. depicts the electrical thermal model of the battery while the parameters of the battery thermal model are listed in . (Layadi et al. Citation2015)
Table 9. Parameter of the lead acid battery thermal model.
EquationEquation (67)(67)
(67) is the same for charge and discharge with different parameters for the equation (Copetti and Chenlo Citation1994).
where ToC is the battery temperature, Ta is the ambient (air) temperature, ∆T is the temperature variations related to internal thermal losses, Zth is the thermal impedance, Pth is the internal thermal losses, Cth is the thermal capacity, Rth is the thermal resistance, Rint is the overall battery internal resistance, I* is the charge-discharge current, Q is the battery quantity of charges, CT is the battery capacity and k1 to k5 and αT charge-discharge battery internal model parameter. The hourly ambient temperature of the site used in the paper was retrieved from Nigerian Meteorological Agency (NIMET) in Lagos state, Nigeria and has been illustrated in .
Figure 7. Battery thermal model.
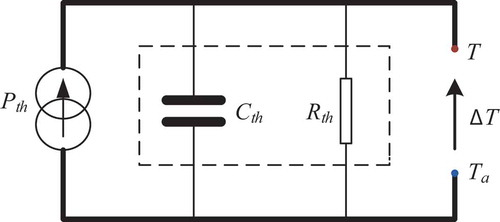
Figure 8. A year hourly ambient temperature of Abeokuta, Ogun state, Nigeria.
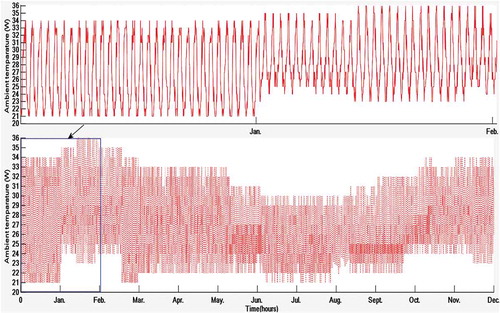
Figure 9. Battery Ageing Flow Diagram.
6. Results and discussion
This section presents the simulation results with the detailed discussion. The simulation was carried out in a Matlab environment.
6.1. Optimal sizing of PV, battery and flywheel to meet the load requirement of the farm
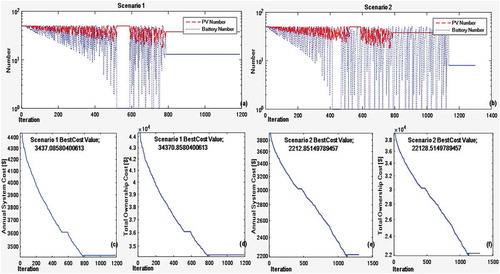
In order to understand the effect of high inrush current on the ageing of battery, two scenarios were created and compared: a PV/battery hybrid system and a PV/Battery/Flywheel hybrid system. The two hybrid systems were used to power a combined fishery and poultry farm where water pumping is a necessity. Water pumping machine draws starting current that is 6 times the steady current when switched ON. In the first scenario, the starting current needed by the pumping machine as well as steady current required by the other loads in the farm were drawn from the battery. On the other hand (i.e. second scenario), the flywheel was made to supply the starting current while only the nominal current required by the other loads at the farm was drawn from the battery. First, an iterative sizing algorithm as explained in section 4 was used to determine the required optimal sizes of the PV, battery and the flywheel that will power the farm. The optimum sizes were determined based on the combination of sizes that gives minimum TCO, LPSP and minimum excess energy. (a,b) presents the graph showing the optimised iteration of the number of battery and PV needed for both scenarios 1 and 2. ,d) show the plot displaying the best cost at the convergence point for annual system cost and total ownership cost, respectively, for scenario 1 while ,f) depicts that of scenario 2, respectively. The TCO for Scenario1 and 2 converged at $34,370.86 and $22,128.54, respectively. These results of the optimal sizes for the two scenarios are depicted in .
Table 10. Optimal size of the two scenarios to meet the fishery and poultry farm load demand.
From the table, scenario 1 (PV/Battery only) requires 13 numbers of battery and 38 numbers of PV modules to meet the load demand of the farm at 90% depth of discharge, and 2 days autonomous day. This scenario presented 1.71% LPSP and excess energy of 8.79% with the annual system cost of $3,437.086 and TCO of $34,370.86. On the other hand, scenario 2 (PV/battery/Flywheel) requires 1 number of a flywheel, 8 numbers of battery and 25 numbers of PV panel. The scenario presented 1.82% of LPSP, 6.65% excess energy with the annual system cost of $2,212.854 and TCO of $22,128.54. A comparison of the two scenarios reveals that scenario 1 has a higher initial cost and TCO compared to scenario 2. The reason is that the battery in scenario 1 was sized to cater for both the high inrush current during pumping machine starting and the nominal current required by the loads while the battery in scenario 2 was sized to cater for the nominal current required by the loads only as the high inrush current is drawn from the flywheel. The PV/Battery/Flywheel presents a better option in terms of TCO and annual system cost.
Figure 10. Number of batteries and solar panels iteration (a) Scenarios 1 Scenarios 2; ASC and TCO best cost convergence point for (b) Scenarios 1 (c) Scenarios 2.
6.2. Impact of high inrush current on ageing of the battery
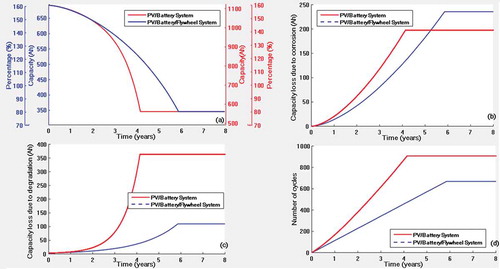
The batteries at a start have approximately 1.6 times their nominal battery capacities (Garche et al. Citation2013) and they get to the end of their life when the remaining battery capacity reaches 80% of the nominal capacity. The lifetime of batteries is mainly affected by the corrosion and degradation within the batteries. The remaining capacity of the batteries for the two scenarios when used to meet the load requirement of the farm was simulated and the results are depicted in alongside degradation capacity, corrosion capacity and number of cycles.
From ), it can be observed that the battery in each of the scenarios is approximately 1.6 times their nominal capacity. Scenario 1 has an initial capacity of 1,123.2Ah at 160% while scenario 2 has an initial capacity of 691.2 at 160%. Scenario 1 reached 80% of the remaining capacity (i.e. the end of life) after 4.139 years at the value of 561.6Ah while it took 5.86 years for the battery in scenario 2 to reach the 80% of its nominal capacity at the value of 345.6Ah. This indicates that when flywheel was adopted (i.e. scenario 2), the lifetime of the battery was further prolonged by an extra 1.72 years. This is expected as the batteries in scenario 2 were only supplying the nominal current required by the loads. The high inrush current due to the starting of pumping machine was supplied by the flywheel rather than the battery resulting into prolonging lifetime.
Corrosion is one of the ageing mechanisms that make a battery to reach the end of its life very quickly. Corrosion can be induced very easily in the battery when high inrush current is drawn from the battery. The capacity loss due to corrosion was simulated for both scenarios and the result is depicted in ). The figure shows that the capacity loss due to corrosion for scenario 1 (PV/Battery system) reached its limit after 4.139 years despite the high number of batteries in scenario 1 at the value of 197.8Ah. However, batteries in scenario 2 (PV/Battery/Flywheel) reached their corrosion limit of 235.7Ah after 5.86 years. The years at which the batteries in scenario 1 reached their corrosion limit are lower compared to scenario 2 because of the rapid increase in resistance of the battery as a result of the PbO2 that is formed on the grid which was induced by the high instantaneous starting current. This causes breaking of contact between the grid and the active material when parts of the corrosion layer fall off thereby making the batteries to quickly reach the end of their lifetime (i.e. 80% of the remaining capacity).
Degradation leads to capacity loss as a result of changes in active mass and composition caused by shedding, sulphation and softening. Capacity loss due to degradation was also simulated for the two scenarios and the result is shown in ). The figure indicates that batteries in scenario 1 reached their degradation limit earlier compared to the batteries in scenario 2 at the value of 363.8Ah after 4.139 years and 109.9Ah at 5.86 years, respectively. The PV/Battery system has fewer years to reach its degradation limit compared to the PV/Battery/Flywheel system. This is because most of the lead sulphate (PbSO4) crystals in the batteries of scenario 1 could not be reversed back to their respective active material (sulphation) after heavy battery drainage as a result of high starting current drawn from the battery by the pumping machine.
The weighted number of cycles is the number of fully charge/discharge that can be completed throughout the battery lifetime. The number of cycles within the lifetime of the batteries were determined for each of the scenarios and the result is displayed in ). The result in the figure reveals that scenario 1 completed 908 cycles at the end of 4.139 years while scenario 2 completed 669 weighted number of cycles at 5.86 years. Despite scenario 1 having a higher weighted number of cycles, the battery end of the life is lower compared to scenario 2. This is because the batteries in scenario 1 are subjected to a high inrush current which continuously over-drained the batteries.
Figure 11. (a) The remaining capacity of batteries for scenarios 1 and 2, (b) Capacity loss due to corrosion for scenarios 1 and 2, (c) Degradation of the systems for scenarios 1 and 2, (d) Number of battery weighted cycles for scenarios 1 and 2.
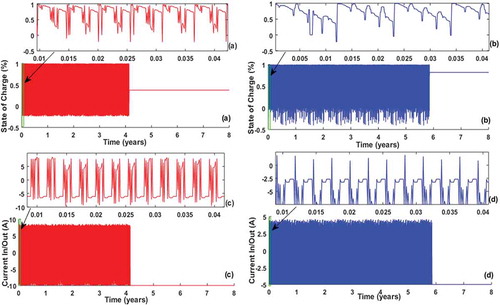
6.3. State of charge of the battery and battery charging and discharging currents
The state of charge of the battery is depicted in ,b) as case scenario 1 and scenario 2, respectively. From the figures, it could be observed that the state of charge for the standalone system (scenario 1) is mostly negative compared to the hybrid system (scenario 2) with fewer negative values. This is as a result of the depth of stress imposed on the battery in scenario 1 due to incessant high inrush current demanded at every motor starting. The batteries in scenario 2 prove to be better because inrush current is not demanded and this could better reduce the rate of battery deterioration.
Furthermore, charging (current in) and discharging (current out) for batteries in scenarios 1 and 2 are displayed in ). The negative current indicates battery discharging while the positive current represents the battery charging current. The battery discharge current ranges from 6A to 10A over a lifetime 4.139 years in scenario 1 while the battery discharge current in scenario 2 ranges between 2.5A and 7A over a lifetime of 5.86 years indicating the complementary advantage of Flywheel and battery in PV-powered applications.
Figure 12. State of Charge of battery for (a) PV/Battery standalone system (scenario 1) and (b) Hybrid PV/Battery/Flywheel system (scenario 2), charging and discharging current for batteries in (c) PV/Battery standalone system (scenario 1) and (d) Hybrid PV/Battery/Flywheel system (scenario 2).
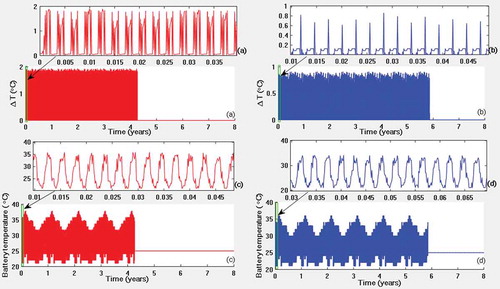
6.4. Battery operating temperature
) shows the battery operating temperature and temperature variation for scenario 1 while ) show the same for scenario 2. From the result, it is observed that the maximum output in scenario 1 is around 1.93°C higher than the ambient temperature while is around 0.9°C higher in scenario 2.
Figure 13. Temperature variations related to internal thermal losses: (a) PV/Battery standalone system (scenario 1) and (b) Hybrid PV/Battery/Flywheel system (scenario 2), operating temperature of the battery for (c) PV/Battery standalone system (scenario 1) and (d) Hybrid PV/Battery/Flywheel system (scenario 2).
7. Sensitivity analyses
Sensitivity analysis shows the dependency of a given system characteristic on some defined input variables. Sensitivity analysis was carried out on the resulting ageing of the batteries in one of the scenarios. It should be noted that sensitivity analysis could be carried out on any of the two scenarios with a similar resulting output. In this paper, four input variables, i.e. discharge current, corrosion limit, degradation limit and charge current are selected as sensitivity variables and varied over a predetermined range to understand how they impact on the ageing mechanism (i.e. remaining capacity of a lead acid battery, corrosion and degradation of the battery).
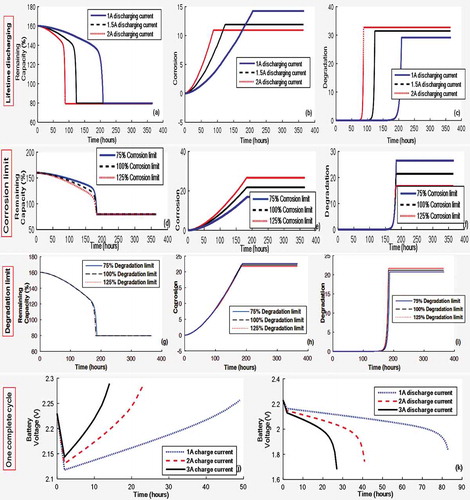
7.1. Discharge current, corrosion limit, degradation limit and a complete charge and discharge cycle
The batteries in each of the scenarios are subjected to a different discharging current of 1A, 1.5A and 2A and the resulting effect on the remaining capacity of the batteries, corrosion and degradation are simulated. The results are depicted in –c). It can be observed in the figure that the higher the discharging current the quicker the batteries reach the end of their lifetime (i.e. 80% of the remaining capacity). It can also be seen that the higher the discharging current, the quicker the batteries reach the end of their life due to corrosion and degradation. The results indicate that higher discharging current affects the ageing of battery negatively; hence, lower discharge current is desirable compared to higher discharge current.
Also, a sensitivity analysis was investigated at different percentage levels (75%, 100% and 125%) of corrosion limit and the effect on the remaining capacity, corrosion and degradation within the battery were observed and the effects are displayed in –f). The result reveals that the battery life ended at the same time of capacity, corrosion and degradation of 182.375 hours, although at different rates. Hence, change in corrosion limit makes no difference on the battery lifetime.
In another simulation, a sensitivity analysis was performed at different percentage levels (75%, 100% and 125%) of degradation limit and the results are presented in –i). It was realised that the battery lifetime ended at almost the same time and rate. It can, therefore, be said that there is little effect on the battery if degradation limit is varied.
In addition, one complete cycle of charging and discharging battery with different current was investigated and the results are presented in ,k). As expected, the higher the discharge current the faster the battery discharges. Similarly, the higher the charging current, the faster the battery gets to the full. That is, with 1A discharging current, the battery is completely discharged after 83 hours and at 3A discharge current, the battery completely discharged after 27 hours. Also, at 1A charge current, the battery is completely charged after 49 hours and at 3A charge current, the battery is completely charged after 14 hours. This is because the capacity loss due to corrosion and degradation increases with higher discharging current. However, most of the lead sulphate (PbSO4) crystals would be reversed to their respective active material when charged with higher current as depicted in the figure.
Figure 14. Lifetime different discharge current for: (a) Capacity (b) Corrosion (c) Degradation, Change in corrosion limit for: (d) Capacity (e) Corrosion (f) Degradation, Change in degradation limit for: (g) Capacity (h) Corrosion (i) Degradation, One complete cycle with: (j) Different charge current (k) Different discharge current.
8. Conclusion
The complementary role of hybridising battery and flywheel on battery ageing for a PV-powered application has been studied. The PV, battery and flywheel were optimally matched with the load requirement of a combined fishery and poultry farm using iterative algorithm approach based on minimum TCO, LPSP and excess energy. The farm requires incessant water pumping due to the nature of activities on the farm. The ageing of the battery was modelled using Schiffer weighted Ah-throughput model. Two scenarios were created to appreciate the complementary characteristic of the two storage systems when hybridised. From the result, it can be concluded that hybrid of Battery/Flywheel presented a lower capital and lifecycle cost compared to battery only when used in a PV powered-combined fishery and poultry farm. The lifetime of a lead acid battery when combined with flywheel can be prolonged. In the specific case study presented in this paper, the lifetime of a lead acid battery was extended by an additional 2 years when operated as a hybridised system with a flywheel. From the cost perspective, the PV/Battery/Flywheel system proved to be more economical with TCO of $22,128.54 at 1.82% LPSP and annual capital cost of $ 2,212.854 while improving battery life by 1.72% compared to the PV/Battery system with minimum TCO of $34,370.86 at 1.71% LPSP and annual capital cost of $3,437.086. There is a total savings of $16,164.56 when battery is hybridised with flywheel. The sensitivity analysis revealed that higher discharging current could negatively affect the ageing of battery while variations in corrosion and degradation limits have an insignificant effect on ageing of batteries. Only simulation was performed in this paper, experimental work would be required to validate the conclusion. Hence, future research would look into the experimental validation of the impact of hybridisation on the ageing of battery.
Nomenclature
| A | = | Total electrical loading in A/m |
| APV | = | Surface area of the PV module |
| ATcf | = | Temperature correction factor |
| AWPPM | = | Automatic Water Pressure Pumping Machine |
| BS | = | Battery in Series |
| Bg | = | Flux density in air-gap in Tesla |
| CAO&M | = | Annual Operation and Maintenance Cost in $ |
| CArep | = | Overall components replacement cost in $ |
| CArep(Batt) | = | Annual battery replacement cost in $ |
| CArep(PCS) | = | Annual power conv. replacement cost in $ |
| CATC | = | Total Capital Cost in $ |
| CBatt | = | Cost of battery in $ |
| CBOP | = | Project installation & miscellaneous cost in $ |
| Ccorr (t) | = | Capacity loss due to corrosion in Ah |
| Ccorr,l | = | Corrosion limit in Ah |
| Cd,0 | = | Initial battery capacity in Ah |
| Cdeg (t) | = | Capacity loss due to degradation in Ah |
| Cdeg,l | = | Degradation limit in Ah |
| cf | = | Friction coefficient |
| CFW | = | Cost of flywheel in $ |
| CFR | = | Capital Recovery Factor |
| CO&M | = | Operation and Maintenance cost in $ |
| CPCS | = | Power Conversion System cost in $ |
| CPV | = | PV panel cost in $ |
| Crep(Batt) | = | Battery replacement cost in $ |
| Crep(PCS) | = | Future power conversion systems cost in $ |
| CPWh | = | Maximum energy a battery can supply in Wh |
| CWh | = | Energy needed from the battery in Wh |
| CSC | = | System component capital cost in $ |
| Csys | = | Annual System Cost in $ |
| CT | = | Battery capacity in Ah |
| Cth | = | Thermal capacity in joule |
| CTC | = | Capital cost in $ |
| Da | = | Battery autonomy in days |
| Di | = | Machine’s inner surface diameter in m |
| Do | = | Machine’s outer surface diameter in m |
| DoD (t) | = | Depth of Discharge in per unit |
| Ebatt | = | Battery energy in Wh |
| Ebmax | = | Maximum battery energy in Wh |
| Ebmin | = | Minimum battery energy in Wh |
| Eoe | = | Flywheel energy that can be delivered in Wh |
| Ese | = | Flywheel stored energy in Wh |
| Esys | = | System energy in Wh |
| EXC (t) | = | Excess energy in % |
| f | = | Converter frequency in Hz |
| g | = | Gradient of change in OCV with SOC in V |
| GAV (t) | = | Solar irradiance in kW/m2 |
| h | = | Flywheel rotor height in mm |
| hr | = | Load demand time in hour |
| I* | = | Charge-discharge current in Ampere |
| I (t) > 0 | = | Charging current in Ampere |
| I (t) ≤ 0 | = | Discharging current in Ampere |
| Igas | = | Gassing current in Ampere |
| ISA | = | Iteration Sizing Approach |
| Isd | = | Pumping machine steady current in Ampere |
| Ist | = | Pumping machine starting current in Ampere |
| J | = | Moment of inertia in N |
| αT | = | Charge-discharge battery internal model parameter |
| k1 | = | Charge-discharge battery internal model parameter |
| k5 | = | Charge-discharge battery internal model parameter |
| Ke | = | EMF factor |
| Ki | = | Current-waveform factor |
| KL | = | Aspect ratio coefficient |
| Kϕ | = | Electrical loading ratio on rotor & stator |
| Ks,limit | = | Corrosion speed parameter |
| LCC | = | Project Life Cycle Cost in $ |
| Le | = | Machine’s effective axial length in m |
| LPS (t) | = | Loss of Power Supply in Wh |
| LPSP (t) | = | Loss of Power Supply Probability in % |
| m | = | Flywheel rotor mass in kg |
| m* | = | Number of phases of each stator |
Correction Statement
This article has been republished with minor changes. These changes do not impact the academic content of the article.
Disclosure statement
No potential conflict of interest was reported by the authors.
Additional information
Notes on contributors
T. R. Ayodele
T. R. Ayodele holds Bachelor of Engineering (B.Eng) in Electrical & Electronic Engineering from the Federal University of Technology (FUTA) and a Master of Engineering (M.Eng) in Electrical Power and Machine Engineering from the University of Benin, Nigeria. He obtained his doctoral degree (Doctor Technologiae) from Tshwane University of Technology, Pretoria, South Africa. Dr. Ayodele is an active member of the Power, Energy, Machine and Drive (PEMD) Research group at the Department of Electrical & Electronic Engineering of University of Ibadan. His research interests are in Renewable energy resource assessments, grid integration of renewable energy, economic analysis of energy sources, Power system stability and power quality assessments.
A. S. O. Ogunjuyigbe
A. S. O. Ogunjuyigbe is with the Department of Electrical & Electronic Engineering, University of Ibadan. Prof Ogunjuyigbe has 24 years of professional experience encompassing University teaching, research, inclusive of 2 years in consulting. He was a Lecturer at the Faculty of Engineering, Ladoke Akintola University of Technology, (2006-2009), a consulting Engineer with SGI Consulting for the reinforcement of Nigerians Utility power Transmission Network. Prof. Ogunjuyigbe is presently team leading the Power, Energy, Machine and Drive (PEMD) Research group at the Department of Electrical & Electronic Engineering of University of Ibadan. The group is focused on researches in the core area of Power analysis, Energy conversion and its efficient Utilisation.
N. O. Oyelowo
N. O. Oyelowo holds B. Sc in Electrical & Electronic Engineering from Olabisi Onabanjo University, Ago Iwoye, Ogun State, Nigeria. He obtained his Master of Science (MSc). Electrical Engineering (Power Option) from the University of Ibadan. His research interests are in the area of Renewable Energy, Integrated Hybrid Energy System and Power System Stability.
References
- Abrahamsson, J., J. G. De Oliveira, J. De Santiago, J. Lundin, and H. Bernhoff. 2012. “On the Efficiency of a Two-power-level Flywheel-based All-electric Driveline.” Energies 5 (8): 2794–2817. doi:10.3390/en5082794.
- Aitchison, D., M. Cirrincione, G. Cirrincione, A. Mohammadi, and M. Pucci. 2017. Feasibility Study and Design of a Flywheel Energy System in a Microgrid for Small Village in Pacific Island State Countries Smart Energy Grid Design for Island Countries, 159–187. Switzerland: Springer.
- Aktas, A., K. Erhan, S. Ozdemir, and E. Ozdemir. 2017. “Experimental Investigation of a New Smart Energy Management Algorithm for a Hybrid Energy Storage System in Smart Grid Applications.” Electric Power Systems Research 144: 185–196. doi:10.1016/j.epsr.2016.11.022.
- Al Riza, D., S. Gilani, and M. Aris. 2015. “Standalone Photovoltaic Systems Sizing Optimization Using Design Space Approach: Case Study for Residential Lighting Load.” Journal of Engineering Science and Technology 10 (7): 943–957.
- Amiryar, M., and K. Pullen. 2017. “A Review of Flywheel Energy Storage System Technologies and Their Applications.” Applied Sciences 7 (3): 286. doi:10.3390/app7030286.
- Amrouche, S. O., D. Rekioua, T. Rekioua, and S. Bacha. 2016. “Overview of Energy Storage in Renewable Energy Systems.” International Journal of Hydrogen Energy 41 (45): 20914–20927. doi:10.1016/j.ijhydene.2016.06.243.
- Andersson, A. 2006. “Battery Lifetime Modelling.” Riso National Laboratory 3: 4.
- Aydin, K., and M. T. Aydemir. 2016. “Sizing Design and Implementation of a Flywheel Energy Storage System for Space Applications.” Turkish Journal of Electrical Engineering & Computer Sciences 24 (3): 793–806. doi:10.3906/elk-1306-206.
- Aydin, M., S. Huang, and T. A. Lipo. 2001. “Design and 3D Electromagnetic Field Analysis of Non-slotted and Slotted TORUS Type Axial Flux Surface Mounted Permanent Magnet Disc Machines.” Paper presented at the IEMDC 2001. IEEE International Electric Machines and Drives Conference (Cat. No. 01EX485), Cambridge, MA, USA.
- Ayodele, T., A. Ogunjuyigbe, and B. Olateju. 2018. “Improving Battery Lifetime and Reducing Life Cycle Cost of a PV/battery System Using Supercapacitor for Remote Agricultural Farm Power Application.” Journal of Renewable and Sustainable Energy 10 (1): 013503. doi:10.1063/1.4999780.
- Ayodele, T. R., and A. S. O. Ogunjuyigbe. 2015a. “Increasing Household Solar Energy Penetration through Load Partitioning Based on Quality of Life: The Case Study of Nigeria.” Sustainable Cities and Society 18: 21–31. doi:10.1016/j.scs.2015.05.005.
- Ayodele, T. R., and A. S. O. Ogunjuyigbe. 2015b. “Mitigation of Wind Power Intermittency: Storage Technology Approach.” Renewable and Sustainable Energy Reviews 44: 447–456. doi:10.1016/j.rser.2014.12.034.
- Ayop, R., N. M. Isa, and C. W. Tan. 2017. “Components Sizing of Photovoltaic Stand-alone System Based on Loss of Power Supply Probability.” Renewable and Sustainable Energy Reviews 81: 2731–2743.
- Aziz, N. I. A., S. I. Sulaiman, S. Shaari, I. Musirin, and K. Sopian. 2017. “Optimal Sizing of Stand-alone Photovoltaic System by Minimizing the Loss of Power Supply Probability.” Solar Energy 150: 220–228. doi:10.1016/j.solener.2017.04.021.
- Barelli, L., G. Bidini, F. Bonucci, L. Castellini, S. Castellini, A. Ottaviano, … A. Zuccari. 2018. “Dynamic Analysis of a Hybrid Energy Storage System (H-ESS) Coupled to a Photovoltaic (PV) Plant.” energies 11 (2): 396. doi:10.3390/en11020396.
- Barelli, L., G. Bidini, F. Bonucci, L. Castellini, A. Fratini, F. Gallorini, and A. Zuccari. 2019. “Flywheel Hybridization to Improve Battery Life in Energy Storage Systems Coupled to RES Plants.” Energy 173: 937–950. doi:10.1016/j.energy.2019.02.143.
- Beaudin, M., H. Zareipour, A. Schellenberglabe, and W. Rosehart. 2010. “Energy Storage for Mitigating the Variability of Renewable Electricity Sources: An Updated Review.” Energy for Sustainable Development 14: 302–314. doi:10.1016/j.esd.2010.09.007.
- Bindner, H., T. Cronin, P. Lundsager, J. F. Manwell, U. Abdulwahid, and I. Baring-Gould. 2005. Lifetime Modelling of Lead Acid Batteries. USA: Risø National Laboratory.
- Bocklisch, T. 2015. “Hybrid Energy Storage Systems for Renewable Energy Applications.” Energy Procedia 73: 103–111. doi:10.1016/j.egypro.2015.07.582.
- Bolund, B., H. Bernhoff, and M. Leijon. 2007. “Flywheel Energy and Power Storage Systems.” Renewable and Sustainable Energy Reviews 11 (2): 235–258. doi:10.1016/j.rser.2005.01.004.
- Bouchhima, N., M. Gossen, S. Schulte, and K. P. Birke. 2018. “Lifetime of Self-reconfigurable Batteries Compared with Conventional Batteries.” Journal of Energy Storage 15: 400–407. doi:10.1016/j.est.2017.11.014.
- Chen, H., Y. Cong, W. Yang, C. Tan, Y. Li, and Y. Ding. 2009. “Progress in Electrical Energy Storage System: A Review of Energy Storage Technology.” Progress in Natural Science 19 (3): 291–312. doi:10.1016/j.pnsc.2008.07.014.
- Copetti, J., and F. Chenlo. 1994. “Lead/acid Batteries for Photovoltaic Applications.” Test Results and Modeling. Journal of Power Sources 47 (1–2): 109–118. doi:10.1016/0378-7753(94)80054-5.
- Dambone Sessa, S., A. Tortella, M. Andriollo, and R. Benato. 2018. “Li-Ion Battery-Flywheel Hybrid Storage System: Countering Battery Aging during a Grid Frequency Regulation Service.” Applied Sciences 8 (11): 2330. doi:10.3390/app8112330.
- Dufo-López, R., J. M. Lujano-Rojas, and J. L. Bernal-Agustín. 2014. “Comparison of Different Lead–Acid Battery Lifetime Prediction Models for Use in Simulation of Stand-alone Photovoltaic Systems.” Applied Energy 115: 242–253. doi:10.1016/j.apenergy.2013.11.021.
- Eriksson, D., L. Eriksson, E. Frisk, and M. Krysander. 2013. “Flywheel Angular Velocity Model for Misfire and Driveline Disturbance Simulation.” IFAC Proceedings Volumes 46 (21): 570–575. doi:10.3182/20130904-4-JP-2042.00020.
- Eteiba, M., S. Barakat, M. Samy, and W. I. Wahba. 2018. “Optimization of an Off-Grid PV/Biomass Hybrid System with Different Battery Technologies.” Sustainable Cities and Society 40: 713–727.
- Faraji, F., A. Majazi, and K. Al-Haddad. 2017. “A Comprehensive Review of Flywheel Energy Storage System Technology.” Renewable and Sustainable Energy Reviews 67: 477–490. doi:10.1016/j.rser.2016.09.060.
- Garche, J., C. K. Dyer, P. T. Moseley, Z. Ogumi, D. A. Rand, and B. Scrosati. 2013. “Encyclopedia of Electrochemical Power Sources”. Newnes.
- Hall, P. J., and E. J. Bain. 2008. “Energy-storage Technologies and Electricity Generation.” Energy Policy 36 (12): 4352–4355. doi:10.1016/j.enpol.2008.09.037.
- Hesse, H., M. Schimpe, D. Kucevic, and A. Jossen. 2017. “Lithium-ion Battery Storage for the Grid—A Review of Stationary Battery Storage System Design Tailored for Applications in Modern Power Grids.” energies 10 (12): 2107. doi:10.3390/en10122107.
- Khatib, T., I. A. Ibrahim, and A. Mohamed. 2016. “A Review on Sizing Methodologies of Photovoltaic Array and Storage Battery in A Standalone Photovoltaic System.” Energy Conversion and Management 120: 430–448. doi:10.1016/j.enconman.2016.05.011.
- Kim, U. S., C. B. Shin, S. M. Chung, S. T. Kim, and B. W. Cho. 2009. “Modeling of the Capacity Loss of a 12 V Automotive Lead-acid Battery Due to Ageing and Comparison with Measurement Data.” Journal of Power Sources 190 (1): 184–188. doi:10.1016/j.jpowsour.2008.12.091.
- Kohari, Z., and I. Vajda. 2005. “Losses of Flywheel Energy Storages and Joint Operation with Solar Cells.” Journal of Materials Processing Technology 161 (1–2): 62–65. doi:10.1016/j.jmatprotec.2004.07.057.
- Kouchachvili, L., W. Yaïci, and E. Entchev. 2018. “Hybrid Battery/supercapacitor Energy Storage System for the Electric Vehicles.” Journal of Power Sources 374: 237–248. doi:10.1016/j.jpowsour.2017.11.040.
- Lander, J. 1951. “Anodic Corrosion of Lead in H 2 SO 4 Solutions.” Journal of the Electrochemical Society 98 (6): 213–219. doi:10.1149/1.2778134.
- Lander, J. 1956. “Further Studies on the Anodic Corrosion of Lead in H 2 SO 4 Solutions.” Journal of the Electrochemical Society 103 (1): 1–8. doi:10.1149/1.2430227.
- Layadi, T. M., G. Champenois, M. Mostefai, and D. Abbes. 2015. “Lifetime Estimation Tool of Lead–Acid Batteries for Hybrid Power Sources Design.” Simulation Modelling Practice and Theory 54: 36–48. doi:10.1016/j.simpat.2015.03.001.
- Lazarewicz, M., and J. A. Arseneaux. 2006. “Status of Pilot Projects Using Flywheels for Frequency Regulation”. Paper presented at the IEEE Power Engineering Society General Meeting, Montreal, Que.
- Li, J., R. Xiong, H. Mu, B. Cornélusse, P. Vanderbemden, D. Ernst, and W. Yuan. 2018. “Design and Real-time Test of a Hybrid Energy Storage System in the Microgrid with the Benefit of Improving the Battery Lifetime.” Applied Energy 218: 470–478. doi:10.1016/j.apenergy.2018.01.096.
- Long, Z., and Q. Zhiping. 2008. “Review of Flywheel Energy Storage System.” Paper presented at the Proceedings of ISES World Congress 2007, Vol. I–V.
- Mahlia, T., T. Saktisahdan, A. Jannifar, M. Hasan, and H. Matseelar. 2014. “A Review of Available Methods and Development on Energy Storage; Technology Update.” Renewable and Sustainable Energy Reviews 33: 532–545. doi:10.1016/j.rser.2014.01.068.
- Mahmoudi, A., S. Kahourzade, N. A. Rahim, and W. P. Hew. 2012. “Design, Analysis, and Prototyping of an Axial-flux Permanent Magnet Motor Based on Genetic Algorithm and Finite-element Analysis.” IEEE Transactions on Magnetics 49 (4): 1479–1492. doi:10.1109/TMAG.2012.2228213.
- Mahmoudi, A., S. Kahourzade, N. A. Rahim, H. W. Ping, and M. N. Uddin. 2013. “Design and Prototyping of an Optimised Axial-flux Permanent-magnet Synchronous Machine.” IET Electric Power Applications 7 (5): 338–349. doi:10.1049/iet-epa.2012.0377.
- Mahmoudi, A., N. A. Rahim, and H. W. Ping. 2012. “Axial-flux Permanent-magnet Motor Design for Electric Vehicle Direct Drive Using Sizing Equation and Finite Element Analysis.” Progress In Electromagnetics Research 122: 467–496. doi:10.2528/PIER11090402.
- May, G. J., A. Davidson, and B. Monahov. 2018. “Lead Batteries for Utility Energy Storage: A Review.” Journal of Energy Storage 15: 145–157. doi:10.1016/j.est.2017.11.008.
- Ogunjuyigbe, A. S. O., T. R. Ayodele, and K. O. Akpeji. 2018. “Optimum Selection of Photovoltaic Modules Using Probabilistic Approach Based on Capacity Factor Estimation.” International Journal of Ambient Energy 39 (1): 11–16. doi:10.1080/01430750.2016.1230559.
- Pham, C.-T., and D. Månsson. 2017. “On the Physical System Modelling of Energy Storages as Equivalent Circuits with Parameter Description for Variable Load Demand (Part I).” Journal of Energy Storage 13: 73–84. doi:10.1016/j.est.2017.05.015.
- Rawat, R., R. Lamba, and S. Kaushik. 2017. “Thermodynamic Study of Solar Photovoltaic Energy Conversion: An Overview.” Renewable and Sustainable Energy Reviews 71: 630–638. doi:10.1016/j.rser.2016.12.089.
- Reniers, J. M., G. Mulder, S. Ober-Blöbaum, and D. A. Howey. 2018. “Improving Optimal Control of Grid-connected Lithium-ion Batteries through More Accurate Battery and Degradation Modelling.” Journal of Power Sources 379: 91–102. doi:10.1016/j.jpowsour.2018.01.004.
- Rohit, A. K., K. P. Devi, and S. Rangnekar. 2017. “An Overview of Energy Storage and Its Importance in Indian Renewable Energy Sector: Part I–Technologies and Comparison.” Journal of Energy Storage 13: 10–23. doi:10.1016/j.est.2017.06.005.
- Rohit, A. K., and S. Rangnekar. 2017. “An Overview of Energy Storage and Its Importance in Indian Renewable Energy Sector: Part II–Energy Storage Applications, Benefits and Market Potential.” Journal of Energy Storage 13: 447–456. doi:10.1016/j.est.2017.07.012.
- Rupp, A., H. Baier, P. Mertiny, and M. Secanell. 2016. “Analysis of a Flywheel Energy Storage System for Light Rail Transit.” Energy 107: 625–638. doi:10.1016/j.energy.2016.04.051.
- Schiffer, J., D. U. Sauer, H. Bindner, T. Cronin, P. Lundsager, and R. Kaiser. 2007. “Model Prediction for Ranking Lead-acid Batteries according to Expected Lifetime in Renewable Energy Systems and Autonomous Power-supply Systems.” Journal of Power Sources 168 (1): 66–78. doi:10.1016/j.jpowsour.2006.11.092.
- Sebastián, R., and R. P. Alzola. 2012. “Flywheel Energy Storage Systems: Review and Simulation for an Isolated Wind Power System.” Renewable and Sustainable Energy Reviews 16 (9): 6803–6813. doi:10.1016/j.rser.2012.08.008.
- Sessa, S. D., G. Crugnola, M. Todeschini, S. Zin, and R. Benato. 2016. “Sodium Nickel Chloride Battery Steady-state Regime Model for Stationary Electrical Energy Storage.” Journal of Energy Storage 6: 105–115. doi:10.1016/j.est.2016.03.005.
- Sessa, S. D., F. Palone, A. Necci, and R. Benato. 2017. “Sodium-nickel Chloride Battery Experimental Transient Modelling for Energy Stationary Storage.” Journal of Energy Storage 9: 40–46. doi:10.1016/j.est.2016.11.008.
- Singh, K. V., H. O. Bansal, and D. Singh. 2019. “A Comprehensive Review on Hybrid Electric Vehicles: Architectures and Components.” Journal of Modern Transportation 27 (2): 77–107. doi:10.1007/s40534-019-0184-3.
- Tawadros, P., N. Zhang, and A. Boretti. 2014. “Integration and Performance of Regenerative Braking and Energy Recovery Technologies in Vehicles.” In Alternative Fuels and Advanced Vehicle Technologies for Improved Environmental Performance, edited by R. Folkson, 541–563. Cambridge, England: Woodhead Publishing.
- Veneri, O., C. Capasso, and S. Patalano. 2017. “Experimental Investigation into the Effectiveness of a Super-capacitor Based Hybrid Energy Storage System for Urban Commercial Vehicles.” Applied Energy227: 312–323
- Yang, B., Y. Markarov, J. Desteese, V. Viswanathan, P. Nyeng, B. McManus, and J. Pease. 2008. “On the Use of Energy Storage Technologies for Regulation Service in Electric Power Systems with Significant Penetration of Wind Energy”. Paper presented at the 5th International Conference on European Electricity Market (EEM 2008), Lisboa.
- Zhang, Y., X. Du, and M. Salman. 2017. “Battery State Estimation with a Self-evolving Electrochemical Ageing Model.” International Journal of Electrical Power & Energy Systems 85: 178–189. doi:10.1016/j.ijepes.2016.09.009.
Appendix
Table A1. Ageing parameters for OGi Lead-Acid battery.