
 ?Mathematical formulae have been encoded as MathML and are displayed in this HTML version using MathJax in order to improve their display. Uncheck the box to turn MathJax off. This feature requires Javascript. Click on a formula to zoom.
ABSTRACT
Solar photovoltaic (PV) power generation system is generally considered to be land-intensive in view of the diffuse nature of solar energy. However, a comprehensive assessment in this regard would involve bio-productive land for all types of resource consumption during the lifespan of the system. This study presents such an assessment for a grid-connected rooftop solar photovoltaic (RSPV) system located in a tropical climate. The life cycle ecological footprint (EFT) methodology has been used to derive the results based on material & energy consumption, water & manpower requirements along with waste disposal. This methodology is illustrated through an existing 1 MWp RSPV system installed at an educational institution in India. The total EFT is evaluated as 22.69 global hectare (gha) per year, out of which the environmental impact of solar PV panels is 76% of the total. The EFT per kWP capacity is 0.454 gha/kWP and the EFT per unit solar panel collector area is 0.074 gha/m2. The EFT of the RSPV system per unit electricity generation is 1.59 × 10⁻⁵ gha/kWh. However, considering only emissions from the grid-electricity in India, an approximate reduction potential of ecological footprint through RSPV-based electricity is estimated as 95%.
1. Introduction
India being a tropical country receives adequate solar radiation for nearly 300 days annually amounting to about 2300–3200 sunshine hours/year. Almost all the regions receive 4–7 kWh of solar radiation per square metre depending upon the location. The country’s solar installed capacity reached 28.18 GW as of 31 March 2019 (CEA, Citation2019). In the year 2015, the target was raised to 100 GW of solar capacity (including 40 GW from rooftop solar) by 2022, targeting an investment of US$ 100 billion (Ahmad, Samuel, and Amar Citation2016; MNRE, Citation2018).
The Life Cycle Ecological Footprint-based studies for power generating systems were not found in literature. However, several studies have been reported in the area of life cycle energy and carbon emissions from rooftop solar photovoltaic (RSPV) systems. Among the renewable energy systems, photovoltaics have minimal environmental impacts (i.e. 3.33% of coal-fired power generation) (Yu et al. Citation2017). The environmental impacts of the 52.7 kWp rooftop PV system were reported by Eskew et al. (Citation2018). The system produced climatic change impact of 0.079 kg CO2-eq/kWh and was estimated to avoid 1 × 10⁶ kgCO2-eq over its lifetime. Ludina et al. (Citation2018) reviewed and summarised impact assessment methods of life cycle assessment (LCA) namely, cumulative energy demand (CED), energy payback time (EPBT), and greenhouse gas (GHG) emission rate and found that multi-crystalline silicon PV technology has energy consumption of 1034–5150 MJ/m2, the EPBT of 0.8–4.17 years, and greenhouse gas emissions rate of 12.1–569.0 gCO2eq/kWh. Peng, Lun, and Yang (Citation2013) examined the EPBT and GHG emissions from mono-crystalline silicon (mono-Si), multi-crystalline silicon (multi-Si), amorphous silicon (a-Si), CdTe thin film and CIS thin film. They found that for mono-Si PV systems, the EPBT varied from 1.7 to 2.7 years and GHG emission rate was in the order of 29–45 gCO2eq/kWh. For multi-Si PV system, the EPBT and GHG emission rates were 1.5–2.6 years and 23–44 gCO2eq/kWh, respectively; and for thin-film PV systems (a-Si, CdTe and CIS), the EPBT and GHG emission rates were within the range of 0.75–3.5 years and 10.5–50 gCO2eq/kWh, respectively. Fthenakis and Alsema (Citation2006) studied the EPBT and GHG emissions for rooftop mono-Si and multi-Si PV modules and concluded that under the solar irradiation of 1700 kWh/m2/year, the EPBT for rooftop mono-Si and multi-Si were 2.7 and 1.7 years, respectively; and GHG emissions for mono-Si and multi-Si were 45 and 37 gCO2eq/kWh, respectively. Kato et al. (Citation2001) conducted life cycle assessment (LCA) on CdS/CdTe PV modules of residential rooftops to estimate and compare primary energy requirements, EPBT, and CO2 emissions with multi-Si and a-Si at different annual production rates. The study showed that the EPBT of CdS/CdTe PV modules were 1.7 year at 10 MW/year, and 1.1 year at 100 MW/year, which are lower than the EPBT of a-Si and multi-Si. The life cycle GHG emissions of CdS/CdTe PV modules ranged from 8.9 to 14.0 gCO2eq/kWh for annual production from 10 to 100 MW/year. Koo et al. (Citation2017) reported that the electricity generation of a-Si and CIGS base smart PV system blind for windows was about 81.3 kWh/m2 and 145.8 kWh/m2, respectively. Ordóñez et al. (Citation2010) reported that in Andalusia (Spain), the estimated PV solar energy capacity for residential buildings (if installed on all of them) was 9.73 GW/year. With the total roof surface area of 265.52 km2, this would satisfy 78.79% of energy needs of the city.
Pacca, Sivaraman, and Keoleian (Citation2007) compared poly-Si (13% efficiency) with a-Si (6.3% efficiency) module-based rooftop solar PV systems (33 kWh system capacity) that were installed in the University of Michigan. The EPBT of poly-Si and a-Si are 2.4 and 7.4 year, respectively. For the CO2 emissions, it comes in the range of 34.3 and 72.4 g of CO2/kWh, respectively. The life cycle assessment of multi-Si module-based solar PV systems with the irradiation of 1427 kW h/m2/yr installed in Japan showed that the EPBT and GHG emission rates were 2.4 years and 20 g CO2-eq./kWh, respectively (Kota et al. Citation1998). Stoppato (Citation2008) presented the EPBT and emissions results of an LCA of poly-Si module panels in 27 countries. The EPBT ranged from 3.368 years in Spain to 6.522 years in the United Kingdom, and CO2 emissions ranged from 0.002 kgCO2/kWh in Norway to 0.841 kgCO2/kWh in Australia.
Osma-Pinto and Ordóñez-Plata (Citation2019) studied the measuring factors influencing the performance of rooftop PV panels in warm tropical climates. They found that, on average, a green roof-top solar PV system can generate between 1.0 ± 0.4% and 1.3 ± 0.4% more energy per day than a PV system installed on a concrete roof at an average height of 50 cm above the roof surface. In addition, air velocities exceeding 1 m/s may enhance the daily average energy generation by 1 ± 0.4% and 3 ± 0.4%.
In India’s context, Prakash and Bansal (Citation1995) evaluated the energy consumption in mono-Si solar PV module production in India, and examined its implications for large-scale introduction of solar PV plants in the country. They evaluated the energy payback period as approximately 4 years, which was comparable to energy payback periods of similar modules produced internationally. Nawaz and Tiwari (Citation2006) examined a 1.2 kWp (capacity) PV system for mud house at IIT Delhi and reported that the EPBT is in the range of 7–26 years and the net CO2 saved is 0.24–0.77 kg/kWh, depending on solar panel’s efficiency and climatic condition of India.
summarises the results from previous studies based on rooftop solar PV system with poly-Si-based module. This summary indicates that for different solar irradiations, system capacities, and module efficiencies, the EPBT of the rooftop solar PV (poly-Si module) for most of the cases is in the range of 0.8–7.4 years. The GHG emissions produced during the life of the rooftop solar PV is in the range of 12–840 gCO2-eq/kW h.
Table 1. Literature review summary
Ecological Footprint: The Ecological Footprint (EF) concept was developed in the mid-nineties by Mathis Wackernagel and William Rees (Wackernagel and Rees Citation1996). It can be used to examine various measures such as the feasibility of resource use, distribution of the world’s natural resources, waste assimilation, and overall sustainability of a system. The indicator incorporates all inputs (resources) and converts them into a single parameter called ‘global hectare (gha)’. One global hectare (gha) is equivalent to 1 ha of bio-productive land with world average productivity (Bastianoni et al. Citation2006). The expression for evaluating EF is as follows:
Ecological Footprint (EF) = ∑ ().ei,
where Ci is annual consumption of ith product (ton/year), Yi is yield factor (annual productivity) of ith product (ton/ha), ei is equivalence factor of different bio-productive land types. The equivalence factor (ei) of different land types (cropland, pastureland, forestland, marine land, etc.) is provided in .
Table 2. Equivalence factor (GFN, Citation2016)
This study focuses on the life cycle ecological footprint assessment of an RSPV system located in tropical climatic zone of India. This study is significant, as a huge enhancement in installation and commissioning of RSPV systems in India is envisaged in the near future. This study will help in the direction of overall estimation of natural resource demand for India’s renewable energy transition. Such a study may also be helpful in exploring the potential reduction feasible in the EF of the power sector of the country.
2. Methodology
The method used in this study to compute the life cycle ecological footprint of an RSPV system is explained below:
2.1. Life cycle ecological footprint of a roof-top solar PV system (EFT)
RSPV systems are responsible for natural resource consumption for manufacture &transportation, manpower requirement, waste generation, etc., during their life span. In order to evaluate EFT, the direct and indirect resource consumption related to RSPV systems are converted into their equivalent productive land that is needed to produce or absorb their impacts in the form of land categories (such as CO2 land, forestland, cropland, etc.). The various stages of the RSPV system’s life cycle are shown in . The principle of assessment of the EFT is depicted in . The estimation of EFT is given by EquationEquation (1)(1)
(1) :
Figure 1. System boundary of the life cycle stages of RSPV system
* represents Heavy Duty Vehicle (HDV).
Figure 2. The life cycle ecological footprint of RSPV system
2.1.1. Ecological footprint of materials consumption (EFm)
The EFm may be determined by considering the embodied energy of total material consumption during the lifecycle of an RSPV system. The EFm of an RSPV system is calculated by using EquationEquation (2)(2)
(2) :
where is the material consumed during the lifecycle of an RSPV system and
is the embodied energy associated with that material;
represents corresponding emission factor (tCO2/MJ); Aoc represents percentage of CO2 absorption in oceans i.e. 0.3 (SIO, Citation2017), and Af is CO2 absorption factor of forests i.e. 2.68 tCO2/ha (Mancini et al. Citation2016). The term
represents the equivalence factor of CO2 absorption land ().
2.1.2. Ecological footprint of direct energy consumption (EFe)
The EFe depends on the amount of direct energy consumed during the life cycle of RSPV system. The estimation of EFe is given by EquationEquation (3)(3)
(3) :
where and
are the amount of electricity and fossil fuel used, respectively;
(i.e. 0.82 tCO2/MWh; Ministry of Power Central Electricity Authority, Government of India (MPCEA) Citation2018) and
(i.e. 3.17 kgCO2/kg of diesel; EEA, Citation2013) are the emission factor for electricity and emission factor for fossil fuel, respectively.
2.1.3. Ecological footprint of transportation (EFt)
The EFt depends on three parameters: first, RSPV system materials’ transportation from the production site to the onsite RSPV project; second, manpower transportation from their houses to the onsite RSPV project; and third, waste disposal from the project site to landfill area/recycling plant. The assumptions for the estimation of the EFt are as follows:
RSPV system materials and wastes are transported through Heavy Duty Vehicles (HDV).
Labourers use diesel-fuelled buses to reach the site of the RSPV project from their houses.
The average distance travelled by labourers is 5–10 km and wastes are transported to a distance of 10–15 km.
Estimation of the EFt of material, manpower and wastes is done by EquationEquation (4)(4)
(4) :
where and
are consumption and the average distance of transportation of ith material during RSPV system life, respectively.
(i.e. 10 km) and
(i.e. 12 km) are waste generation and the average distance travelled by the jth material, respectively.
and
(i.e. 7 km) are number of labourers and average distance travelled by them, respectively.
(i.e. 3.5 tonnes) and
(i.e. 50 passengers) represent the capacity of HDV and Bus, respectively.
is emission factor of fossil fuel (i.e. 3.17 kgCO2/kg of diesel; EEA, Citation2013), FHDV (i.e. 0.222 kg of fuel/km) is average fuel efficiency of HDV and Fbus (i.e. 0.222 kg of fuel/km) is average fuel efficiency of the bus (Baidya and Borken-Kleefeld Citation2009).
2.1.4. Ecological footprint of labour/manpower (EFmp)
The manpower requirement for an RSPV system is categorised into three categories: (a) skilled labour, (b) semi-skilled labour and (3) unskilled labour. The total manpower requirements during an RSPV lifespan are estimated in terms of full-time equivalent (FTE). FTE is the ratio of the total numbers of paid hours during a period (part time, full time, contracted) by the number of working hours in that period. An employment opportunity of one FTE is a job that exists for one person to work on for the duration of 1 year. The calculation assumes 260 working days per calendar year (CEEW and NRDC, Citation2014, Citation2015). The total number of manpower requirements during the lifecycle of an RSPV system is estimated according to a report by the Skill Council of Green Jobs (SCGJ, Citation2016); which is depicted in .
Table 3. Employment estimate for RSPV system
The EFmp is associated with the metabolic rate of labour/manpower for the different type of activities (Martínez-Rocamora, Solís-Guzmán, and Marrero Citation2017). However, the impact of manpower’s mobility has already been considered in Section 2.1.3. It is assumed that nearly 60% of the daily metabolic calories (i.e. 2400 kcal/day; National Institute of Nutrition (NIN) Citation2018) are burned by manpower during work activities. The EFmp is determined by EquationEquation (5)(5)
(5) .
where dw is total number of labour-days worked during the life of RSPV system; fd is food intake fraction of an Indian adult diet assigned to work activity (i.e. 60%), Cfi is food consumption category i (kg/person-year); Yfi is food production yield of ith food item (kg/ha-yr). Cfuelj is fuel consumption category j (i.e. LPG, kerosene, etc.) during cooking (kg/person-year), λj is emission factor of fuel category j. The consumption of different food items in Indian households and their EF are depicted in (Annexure).
2.1.5. Ecological footprint of water use (EFw)
The EFw depends on water use during the lifecycle of an RSPV system. Groundwater is generally used in RSPV system construction in India, therefore CO2 absorption land is needed to compensate for the electrical energy for uplifting water from underground to overhead tanks. The EFw of water use is determined by EquationEquation (6)(6)
(6) :
where Cw is total water use during all phases of RSPV system (m3); Ew is electricity consumption to extract groundwater (kWh/m3); is emission factor of electricity used for groundwater extraction.
2.1.6. Ecological footprint of wastes (EFwe)
RSPV systems’ wastes generally result in landfill disposal after transportation of the waste materials. Its transportation is included in Section 2.1.2. The EFwe is determined by Equation (7):
where Xwi represents the total volume of waste generated during RSPV system life (m3) and r represents the recycled fraction of the PV system (if any). Mwi represents the dump capacity of waste disposal (m3/ha); and represents the equivalence factor of the type of bio-productive land for the wastes to be disposed (0.48 gha/ha pasture land; GFN, Citation2016).
2.2. Details of RSPV and climatic condition of the location
The RSPV system used in this study is of 1 MWp capacity; installed and commissioned by Renew Solar Energy Pvt. Ltd, India. The System is installed at Motilal Nehru National Institute of Technology, Allahabad, Prayagraj, UP, India. The photographic and satellite images of the RSPV system are depicted in respectively.
Figure 3. (a) Photographic image of RSPV system, (b) Satellite image of RSPV system
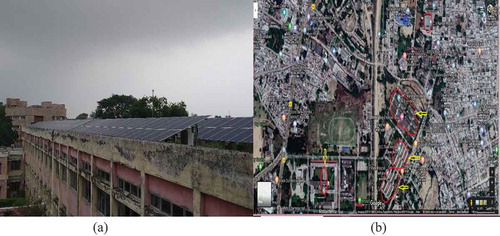
The city of Prayagraj is located in a tropical climatic zone, having geometrical coordinates of 25º27ʹ N and 81º51ʹ E. The ambient air temperature reaches up to 50ºC in summer time during peak hours, while during winter time, it drops up to 2ºC during night time. Average annual precipitation has been recorded as 978.5 mm with average rainy days of 47.9 during the year 2018. Also, the mean monthly sunshine hours are recorded as 2773.7 hours with average daily solar radiation of 4.93 kWh/m2/day. The relative humidity varies between 29% and 81% during the year.
3. Results and discussion
3.1. Ecological footprint of the RSPV system (EFT)
The EFT of the RSPV system as evaluated from EquationEquation (1)(1)
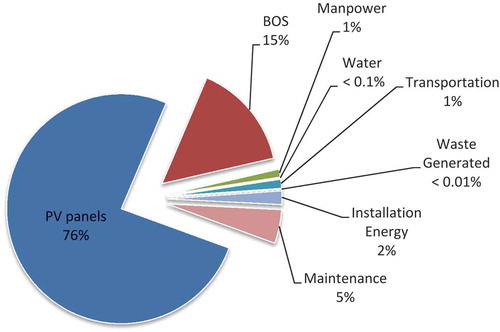
(1) is 453.84 gha (20 years of life), while the annual average EFT is about 22.69 gha/yr. The EFT per kWP capacity is 0.454 gha/kWP and the EFT per unit solar panel collector area is 0.074 gha/m2. A break-up of the EFT in its various components is depicted in . Solar PV panels contribute as much as 76% to EFT, followed by Balance of System (BOS) that contributes 15%. The detailed break-up of the results is as follows:
Figure 4. Break-up of the EFT distribution
3.1.1. Ecological footprint of materials consumption (EFm)
The embodied energy of solar PV modules and Balance of System (BOS) of the RSPV system are given in .
Table 4. Embodied energy of rooftop solar PV system
The EFm of RSPV system as calculated by EquationEquation (2)(2)
(2) is 412.46 gha (i.e. 91% of the total EFT). The detailed specifications of the RSPV system along with their environmental impact are provided in . The EF of solar PV panels is 83.5% (i.e. 344.25 gha) of the EFm of RSPV system.
Table 5. Specifications of the different parts of Installed solar PV system
3.1.2. Ecological footprint of direct energy consumption (EFe)
The environmental impact of direct energy of RSPV system mainly occurs in installation and commissioning phase of system. Due to lack of data about the direct energy consumption in RSPV system, the assumption of energy consumption in installation of rooftop system is taken as 448MJ/kWp (Sumper et al. Citation2011). For one MWp RSPV system, the direct energy consumption has been estimated as 4.48 x 10⁵MJ. The EFeas calculated by using EquationEquation (3)(3)
(3) is 8.69 gha (i.e. 1.9% of the total EFT).
3.1.3. Ecological footprint of transportation (EFt)
Location of installation site of RSPV is an important factor in deciding the EF of transportation. In this study, the solar PV modules, steel frames, inverter and cables were transported from Delhi city to Prayagraj city by heavy duty vehicles (distance: approx. 700 kilometres). The EF of transportation as calculated by EquationEquation (4)(4)
(4) is 5.82 gha (i.e. 1.1% of the total EFT).
3.1.4. Ecological footprint of manpower (EFmp)
The total manpower requirement is 6134 labour-days. The EFmp as estimated by EquationEquation (5)(5)
(5) is 5.11 gha (i.e. 1.1% of the total EFT).
3.1.5. Ecological footprint of water use (EFw)
Water is mainly used during installation and operation phase of an RSPV system. To calculate water use during the entire life of RSPV system, 3.5–5 litres of water per m2 of solar PV surface (EIA, Citation2016) have been considered. The EFw of RSPV system as calculated by EquationEquation (6)(6)
(6) is 0.094 gha (i.e. 0.02% of the total EFT).
3.1.6. Ecological footprint of waste generation (EFwe)
Recycling/reuse of waste materials may reduce ecological impact but it is not evaluated in this study (r = 0). However, the EF of landfill for the waste generated is evaluated. The EFwe of the RSPV system as calculated by using Equation (7) is 0.0029 gha.
3.2. Potential of EF reduction through RSPV system
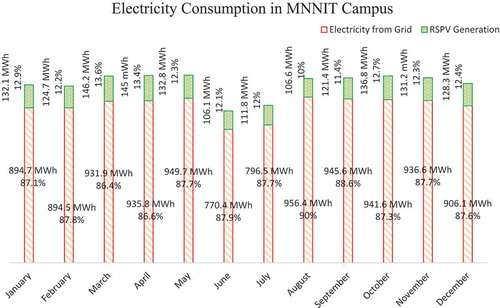
The total monthly electricity supply by national grid and RSPV system in the MNNIT campus (for the year of 2018) is depicted in . The RSPV system contributed only 10–13.6% of the total monthly electricity consumption of the MNNIT campus, hence all the electricity produced by the RSPV system is consumed within the campus and not exported to the grid. It indicates that the inter-annual variation of electricity consumption in the building does not influence our results, as no fraction of the electricity produced from RSPV is exported to the grid.
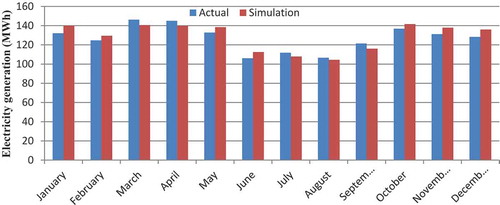
The life cycle electricity generation has been calculated with RETScreen software and the simulation results of monthly electricity generation are shown in . For the year of 2018, the actual and simulated annual electricity generation are 1523 MWh and 1544.5 MWh, respectively. The maximum positive variation in any month is recorded as 5.68% in the month of June and maximum negative variation is recorded as 4.65% in the month of September. Annual variation in actual and simulation electricity generation is recorded as 1.39%. The estimation of total electricity generation from the RSPV system is about 30,460 MWh, during the lifespan of 20 years. The total life cycle emission mitigation by the RSPV system is about 1288.5 tCO2. If the time-varying CO2eq emissions from the grid in future are considered, it will influence only the mitigation potential of the RSPV system. However, it does not influence the total EFT of the RSPV system.
Figure 5. Electricity consumption in the MNNIT campus
Thus, the life cycle ecological footprint of electricity generation by the RSPV system is only 1.49 × 10⁻⁵ gha/kWh. Considering emission factor of grid electricity in India as 0.82 tCO2/MWh (Ministry of Power Central Electricity Authority, Government of India (MPCEA) Citation2018), the estimated ecological footprint of grid electricity generation is 2.72 × 10⁻⁴ gha/kWh (ignoring factors other than emissions). Hence, the EF reduction potential by the RSPV system is about 95%. It may be pointed out here that although the physical land requirements for conventional (e.g. coal based) plants may be lower than that of RSPV systems; however, the total bio-productive land requirement may be very high, particularly in the form of CO2 absorption land. An accurate assessment of EF reduction potential of RSPV system may be possible when detailed life cycle ecological footprint studies are available for conventional power generating systems.
Figure 6. Monthly electricity generation by the RSPV system
3.3. Economic analysis
The life cycle cost (LCC) is an economic analysis tool that is used in the selection of alternatives. It compares initial investment options and identifies the least cost alternatives for selected lifespan. It consists of initial cost and yearly cost of operation and maintenance. The LCC may be estimated by Equation (7) (Kranti Citation2010):
where IC represents the initial cost, AC represents annual cost and USPW is universe-series present worth factor. The USPW is calculated by Equation (8):
where d represents discount rate and N represents the number of years for which calculation is performed.
The total initial cost of the RSPV system is 69.15 million rupees. The USPW (d = 5%, N = 20 years) as estimated by Equation (8) is 12.46. The total annual cost is Rs. 15,632. The LCC of the RSPV system as calculated by Equation (7) is 69.34 million rupees.
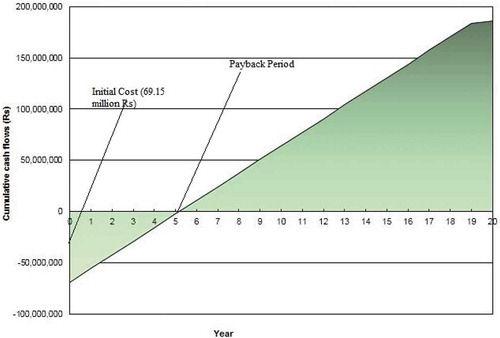
The payback period of the RSPV system is about 5.2 years (electricity rate at 8.75 Rs/kWh (UPERC, Citation2019)), Intern Rate of Return (IRR) is about 18.6%, and Net Present Value (NPV) is about 197.11 million rupees. The cash flow diagram (20 years of lifespan) of the RSPV system is depicted in . The maintenance cost and salvage value of the RSPV system is about 10,000 Rs/year and 10% of the capital cost of the RSPV system are considered, respectively.
The life cycle power generation is evaluated as 30,460 MWh, the levelized cost of electricity (LCOE) of the RSPV system is estimated as Rs 2.27/kWh. However for off-grid and hybrid systems, the LCOE of poly-crystalline module-based PV system is about 0.32–0.37 $/kWh (Jahid et al. Citation2018, Citation2019). This estimated value of LCOE is close to the LCOE of solar PV (i.e. 42–62 $/MWh) of India reported by Deshmukh et al. (Citation2019).
Figure 7. Cash flow diagram of the RSPV system
4. Conclusions
Renewable energy systems are considered as clean sources of energy through land-intensive. However, it consumes some fossil energy and other resources as well as produces emissions and wastes during its lifespan. Therefore, it imprints some environmental impact on the planet. In this study, the life cycle EF of RSPV system is estimated as 453.84 gha. The EFT per kWP capacity is 0.454 gha/kWP and the EFT per unit solar panel collector area is 0.074 gha/m2. The EF contribution of solar PV panels during their lifespan is 344.25 gha (i.e. approx. 76% of the total EFT), while the EF of BOS is 68.22 gha (i.e. approx. 15% of EFT). The estimation of lifecycle electricity generation from the RSPV system is about 30,460 MWh.
The LCC of RSPV system is calculated as Rs. 69.3million for the lifespan of 20 years; the solar PV panels and BOS contribute 49% (34 million Rs) and 43% (30 million Rs) of the total LCC of the RSPV system, respectively. The LCOE of the RSPV system is estimated as Rs 2.27/kWh.
The EF of electricity generation by the RSPV system is only 1.49 x 10⁻⁵gha/kWh. The EF of electricity generation by the RSPV system is about 95% lower than that of the grid electricity. The results obtained from such a study may be helpful in proposing and evaluating strategies for reduction in EF of power generating systems. The life cycle ecological footprint assessment of building integrated RSPV system should also be performed to facilitate sustainable building design.
Further studies need to be carried out to assess the life cycle ecological footprint of other renewable energy systems (e.g. ground-mounted solar PV, wind, biomass, small-hydro, etc.), so as to facilitate a comparative assessment of different power generating systems as well as their EF reduction potential.
Abbreviation
EF: ecological footprint
EFm: life cycle ecological footprint of material consumption
EFe: life cycle ecological footprint of energy
EFmp: life cycle ecological footprint of manpower
EFT: life cycle ecological footprint
EFt: life cycle ecological footprint of transportation
EFw: life cycle ecological footprint of water use
EFwe: life cycle ecological footprint of waste disposal
ei: equivalence factor
gha: global hectare
LCA: life cycle cost
RSPV: Roof-top solar photovoltaic
BOS: Balance of System
LCOE: Levelized cost of electricity
GHG: greenhouse gas
Disclosure statement
No potential conflict of interest was reported by the authors.
Additional information
Notes on contributors
Ajay Biswas
Ajay Biswas is a postgraduate student of Department of Mechanical Engineering at the Motilal Nehru National Institute of Technology, Allahabad (UP), India. His academic interest lie in the domain of renewable energy systems.
Dilawar Husain
Dilawar Husain is currently pursuing doctoral programme in the Department of Mechanical Engineering at the Motilal Nehru National Institute of Technology, Allahabad (UP), India. His academic interests include life cycle analysis, renewable system technologies and sustainability.
Ravi Prakash
Dr Ravi Prakash is currently working as a Professor in the Department of Mechanical Engineering at the Motilal Nehru National Institute of Technology, Allahabad (UP), India. His academic interests include energy management, life cycle energy analysis, and sustainability. He is a Fellow of the Institution of Engineers (India) and a member of the International Solar Energy Society.
References
- Ahmad, A., P. Samuel, and Y. Amar. 2016. “Solarizing India: Tapping the Excellent Potential.” Renewable Energy 9 (3): 13–17. Ministry New and Renewable Energy Government of India.
- Alsema, E. A., and M. J. Wild-Scholten. 2007. “Reduction of the Environmental Impacts in Crystalline Silicon Module Manufacturing.” Proceedings of the 22nd European Photovoltaic Solar Energy Conference and Exhibition, Milan Italy, 829–836.
- Baidya, S., and J. Borken-Kleefeld. 2009. “Atmospheric Emissions from Road Transportation in India.” Energy Policy 37 (10): 3812–3822. doi:10.1016/j.enpol.2009.07.010.
- Bastianoni, S., A. Galli, V. Niccolucci, and R. M. Pulselli.2006. The Sustainable City IV: Urban Regeneration and Sustainability’ Section 6: Land Use and Management. Southampton, UK: WIT press. 1743-3541, ISSN 1743-3541. doi:10.2495/SC060331.
- Battisti, R., and R. Corrado. 2005. “Evaluation of Technical Improvements of Photovoltaic Systems through Life Cycle Assessment Methodology.” Energy 30 (7): 952–967. doi:10.1016/j.energy.2004.07.011.
- Central Electricity Authority, Government of India, Ministry of Power (CEA). “All India Installed Capacity of Power Stations on 31March 2019.” http://www.cea.nic.in/reports/monthly/installedcapacity/2019/installed_capacity-03.pdf
- Chambers, N., C. Simmons, and M. Wackernagel. 2004. Sharing Nature’s Interest: Ecological Footprints as an Indicator of Sustainability. London, Great Britain: Sterling Earthscan.
- Council on Energy Environment and Water and National Research Development Corporation (CEEW & NRDC). 2014. Solar Power Jobs: Exploring the Employment Potential in India’s Grid- Connected Solar Market. New Delhi: Shakti Foundation.
- Council on Energy Environment and Water and National Research Development Corporation (CEEW & NRDC). 2015. Clean Energy Powers Local Job Growth in India. New Delhi: Shakti Foundation.
- Deshmukh, R., G. C. Wu, D. S. Callaway, and A. Phadke. 2019. “Geospatial and Techno-economic Analysis of Wind and Solar Resources in India.” Renewable Energy 134: 947–960. doi:10.1016/j.renene.2018.11.073. Accessed 15 June 2019.
- Environmental Impact Assessment (EIA). 2016. “Solar PV Park at Tumkur By, Knight Frank India Pvt. Ltd.” http://www.kspdcl.in/sp_docs/Environment%20Assesment%20impact%20report%20Feb-16.pdf
- Eskew, J., M. Ratledge, M. Wallace, S. H. Gheewala, and P. Rakkwamsuk. 2018. “An Environmental Life Cycle Assessment of Rooftop Solar in Bangkok, Thailand.” Renewable Energy 123: 781–792. doi:10.1016/j.renene.2018.02.045.
- European Environment Agency (EEA). 2013. “EMEP/EEA Air Pollutant Emission Inventory Guidebook – 2013.” http://www.eea.europa.eu/publications/emep-eea-guidebook-2013
- Forest survey of India (FSI), 2015, “Ministry of Environment, Forest & Climate Change, Report 2015.” http://fsi.nic.in/details.php?pgID=sb_62
- Fthenakis, V., and E. Alsema. 2006. “Photovoltaics Energy Payback Times, Greenhouse Gas Emissions and External Costs: 2004-early 2005 Status.” Progress in Photovoltaics: Research and Applications 14 (3): 275–280. doi:10.1002/pip.706.
- Global Footprint Network (GFN). 2016.“Working Guidebook to the National Footprint Accounts: 2016.” Accessed 09 December 2018. http://data.footprintnetwork.org/
- Indian Horticulture Database (IHD). 2014. “Ministry of Agriculture, Government of India”. www.nhb.gov.in
- Ito, M., K. Kato, H. Sugihara, T. Kichimi, J. Song, and K. Kurokava. 2003. “A Preliminary Study on Potential for Very Large-scale Photovoltaic Power Generation (VLS-PV) System in the Gobi Desert from Economic and Environmental Viewpoints.” Solar Energy Materials & Solar Cells 75 (3–4): 507–517. doi:10.1016/S0927-0248(02)00198-8.
- Jahid, A., M. K. H. Monju, M. E. Hossain, and M. F. Hossain. 2018. “Renewable Energy Assisted Cost Aware Sustainable Off-grid Base Stations with Energy Cooperation.” IEEE Access 6: 60900–60920. doi:10.1109/ACCESS.2018.2874131.
- Jahid, A., M. K. H. Monju, M. S. Hossain, and M. F. Hossain. 2019. “Hybrid Power Supply Solutions for Off-grid Green Wireless Networks.” International Journal of Green Energy 16 (1): 12–33. doi:10.1080/15435075.2018.1529593.
- Jungbluth, N., R. Dones, and R. Frischknecht. 2007. “Life Cycle Assessment of Photovoltaics; Update of the Ecoinvent Database.” In 14th SETAC LCA Case Studies Symposium, Giteborg. www.esu-services.ch/fileadmin/downloadjungbluth-2007-PV-MRSpdfS jungbluth-2007-PV-MRSpdfS
- Jungbluth, N., M. Stucki, and R. Frischknecht. 2009. “Photovoltaics. Part XII.” esu-services.ch/fileadmin/download/06_XII_Photovoltaic-v2.2plus.pdf
- Kato, K., T. Hibino, K. Komoto, S. Ihara, S. Yamamoto, and H. Fujihara. 2001. “A Life-cycle Analysis on Thin-film CdS/CdTe PV Modules.” Solar Energy Materials 67 (1–4): 279–287. doi:10.1016/s0927-0248(00)00293-2.
- Kato, K., A. Murata, and K. Sakuta. 1998. “Energy Pay-back Time and Life-cycle CO2 Emission of Residential PV Power System with Silicon PV Module.” Progress in Photovoltaics Research and Applications 6 (2): 105–115. doi:10.1002/(SICI)1099-159X(199803/04)6:2<105::AID-PIP212>3.0.CO;2-C.
- Koo, C., T. Hong, K. Jeong, C. Ban, and J. Oh. 2017. “Development of the Smart Photovoltaic System Blind and Its Impact on Net-zero Energy Solar Buildings Using Technical-economic-political Analyses.” Energy 124: 382–396. doi:10.1016/j.energy.2017.02.088.
- Kranti, M. 2010. Energy Audit of Building Systems an Engineering Approach. 2nd ed. UK: CRC Press. ISBN 9781439828717.
- Ludina, N. A., N. I. Mustafaa, M. M. Hanafiahb, M. A. Ibrahima, M. A. M. Teridia, S. Sepeaia, A. Zaharimc, and K. Sopiana. 2018. “Prospects of Life Cycle Assessment of Renewable Energy from Solar Photovoltaic Technologies: A Review.” Renewable and Sustainable Energy Reviews 96: 11–28. doi:10.1016/j.rser.2018.07.048.
- Mancini, M. S., A. Galli, V. Niccolucci, D. Lin, S. Bastianoni, M. Wackernagel, and N. Marchettini. 2016. “Ecological Footprint: Refining the Carbon Footprint Calculation.” Ecological Indicators. 61 (2): 390–403. doi:10.1016/j.ecolind.2015.09.040.
- Martínez-Rocamora, A., J. Solís-Guzmán, and M. Marrero. 2017. “Ecological Footprint of the Use and Maintenance Phase of Buildings: Maintenance Tasks and Final Results.” Energy and Buildings 155 (2017): 339–351. doi:10.1016/j.enbuild.2017.09.038.
- Ministry of New and Renewable Energy (MNRE), Government of India. 2018. “India Release State Targets for 40 GW Rooftop Solar by 2022.” http://www.pv-tech.org/news/india_releases_individual_state_targets_for_40gw_rooftop_solar_by_2022
- Ministry of Power Central Electricity Authority, Government of India (MPCEA). “CO2 Baseline Database for the Indian Power Sector, User Guide 2016”. Accessed November 2018. http://www.cea.nic.in/reports/others/thermal/tpece/cdm_co2/user_guide_ver11.pdf
- National Institute of Nutrition (NIN). “Dietary Guidelines for Indians – A Manual 2011.” Accessed on March 2018. http://ninindia.org/DietaryGuidelinesforNINwebsite.pdf
- National sample survey office (NSSO), Ministry of Statistics and Programme Implementation, Government of India. 2014. “Household Consumption of Various Goods and Services in India 20ll-12.” mospi.nic.in/mospi_new/upload/Report_no558_rou68_30june14.pdf
- Nawaz, I., and G. N. Tiwari. 2006. “Embodied Energy Analysis of Photovoltaic (PV) System Based on Macro- and Micro-level.” Energy Policy 34 (17): 3144–3152. doi:10.1016/j.enpol.2005.06.018.
- Open Government Data (OGD). 2017. “Government of India.” https://data.gov.in/node/94765/download
- Ordóñez, J., E. Jadraque, J. Alegre, and G. Martínez. 2010. “Analysis of the Photovoltaic Solar Energy Capacity of Residential Rooftops in Andalusia (Spain).” Renewable and Sustainable Energy Reviews 14 (7): 2122–2130. doi:10.1016/j.rser.2010.01.001.
- Osma-Pinto, G., and G. Ordóñez-Plata. 2019. “Measuring Factors Influencing Performance of Rooftop PV Panels in Warm Climate Tropical Climates.” Solar Energy 185: 112–123. doi:10.1016/j.solener.2019.04.053.
- Pacca, S., D. Sivaraman, and G. A. Keoleian. 2007. “Parameters Affecting the Life Cycle Performance of PV Technologies and Systems.” Energy Policy 35 (6): 3316–3326. doi:10.1016/j.enpol.2006.10.003.
- Peng, J., L. Lun, and H. Yang. 2013. “Review on Life Cycle Assessment of Energy Payback and Greenhouse Gas Emission of Solar Photovoltaic Systems.” Renewable and Sustainable Energy Reviews 19: 255–274. doi:10.1016/j.rser.2012.11.035.
- Prakash, R., and N. K. Bansal. 1995. “Energy Analysis of Solar Photovoltaic Module Production in India.” Energy Sources 17 (6): 605–613. doi:10.1080/00908319508946107.
- Praseeda, K. I., B. V. V. Reddy, and M. Mani. 2015. “Embodied Energy Assessment of Building Materials in India Using Process and Input–output Analysis.” Energy and Buildings 86: 677–686. doi:10.1016/j.enbuild.2014.10.042.
- Scripps Institution of Oceanography (SIO). 2017. “The Keeling Curve.” Accessed 13 November 2018. https://scripps.ucsd.edu/programs/keelingcurve/2013/07/03/how-much-co2-can-the-oceans-take-up/
- Skill Council for Green Jobs (SCGJ). 2016. “Skill Gap Report for Solar, Wind and Small Hydro Sector.” New Delhi. http://sscgj.in/wp-content/uploads/2016/06/SCGJ-skill-gap-report.pdf
- Stoppato, A. 2008. “Life Cycle Assessment of Photovoltaic Electricity Generation.” Energy 33 (2): 224–232. doi:10.1016/j.energy.2007.11.012.
- Sumper, A., M. Robledo-García, R. Villafáfila-Robles, J. Bergas-Jané, and J. Andrés-Peiró. 2011. “Life-cycle Assessment of a Photovoltaic System in Catalonia (Spain).” Renewable and Sustainable Energy Reviews 15 (8): 3888–3896. doi:10.1016/j.rser.2011.07.023.
- Uttar Pradesh Electricity Regulatory Commission (UPERC). Accessed 2019. http://www.uperc.org/App_File/DISCOMS-pdf93201972728PM.pdf
- Wackernagel, M., and W. Rees. 1996. Our Ecological Footprint: Reducing Human Impact on the Earth. Gabriola Island, British Columbia: New Society.
- Wild-Scholten, M. 2009. “Energy Payback Times of PV Modules and Systems.” Energy research Centre of the Netherlands, Workshop-Photovoltaik-Modultechnik, Koln, 26–27. http://www.solaik.ch/_downloads/EnergyPaybackTime.pdf
- Yu, Z., W. Ma, K. Xie, G. Lv, Z. Chen, J. Wu, and J. Yu. 2017. “Life Cycle Assessment of Grid-connected Power Generation from Metallurgical Route Multi-crystalline Silicon Photovoltaic System in China.” Applied Energy 185: 68–81. doi:10.1016/j.apenergy.2016.10.051.
Annexure
Table 1A. Main raw materials for food preparation per capita in India