
ABSTRACT
The purpose of this study is to ‘investigate the impact of coercive and non-coercive drivers of supply chain sustainability in chain performance, with regard to the role of intermediary monitoring and collaboration’ in one of the automotive companies. In this study, a developed conceptual model was designed and validity and reliability of designed questionnaire were tested and confirmed. To gather the data, the statistical population included all stuff of reputable automaker. A statistical sample of 188 persons was selected using Cochran formula by simple random sampling method. The results of the hypothesis with 95% confidence interval using structural equation modelling using AMOS 26 software showed that: monitoring has an impact of 0.66 on sustainability while collaboration effect is 0.22. Also, monitoring has no impact on sustainability. Meanwhile, a non-coercive driver impact on collaboration is about 0.26 VS coercive drivers have no impact. Contrarily non-coercive driver’s impact on monitoring is about 0.39 while a coercive driver is 0.74. Sustainable Supply Chain Management is a popular subject in the area of operations management for both researchers and practitioners. Supply chain sustainability is availability to reduce long-term risks associated with resources consumption, energy cost fluctuations, product commitments, and pollution management, which establishes an appropriate balance between economic development, environmental monitoring, and social assets.
1. Introduction
Sustainability management is defined as all strategic business activities to minimise environmental, economic, and social sustainable risks and maximise corporate value such as shareholders value (Wang et al. Citation2008). Researchers remind that competitive priorities in sustainable supply chain management refer to the targets of manufacturing units that enable firms to compete, achieve proven capabilities of whole activities, and enhance the competitive advantage of the company. Sustainable development in supply chain management is not only a limiting factor but also an approach to improve performance (Liu et al. Citation2013). Sustainable supply chain considers material flow management, information, capital as well as collaboration among companies along the supply chain with goal integration of all sustainable development aspects (including economic, environmental and social dimensions), based on the needs of customers and shareholders. In sustainable supply chains, it is the members who utilise social and environmental criteria to remain in the supply chain; while, it is expected to be preserved competitiveness through customer requirements responsiveness and relevant economic criteria (Seuring and Müller Citation2008). Nowadays, the automotive industry, which has direct and indirect interaction in all its process with the environment has an important role in Gross national product. Also, in line with local market saturation, domestic automakers need to focus on regional and global markets. It is also necessary to pay attention to join the World Trade Organisation, development of international environmental regulations and focus on environmentally friendly green products utilisation, green management to offer products and services in the automotive industry. Also, identification and implementation of green management in the automotive industry will save on the environment through negative effects control of industrial development. Therefore, automotive executives should consider environmental dimensions and social costs in their decisions. But investigations carried out in this area indicate a few research activities in this regard in Iran. On the other hand, with an increase in the volume of global automotive exchanges and producing a large number of products, it introduces the automotive industry as a mother. Therefore, the study of any factors which can affect the sustainability of the supply chain in this large industry is also a research imperative. This research is attempting to answer the question ‘what is the impact of coercive and non-coercive environmental supply chain sustainability on supply chain performance with the role of monitoring and collaboration in the auto manufacturing.’
2. Research background and theoretical foundations
2.1. Research background
In a study to assess factors affecting the performance of supply chain management, use the analytic hierarchy process in the food industry, done by Seyfi Shojaei (Citation2016), it was defined that performance improvement of supply chain management is one of the critical issues to gain a competitive advantage for companies. In this study, information management, logistic management and relationship management were identified as the main criteria and prioritised by the analytical hierarchy process. In a study with the aim of identifying and prioritising indices which has an impact on sustainability in the foods supply chain, done by Ghasemi et al. (Citation2017), expressed that sustainable supply chain is newfound concepts production and operation field and needs for attention to environmental and social issues beside economic performance in networking organisations. The results of this study indicate that productivity and market concentration, water use, energy consumption, waste recycling, transportation, recruitment volume, employment quality and its equilibrium indicators are the most important ones, respectively. Also, according to the expert’s expression, economic aspects are much more important rather than two other parameters which require more attention to the productivity and energy sector in the sustainability of the agricultural supply chain. Ahmad et al. (Citation2016) stated that the current dependence of oil and gas producer countries on economic development and social activities requires research into supply chain sustainability in this industry. This study was done with the aim of existing gap identification in relation with internal organisational factors of supply chain sustainability and their impact on sustainability strategies by four supply chain functions: supplier management, production management, product monitoring, and logistics management. Nasrollahi et al. (Citation2020) investigated the impact of environmental capabilities on strategies and environmental efficiency: the mediating role of marketing capabilities. Tachizawa, Gimenez, and Sierra (Citation2015) analysed complex interactions among the drivers of sustainable supply chain management and its performance. Results have indicated that coercive and non-coercive drivers have different impacts on supply chain sustainability. Also, management monitoring is not enough to improve sustainability and companies need to adopt collaborative ways with their suppliers. The results show that while collaboration has a direct impact on performance, monitoring is only an indirect relationship through collaboration. Fathi et al. (Citation2020) evaluated the sustainability indicators of rubber supply chain using the cross-impact matrix. Safari et al. (Citation2018) presented a compromise solution of interval VIKOR to develop a method for evaluating and selecting the appropriate suppliers. On the other hand, the objective weights based on Shannon entropy which is fitted with imprecise data are used to eliminate the mental error caused by subjective judgement. At the end, a numerical example is presented to demonstrate the application of the proposed method in selecting the suppliers. Wang et al. (Citation2018) investigated the effects of customer and cost drivers on green supply chain management practices and environmental performance. Based on a study of 246 companies in multiple countries, the results indicate that both cost drivers and customer drivers significantly influence internal and external green practices, which in turn contribute to environmental performance. Moreover, the impacts of cost and customer drivers on internal and external green practices are influenced by firm size: the impacts of cost drivers are greater for large firms than for small firms, while those of customer drivers are lower for large firms than for small firms. Our findings have both theoretical and managerial implications for the GSCM literature and practice. Rajesh and Rajendran (Citation2019) explored an empirical evidence for the relationship binding ESG scores and sustainability performances of firms. They observed and evaluated the ESG performance scores of 1,820 firms globally for 5 years, from 2014 to 2018 on 10 major themes and over 400 different indicators, as listed by Thomson Reuters and is captured from the Bloomberg terminal data. They posited five hypotheses to check the relations binding ESG scores and the total sustainability performances of firms. A Partial Least Square (PLS) analysed and standard bootstrapping using Smart PLS 3.0 software (Wong Citation2013) is used to observe the results and to evidence the direct and moderating effects among latent variables contributing to sustainability performances. They observed a significant and negative moderating effect of ESG performances, independently over the all direct relations, considering their relationship to ESG performances. Rajesh (Citation2020a) investigated the sustainability performances of 39 firms in the Indian context, listed in the Thomson Reuters ESG scores that are consistently rated for their Environmental, Social, and Governance performances, for a period of 5 years from 2014 to 2018. A grey incidence analysis is used to study the most important indicators or attributes contributing to the sustainability performances of the Indian firms. It is observed from the results of the analysis that the Resource use score, the Environmental innovation score, and the Corporate Social Responsibility (CSR) strategy score emerges as the most important indicators contributing to Environmental, Social, and Governance performances of Indian firms. Whereas, the Shareholders score, the Management score, and the Human rights score appears to be among the least determining indicators, in the Indian context to achieving total Environmental, Social, and Governance performances. Dubey et al. (Citation2017) argued for the use of Total Interpretive Structural Modelling (TISM) in sustainable supply chain management (SSCM). The framework depicts how drivers are distributed in various levels and how a particular driver influences the other through transitive links. The paper concludes with limitations and further research directions. Rajesh (Citation2020b) formulated an integrative decision-making model for SSCM in the Indian context, which considers several strategies, interfaces, and regulations for sustainability along with the attributes contributing to each.
2.2. Theoretical foundations
Supply chain involves all activities relevant to flow and exchange of goods and services, beginning from raw material up to final product consumable by the customer including flow of materials, information and finances issues (Handfield and Nichols Citation2002). Based on expression, one of the most critical issues in the supply chain is the attention to the dynamics of information between the company with both suppliers and customers. As a result, the supply chain is considered as an important principle by the managers in companies so that top management will focus on connection and proper interactions with suppliers and customers beside company’s internal activities (Hosseini and Sheikhi Citation2013). Relationship management has a significant impact on all supply chain aspects, as well as its performance level. In many cases, the information systems and technology needed for supply chain management activities are readily available so it can be completed and deployed within a relatively short time frame. However, most initial failures in the supply chain are due to the poor transfer of expectations and behaviours that arise between the parties involved in the chain (Heydari Citation2009). The requirement for the proper flow of material is to use a complete and accurate information flow system at appropriate times and locations, as well as to have excellent and organised relationships with other supply chain members. If any damage occurs in this regards, its effects will be apparent on the other components (flow of materials and information). Therefore, it is essential to establish a specific relationship with other members of the supply chain (Stadtler, Kilger, and Meyr Citation2015).
3. Research method
This research is applied in terms of purpose; also, the technique used in this research is descriptive-survey research method. The statistical population of this research includes all experts, managers and general managers of one of the reputable automotive companies in Tehran. The total number of personnel was 369 on the basis of the inquiry, including 16 deputies, 21 managers, 38 general managers and 294 experts. It has been used a simple random sampling method, which means all managers and experts had been an equal chance to answer the questions of this research. Also, the Cochran method was used to determine the sample size. The library method has been used to collect research background and theoretical foundations in relevant fields of research. Since this is survey research, it has been used as a standard questionnaire, so its questions have been adapted from authoritative research. In order to measure the validity of the questionnaire, it has been used face and content validity tools, as the questionnaire is standard. So it was just necessary to compare the structure of the questionnaire with the subject under study. Therefore, the questionnaire of this research was distributed among a group of university professors for question checking regarding the number, questionnaire appropriateness, relation with the subject and its measurement, in case of content validity and capability of concept measurement before the final distribution. Cronbach’s alpha coefficient has also been used to measure reliability, as in surveying studies, this method is more commonly used rather than other sustainability methods, yet it is the most manageable and most comprehensible way to measure reliability. Also, since this coefficient measures the internal consistency of the variables, it means what extent all the components in a test represent an identical concept and represent the internal relationship of these components. Therefore, this method is much more reliable than other methods, such as test-retest, etc. to measure and analyse the obtained data. In this study, in the beginning, it has been used descriptive statistics to obtain mean and standard deviation in each question then a column graph in the five-point Likert scale is allocated to the frequency distribution of the answers given to each question by using SPSS 22 software (Gunarto Citation2019). In inferential statistics field, it has been used structural equation modelling by AMOS 26 software (Blunch Citation2012) for statistical hypothesis testing. Structural equation modelling is one of the robust and most suitable methods for analysis in management science research and multivariate analysis because the nature of these issues is multivariate and should not be solved by the bi-variable method. Therefore, since there are several independent variables in the present study that their effect on the dependent variable should be considered, the use of the structural equation model is highly recommended. The developed model of research is as following ():
Figure 1. Conceptual model of research
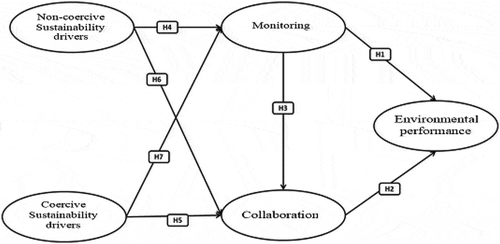
According to the conceptual model of research, the following hypothesis was developed:
H1: Managerial monitoring on supply chain sustainability has a positive and significant effect on performance of supply chain.
H2: Improving collaboration in the supply chain has a positive and significant effect on the environmental performance of the supply chain.
H3: Managerial monitoring on the supply chain sustainability has a positive and significant effect on improving partner collaboration in the chain.
H4: Non-coercive drivers of sustainability in the supply chain have a positive and significant effect of improving managerial monitoring on supply chain sustainability.
H5: Coercive drivers of sustainability in the supply chain have a positive and significant effect on improving partners’ collaboration in the chain.
H6: Non-coercive drivers of sustainability in the supply chain have a positive and significant effect on improving partner collaboration in the chain.
H7: Coercive drivers of sustainability in the supply chain have a positive and significant effect on Managerial monitoring on the supply chain sustainability.
4. Findings
The first step in data analysis, is a description and be aware of the characteristics of subjects in research and to be common variations of critical indicators in the sample. The purpose of descriptive analysis in the existing research is to screen the respondents in terms of variables such as education, gender, etc. In a descriptive study, the anthropological variables and critical variables are described as follows:
Most of the cases in sampling consist of men with 71.7%.
The majority of cases in sampling comprised 49.7% of the bachelor degree.
The majority of cases in sampling comprised 73.1% of the expert position.
The majority of cases based on the organisation chart are from the engineering department with 31.7%.
The majority of cases based on population are around 31–40 years old, with 41.4%.
The majority of cases based on experience, are around 11–20 years with 53.8%.
The results of the descriptive analysis of the questions of the research variables in the questionnaire state 145 individuals in the research sample answered all questions about the main variables and no question without an answer. In the next step, with attention to the minimum and maximum responses shows that in all questions of the questionnaire, all five LIKERT scales were available from ‘very low’ to ‘very high’. Given that the five answers to each question in this research are 1 to 5, so the average response to every question is 3. The higher than average for each question is above 3, shows more consensus between samples. According to the survey results, most questions were below the average, indicating a high level of disagreement amongst the respondents on of questions. Two other indicators have introduced as standard deviation and variance, which are the dispersion indices. The lower the standard deviation for each question, the fewer respondents are likely to disagree about that question. With referring to results of the survey, most of the questions had a standard deviation more than one, indicating a high level of disagreement among the respondents on the questions (in confirmation of the data obtained in the mean).
shows the results of correlation factors between variables. As shown in , there are no significant correlations between every two variables discussed in this study due to the correlation factor below 0.9. As correlation factors were reasonable, therefore research data have been validated.
Table 1. Results of correlation factors (coherence) between variables
In order to perform structural equation modelling in a parametric manner, it is necessary all data and variables to be normal by default. In order to check it the data is normal, it has suggested using Kolmogorov-Smirnov test and Skewness-kurtosis test in this study. Skewness is criteria of symmetry or asymmetry of a distribution function. For a completely symmetric distribution, skewness is zero and for an asymmetric distribution with higher values, Skewness is positive while for lower values, Skewness is negative. Kurtosis represents the height of a distribution. In other words, Kurtosis is a criterion of curvature at the peak and its value for normal distribution is 3. The positive Kurtosis represents the peak of the desired distribution higher than normal distribution and the negative Kurtosis marks a lower peak than normal distribution. In order to judge about the allowable degree of Skewness-Kurtosis for each question, amount of both statistics should be between ±1. shows Skewness and Kurtosis for each question.
Table 2. Skewness and Kurtosis results for each question
According to , allowable degree of Skewness-Kurtosis for all questions, is in acceptable range between ±1, so the distribution of data for each question in this research respect normal distribution and meet prerequisite for the normalisation of data in each question as well as proper condition for parametric structural equations modelling. After Skewness-Kurtosis calculation method, Kolmogorov-Smirnov test is one of the most reliable methods to measure the normality of data. This test includes the following hypotheses to check if research variables follow normal distribution or not.
H0: Data does not follow normal distribution
H1: Data follow normal distribution
Table 3. Kolmogorov-Smirnov results for variable normal distribution
The results of this test for the main variables of the study are presented in :
According to , the significance level of the test for all variables is higher than 0.05, so H0 assumption is rejected and normal distribution claim for variable research data was not rejected. Therefore, data distribution for each variable in this research has been normal. In order to easily identify variables of structural equation model in AMOS software (Blunch Citation2012), the research variables are named in as follows:
Table 4. Variable nomination in structural equation model in research
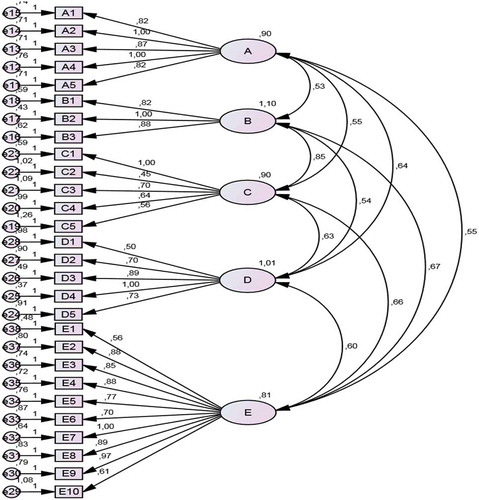
In first step, the well-functioning of the factor structure determined through exploratory factor analysis. Accordingly, with the help of AMOS software (Blunch Citation2012), in order to confirm all factors mentioned in the questionnaire, it has used confirmatory factor analysis technique. shows the results of confirmatory factor analysis for the observable variables of research.
Table 5. Results of confirmatory factor analysis for observable variables of research
For results of factor analysis, the significance level for all questions is less than 0.05 And load factors are higher than 0.5, so all questions have been validated with 95% confidence level shows the AMOS software (Blunch Citation2012) output for the confirmatory factor analysis:
Figure 2. AMOS Software output for confirmatory factor analysis
The overall output of AMOS software (Blunch Citation2012) for the whole structural model of the research, taking into account all exogenous and endogenous variables, is presented in . In this output, the load factors are given for each of the paths defined in the structural model of the research.
Figure 3. The overall output of AMOS software for the structural model of research
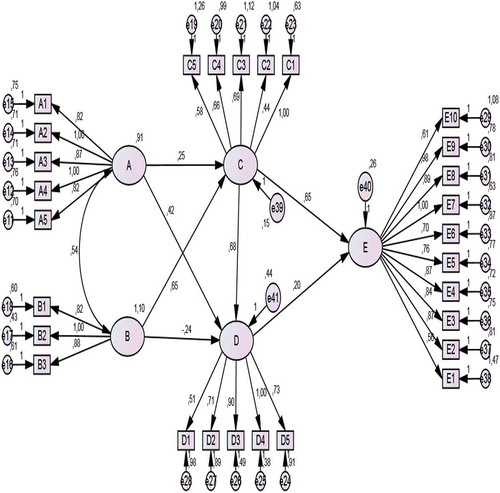
Types of fitting indices in structural equations are divided into three main groups of absolute fit indices, adaptive fit indices, and fitting indices. Acceptance criteria for each of these indicators have been shown, respectively, in .
Table 6. Fitting indices
Results of research hypotheses in the structural model of the research are presented in :
Table 7. Test results of research hypotheses by structural equation model
According to the calculations given in , since the C.R ratio presented for H1, H2, H4, H6 and H7 hypotheses is upper than 1.96 and significance level is less than 0.05, therefore, with 95% of confidence, these assumptions are confirmed. In other words, managerial monitoring has an impact on supply chain sustainability, collaboration improvement in the supply chain has an impact on the environmental performance of the supply chain, non-coercive drivers have an impact on partner’s collaboration in the supply chain. Also, non-coercive drivers and coercive drivers in the supply chain has an impact on managerial monitoring improvement in the supply chain. According to the calculations given in , since the C.R ratio presented for the H3 and H5 hypotheses is less than 1.96 and the significance level is upper than 0.05, so with 95% of confidence these two assumptions are not confirmed. In other words, managerial monitoring in supply chain sustainability has no significant impact on partner’s collaboration in the chain; similarly, coercive drivers in the supply chain have no impact on partner’s collaboration in the supply chain.
5. Conclusions
Based on hypothesis 1, from company experts and managers point of view, as they are demanding acceptance and application of environmental standards and guidelines by their suppliers and distributors, so to gain access to the performance of their suppliers, they use an unofficial and unstructured survey method of supplier performance. Also, they check their suppliers through formal evaluations based on predetermined instructions and procedures, as well as by conducting environmental audits; they provide necessary feedback on the environmental performance for their suppliers. Accordingly, following above methods lead company subsidiaries to be succeeded in case of environmental performance to reduce waste, reduce the environmental threats posed by the company products; to produce in line with environmental protection, to recycle hazardous waste, to cooperate with suppliers to minimise waste, to train staff in safety and health issues (HSE), compliance with local regulations, to assess environmental life cycle in case of design, product and investment for designed vehicles to reduce their environmental impact, and finally use of multimodal transportation to reduce destructive transportation.
Based on hypothesis 2, from company experts and managers point of view, as they have taken into account environmental education necessary for their personnel and suppliers, so they work collaboratively with suppliers to reduce waste, to design and perform environmental activities (such as recycling, transportation, packaging, etc.) and to deal with suppliers. With the production of environmentally friendly materials (e.g. material/energy base design, recycling base design) will collaborate with suppliers and avoid usage of hazardous and unsafe products while they monitor their supplier in this regard. So following above methods lead the company to be succeeded in case of environmental performance to reduce waste, reduce the environmental threats posed by the company products, to produce in line with environmental protection, to recycle hazardous waste, to cooperate with suppliers to minimise waste, to train staff in safety and health issues (HSE), compliance with local regulations, to assess environmental life cycle in case of design, product and investment for designed vehicles to reduce their environmental impact, and finally use of multimodal transportation to reduce destructive transportation.
Based on hypothesis 3, from company experts and manager’s point of view, their attention to adopt and implement of environmental standards and guidelines by their suppliers and distributors, so to gain access to the performance of their suppliers, they use an unofficial and unstructured survey method of supplier performance. Also, they check their suppliers through formal evaluations based on predetermined instructions and procedures, as well as by conducting environmental audits; they provide necessary feedback on the environmental performance for their suppliers. Accordingly, following above methods could not lead the company to be succeeded in case of collaboration in the supply chain such as environmental education personnel and suppliers, collaborative work with suppliers to reduce waste, to design and perform environmental activities (such as recycling, transportation, packaging, etc.), and dealing with suppliers with the production of environmentally friendly materials (e.g. material/energy base design, recycling base design) and monitoring suppliers to avoid usage of hazardous and unsafe products.
Based on hypothesis 4, from company experts and managers point of view, as this company is under pressure by their customers to carry out environmental production and marketing research beside its main competitors, top management has focused on environmental production and marketing activities, to be under pressure by society to carry out environmental base production and marketing activities and finally, they are under pressure by the banking system and financial institutes to supply their needs based on environmental activities. So it has more focused on monitoring improvement in the supply chain by adoption and implementation of environmental standards and guidelines by their suppliers and distributors, to gain access to the performance of their suppliers by using an unofficial and unstructured survey method, to check their suppliers through formal evaluations based on predetermined instructions and procedures, as well as by conducting environmental audits, and provide necessary feedback on the environmental performance for their suppliers.
Based on hypothesis 5, from company experts and managers point of view, none of the governmental pressure on the company to carry out the environmental base production and marketing activities, legal institutes pressure (e.g. Ministry of Industry and Mines, etc.) to carry out the environmental base production and marketing activities, and car manufacturing Association pressure to carry out the environmental base production and marketing activities have been enough power in collaboration with the supply chain in case of necessary environmental education for personnel and suppliers, collaborative efforts with suppliers to reduce waste, to design and perform environmental activities and to deal with suppliers to collaborate with suppliers to produce environmentally friendly materials and avoid usage of hazardous and unsafe products. At the same time, they monitor their supplier in this regard. So there are no significant coercive drivers in this regard.
Based on hypothesis 6, from company experts and managers point of view, governmental pressure on the company to carry out the environmental base production and marketing activities, legal institutes pressure (e.g. Ministry of Industry and Mines, etc.) to carry out the environmental base production and marketing activities, and car manufacturing Association pressure to carry out the environmental base production and marketing activities have been enough power to focus on monitoring improvement in the supply chain by adoption and implementation of environmental standards and guidelines by their suppliers and distributors, to gain access to the performance of their suppliers by using an unofficial and unstructured survey method, to check their suppliers through formal evaluations based on predetermined instructions and procedures, as well as by conducting environmental audits, and provide necessary feedback on the environmental performance for their suppliers.
Based on hypothesis 7, from company experts and managers point of view, as this company is under pressure by their customers, main competitors, society, banking system and financial institutes in case of financial resources to perform environmental base products and marketing research, as well as top management has more focused to carry out environmental base production and marketing activities, so in collaboration with the supply chain in case of necessary environmental education for personnel and suppliers, collaborative efforts with suppliers to reduce waste, to design and perform environmental activities and to deal with suppliers to collaborate with suppliers to produce environmentally friendly materials and avoid usage of hazardous and unsafe products while they monitor their supplier, are some other issues to focus by top management.
6. Implication
In this section, implications for managers are presented for better improvement:
To develop proper instructions, procedures and flexible organisation guidelines for purchasing row material and equipment from the supplier.
To evaluate the current supplier’s performance periodically with clear criteria in case of material and equipment supply.
To improve supplier relationship by investment in interactive systems and flexible interconnections.
To negotiate about requirements with suppliers to supply raw material and equipment especially for new products.
To share key supplier information, their relationship with the company, financial transaction, etc. throughout the company.
To share any information with key suppliers to absorb more collaboration and develop the relationship between companies.
To keep any information regarding previous suppliers or even suppliers who are currently don not cooperate with the company.
To make planning and budgeting for improvement and equipment upgrading to provide environmental base products for the foreign market.
To pay more managerial attention in order to provide and upgrade proper products resources such as raw material, equipment, skills, and the necessary expertise to adopt environmental targets.
To use foreign market consultants, academic and industrial research which has published in media such as newspapers, TV, commercial and industrial websites and governmental research institutes for improvement of necessary technologies in this regards.
By customers surveying and market research on environmental factors important by customers, fulfil their desire and needs in their products.
To improve and update current environmental culture in process and product in term of the importance of environmental attention, environmental requirements, publish environmental targets and strategies through pay especial attention on educational requirements and incentive programmes for members.
To put environmental issues and activities in internal-external priorities while publishing strategies, targets and strategic planning.
To update organisational environmental culture by the implementation of collaborative culture and encourage employees to express ideas that improve environmental product quality.
Disclosure statement
No potential conflict of interest was reported by the authors.
Additional information
Notes on contributors
Mahdi Nasrollahi
Mahdi Nasrollahi is an Assistant Professor at Imam Khomeini International University (IKIU), Iran. He received his PhD in Industrial Management from University of Tehran. His research interests include SCM, MADM and DEA. He has written several papers about Supply Chain Management, Multiple Criteria Decision Making and Mathematical Modeling.
Mohammad Reza Fathi
Mohammad Reza Fathi is an Assistant Professor, College of Farabi at University of Tehran, Iran. He received his PhD in Industrial Management from University of Tehran. His research interests include SCM, MADM and DEA. He has written several papers about Advanced Supply Chain Management, Multiple Criteria Decision Making and Mathematical Modeling.
Hamid Reza Sanouni
Hamid Reza Sanouni received his MSc in Business Management from Islamic Azad University, Tehran, Iran. His research interests include Management, Marketing and Statistical Analyze.
Seyed Mohammad Sobhani
Seyed Mohammad Sobhani received his MSc in Business Management from University of Tehran, Iran. His research interests include Management, Marketing and Statistical Analyze.
Amirhossein Behrooz
Amirhossein Behrooz is a Faculty Member of Master of Business Administration Department, Payame Noor University, Qom, Iran. His research interests include Management, Supply Chain Management and Statistical Analyze.
References
- Ahmad, W. N. K. W., J. Rezaei, L. A. Tavasszy, and M. P. de Brito. 2016. “Commitment to and Preparedness for Sustainable Supply Chain Management in the Oil and Gas Industry.” Journal of Environmental Management 180: 202–213. doi:10.1016/j.jenvman.2016.04.056.
- Blunch, N. 2012. Introduction to Structural Equation Modeling Using IBM SPSS Statistics and AMOS. Thousand Oaks,CA: SAGE.
- Dubey, R., A. Gunasekaran, T. Papadopoulosc, S. Childed, K. T. Shibine, and S. F. Wambaf. 2017. “Sustainable Supply Chain Management: Framework and Further Research Directions.” Journal of Cleaner Production 142: 1119–1130. doi:10.1016/j.jclepro.2016.03.117.
- Fathi, M. R., A. Zamanian, M. H. Soleymani Sarvestani, and R. Fathi. 2020. “Evaluation the Sustainability Indicators of Rubber Supply Chain Using the Cross-Impact Matrix.” Iranian Rubber Industry Journal 24 (96): 3–12.
- Ghasemi, A. R., M. A. Rayatpisheh, A. Haddadi, and S. Rayat Pisheh. 2017. “Identifying and Prioritizing the Factors Contributting to Sustainability of Food Supply Chain.” Journal of Environmental Science and Technology 19 (4): 369–382.
- Gunarto, H. 2019. Parametric & Nonparametric Data Analysis for Social Research: IBM SPSS. United Kingdom: LAP Academic Publishing. ASIN 6200118728. ISBN 978-6200118721.
- Handfield, R. B., and E. L. Nichols. 2002. Supply Chain Redesign: Transforming Supply Chains into Integrated Value Systems. Upper Saddle River, New Jersey: FT Press.
- Heydari, H. 2009. “Modeling and Implementing Supply Chain Management in Small and Medium Enterprises.” Roshd-e-Fanavari 17: 43–51.
- Hosseini, S. M., and N. Sheikhi. 2013. “Supply Chain Integration and Firm Performance in Iranian Food Industry.” Journal of Business Management 15: 99–125.
- Liu, H., W. Ke, K. Kee Wei, and Z. Hua. 2013. “Effects of Supply Chain Integration and Market Orientation on Firm Performance: Evidence from China.” International Journal of Operations & Production Management 33 (3): 322–346. doi:10.1108/01443571311300809.
- Nasrollahi, M., M. R. Fathi, S. Dehghan, and A. Saberi. 2020. “Investigating the Impact of Environmental Capabilities on Strategies and Environmental Efficiency: The Mediating Role of Marketing Capabilities.” Iranian Rubber Industry Journal 24 (96): 39–50.
- Rajesh, R. 2020a. “Exploring the Sustainability Performances of Firms Using Environmental, Social, and Governance Scores.” Journal of Cleaner Production 247: 119600. doi:10.1016/j.jclepro.2019.119600.
- Rajesh, R. 2020b. “Sustainable Supply Chains in the Indian Context: An Integrative Decision-making Model.” Technology in Society 61: 101230. doi:10.1016/j.techsoc.2020.101230.
- Rajesh, R., and C. Rajendran. 2019. “Relating Environmental, Social, and Governance Scores and Sustainability Performances of Firms: An Empirical Analysis.” Business Strategy and the Environment 29 (3): 1247–1267. doi:10.1002/bse.2429.
- Safari, H., A. H. Jafarzadeh, M. H. Aliahmadi, and M. R. Fathi. 2018. “Extension of MCDM Method for Supplier Selection Problem with Interval Numbers Based on Objective Weighting.” International Journal of Industrial Engineering 25 (6): 800–814.
- Seuring, S., and M. Müller. 2008. “From a Literature Review to a Conceptual Framework for Sustainable Supply Chain Management.” Journal of Cleaner Production 16 (15): 1699–1710. doi:10.1016/j.jclepro.2008.04.020.
- Seyfi Shojaei, H. 2016. “Assess the Factors Affecting the Performance of Supply Chain Management, the Analytic Hierarchy Process in the Food Industry.” Biannual Journal of Value Chain Management 1 (2): 1–16.
- Stadtler, H., C. Kilger, and H. Meyr. 2015. Supply Chain Management and Advanced Planning. Berlin, Heidelberg: Springer.
- Tachizawa, E. M., C. Gimenez, and V. Sierra. 2015. “Green Supply Chain Management Approaches: Drivers and Performance Implications.” International Journal of Operations & Production Management 35 (11): 1546–1566. doi:10.1108/IJOPM-01-2015-0023.
- Wang, C., C. Fergusson, D. Perry, and J. Antony. 2008. “A Conceptual Case-based Model for Knowledge Sharing among Supply Chain Members.” Business Process Management Journal 14 (2): 147–165. doi:10.1108/14637150810864907.
- Wang, Z., Q. Wang, S. Zhang, and X. Zhao. 2018. “Effects of Customer and Cost Drivers on Green Supply Chain Management Practices and Environmental Performance.” Journal of Cleaner Production 189: 673–682. doi:10.1016/j.jclepro.2018.04.071.
- Wong, K. K. K. 2013. “Partial Least Squares Structural Equation Modeling (PLS-SEM) Techniques Using SmartPLS.” Marketing Bulletin 24 (1): 1–32.