
 ?Mathematical formulae have been encoded as MathML and are displayed in this HTML version using MathJax in order to improve their display. Uncheck the box to turn MathJax off. This feature requires Javascript. Click on a formula to zoom.
ABSTRACT
Owing to degrading environmental conditions, replacement of pollution causing outdated conventional fuel cars by eco-friendly Electric Vehicles (EVs) is one of the many steps taken for improvement. There are many reasons why people are reluctant to adopt EVs. Lack of proper EV Charging Stations (EVCS) at optimum intervals just like fuel pumps for conventional cars is a major cause. In this study, different criteria from multidimensional aspects including technical, environmental, economic, and social factors affecting the construction of an EVCS were taken up. Using an integrated moduleFuzzy – Technique for Order of Preference by Similarity to Ideal Solution (TOPSIS) and Quality Function Deployment (QFD) analysis the selected location for possible construction of an EVCS was adjudged. To showcase the results the authors adopted a Quantum Geographical Information System (Q-GIS) based approach. The results obtained after TOPSIS were further checked using a benchmark Multi-Criteria Decision Making (MCDM) approach to check for its validity. The methodology module proposed in this study can be adopted in any such study aiming at a similar purpose.
1. Introduction
Kolkata, the capital of West Bengal, India, accounts for a population of 4.5 million (Census Citation2011).On including the suburban areas of the city, the population increases to 14.1 million, making it the third most populated metropolis in India. However, with the population of the city on a continuous rise, the number of cars in the city has also been increasing, accounting for the worsening of air quality. Statistical reports show that the vehicle count of the city stood at 741,000 as of 2016 (https://www.statista.com/statistics/665776/total-number-of-vehicles-in-kolkata-india/).Thirteen areas within the city have already been classified as ‘critically polluted’ by the Central Pollution Control Board of India (Report: Centre for Science and Environment Citation2016). Within the city of Kolkata, the NO2 level of the air is 1.8 times the permissible limits. A dominating reason for this anomaly can be attributed to the large number of fossil fuel-powered cars that run on the streets of Kolkata. The air of the city has been found to contain cancer-causing toxins like benzo-(a)-pyrene, benzene, and carbonyl (Report: Centre for Science and Environment Citation2016).
A revolution in the transportation sector may help in bringing down the tremendous levels of pollution, especially caused by vehicular emissions, which in Kolkata already stands 4 times higher than the world average and the highest in terms of Indian cities according to a study by the University of California, Berkeley (Report: Centre for Science and Environment Citation2016). Implementation of EVs in place of conventional fuel cars is often projected as a progressive step to promote sustainable development. Keeping in toe with such moves, West Bengal has been carrying on incentives to bring in electric ferries and electric buses into the public transport system. The New Town Kolkata Development Authority (NKDA) has already assured the clearance of their proposal to adopt EVs into their system, inviting private firms to pitch ideas on the development of dedicated EVCS (https://www.nkrealtors.com/blog/future-electric-vehicles-charging-stations-kolkata/). Kolkata has already been certified as a potential market for bringing in EVs in their network according to a study by the India Smart Grid Forum.
However, besides other factors, one of the major factors causing hindrance in the way of EVs, as stated by owners of EVs themselves, is the lack of a frequent number of EVCS within the city. This speculation has led the Kolkata Municipal Corporation (KMC) and the Calcutta Electric Supply Company (CESC) to take up numerous initiatives for the establishment of EVCS across the city. A pilot project that was undertaken by the CESC already targets the establishment of 150 EVCS in the city situated in an area around 567 square kilometres(https://www.nkrealtors.com/blog/future-electric-vehicles-charging-stations-kolkata/).The establishment of EVCS is an endeavour involving both finances and physical labour. It has been projected that by 2030 if 30% of cars in the city are EVs, it would demand an investment of 2073 crore Indian Rupees (INR) for the building of EVCS to sustain such a fleet. Therefore, it is essential to assess the land areas being considered for the establishment of an EVCS based on a multidimensional analysis ensuring maximum profitability.
Quite some works from recent times have started to project the necessity of establishing EVCSs at optimum locations as an indirect measure to promote the usage of EVs in a fuel-car dominating transport system (Karaşan, Kaya, and Erdoğan Citation2020; Guler and Yomralioglu Citation2020). It has been noticed that lack of EVCS at regular intervals unlike petrol pumps in the case of fuel cars raises questions regarding the reliability of the vehicle when considering larger distances of travel. Construction of an EVCS again is an act involving quite an investment of time, resources as well as manpower. It is therefore essential for the investors to ensure that the EVCS being constructed is in optimal sites ensuring both customer satisfaction as well as a profitable outcome in the long run. A complete and correct assessment of the locations being considered based on certain concerned criteria would give the suitability of that area for an EVCS construction.
This study revolves around the city of Kolkata in India, and aids in locating the zones within the city with a higher suitability index for possible construction of an EVCS, based on 14 multidimensional criteria. To handle the effect of many diverse criteria, the aid of MCDM methods was taken.
Literature Survey: The general advantages of a hybrid MCDM analogy were taken up for this work. MCDM methods are not uncommon in the field of research, especially in cases of renewable or green energy towards sustainable development, when it comes to assessing the regional potential for a particular energy source (Castillo, Silva, and Lavalle Citation2016), including micro-grids (Banerjee and Majumder Citation2016) or hydropower zones (Badang, Sarip, and Tahud Citation2018); at times even implementation of GIS technologies along with MCDM methods to identify regions for solar power (Ghose et al. Citation2019a), solar farm locations (Sanchez-Lozano et al. Citation2013). Instances of using the MCDM approach for assessment of renewable energy sources for a particular location based on affecting factors (Ghose et al. Citation2019a) or simply priority analysis of power plants from a particular energy source (Fazelpour, Roohi, and Tajeddin Citation2017) are also present. MCDM methods also find a place in material selection problems (Mayyas et al. Citation2011; Govindan, Shankar, and Kannan Citation2016), even in cases involving the selection of machinery (Srihari, Raval, and Shabbiruddin Citation2016) or material for bodies of EVs (Ghose et al. Citation2019b), amongst many others. The case under consideration being a site selection problem based on multidimensional criteria, the deployment of MCDM methods for its tackling can thus be safely considered to be justified.
Although there has been limited research on problems orienting suitable location of EVCS, very few of them have managed to consider the influence of customer-centric criteria over the ultimate suitability (Hu-Chen Liu, Miying Yang, Mengchu Zhou & Guangdong Tian, Citation2018). Some of them have even deployed certain MCDM approaches in their propositions to determine optimum EVCS locations as well (Kaya et al. Citation2020). is a summary of the works in the genre of EVCS the authors of this paper have consulted with to develop their proposed model. Here, as it would be explained in due sections, a QFD approach has been implemented to bring into consideration six completely customer-based criteria into the problem. The authors feel that customers being the ultimate beneficiaries, it is important to take in their perspective in any market-centric study. Also, the usage of a Fuzzy-based MCDM approach is unique in itself. It takes in the uncertainties surrounding data values in certain instances and allows the decision-maker the flexibility of taking in assumed data based on previously obtained values in case concrete data are not available, making the approach more realistic and robust.
Table 1. Observations and inferences from literature survey
1.1 Approach
Here the Fuzzy-TOPSIS model has been used for the analysis of the sites. Often, a hybrid MCDM method-based approach to a decision-making problem has been attributed to giving better results over traditional MCDM methods. This has further been discussed in section 7. The obtained results from the Fuzzy-TOPSIS model were compared with a benchmark MCDM tool to check for its validity. For the benchmark method, Complex Proportional Assessment (COPRAS) model was deployed. Spearman’s Rank Correlation Coefficient was used to frame a line of comparison between results obtained after TOPSIS and COPRAS methods (Gauthier Citation2001). In this study, 14 areas within the city were selected based on an analysis of traffic and population projections of the areas and examined under 14 technical, environmental, social, and economic criteria. A QFD analysis with six customer-based factors was also done on the criteria to find the range of suitability of areas for the establishment of an EVCS.
The following section 2 contains further insights into the methodology model applied. Section 3 describes the mathematical calculations, and section 4 gives the results obtained from the preceding section. The results are then validated in section 5, and sections 6 and 7 give the discussions and the conclusions.
2. Materials and methods
Having already established MCDM methodologies as means to tackle decision-making problems involving large numbers of independent or interdependent criteria (Vargas Citation1990; Citation2015; Sanchez-Lozano et al. Citation2013; Charabi and Gastli Citation2011; Hosseini and Sarder Citation2019), 14 criteria were selected for analysing the city of Kolkata for the establishment of EVCS (Hosseini &Sarder, 2019). The criteria selected were from multidimensional aspects under Technical Criteria: Reliability on Power, Availability of Power; Environmental Criteria: Solid Waste Discharge; Air Quality Index; Economic Criteria: Land Availability, Cost of Land, Cost of Construction, Availability of Labour, Maintenance Cost, and Social Criteria: Total Population, Traffic Conditions, Social Acceptance, Employment, and Service Capacity as shown in .Questionnaires were prepared after a detailed literature study along with the latest articles. Criteria and sub-criteria are prepared by a set of people comprising authors and other experts in the same field. The authors are satisfied with the criteria included in the paper for the study. With an increment in the number of criteria or by further diversifying the data, a variation in the results may be obtained. The scope for such flexibility is beyond this study.
Table 2. Criteria considered for evaluation
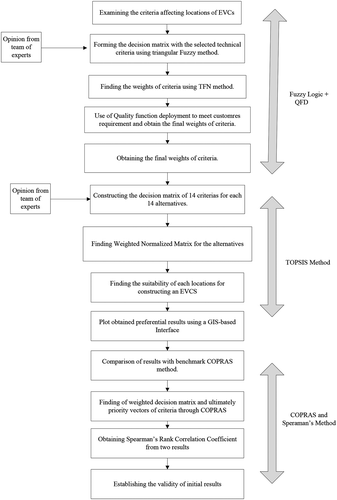
After examining the criteria, the weights of the criteria were found using the Triangular Fuzzy Number (TFN) method followed by a QFD analysis (Shillito Citation1994) on the weights using six criteria: Charging Cost, Charging Time, Charging Capacity, Parking Fee at Facility, Proximity to Residence and Proximity to public transport facilities. After obtaining the weights, the TOPSIS method is applied on 14 locations distributed within the city to get the preference of areas for establishing EVCS. The details of the Fuzzy-based methodology algorithm have been shown in . In the end, the COPRAS method is also applied to weights obtained after QFD analysis as a benchmark MCDM tool, and the validity of initial results is checked by finding Spearman’s Rank Correlation Coefficient (Gauthier Citation2001). The descriptions of the processes involved have been explained in the following sub-sections 2.1, 2.2, and 2.3.
Figure 1. Proposed methodology algorithm
2.1. Fuzzy method to rank the criteria
Initially proposed in 1965 by Zadeh in his ground-breaking work (Zadeh Citation1965), the Fuzzy Set Theory (FST) has found accepting ways in bringing together the unavoidable uncertainty in situations lacking complete pieces of evidence of solid information. FSTs can be thought of as groups of three numbers each, which represent the degree of preference towards a certain criterion or an alternative as given by the decision-maker’s perception (Roy, Roy, and Pradhan Citation2014). Triangular numbers are attributed as a representation of a Fuzzy number, while Gaussian or Trapezoids, in turn, represent Fuzzy intervals. Of course, the shape of the member function depends largely on the study. Although on examination of literature in general, it can be cumulatively concluded that a triangular member function is most widely used due to its lack of complexity. If the shape of the member function is not of utmost priority, like in this study, a triangular member function comes as an easy choice (Sadollah Citation2018). A generalised TFN can be denoted as where
stands for the minimum extreme of the uncertainty poised during the judgement,
stands for the maximum extreme of the uncertainty poised during the judgement and
is a mediocre value between the two extremes (Roy, Roy, and Pradhan Citation2014). In situations involving subjective content of information, the Triangular membership function generally comes into play (Roy, Roy, and Pradhan Citation2014; Liou and Wang Citation1992).
Under normal conditions, mathematics donates a Fuzzy function of membership as, where ’t’ is a real number:
To further carry forward with the calculations, two arbitrary TFNs, and
are considered. The additive and divisive laws associated with the TFNs can be shown as in Equationequations (ii)
(ii)
(ii) and Equation(iii)
(iii)
(iii) :
To associate the linkage of a Fuzzy membership function with classical MCDM techniques, a previously proposed scale of ranking has been used as shown in . For the ranking schemes, the total integral method was taken into consideration (Garg, Kumar, and Garg Citation2018). Thus, considering as TFN, the further processes associated with this technique can be demonstrated as:
Step 1: To begin with, using knowledge from experts in related fields, the decision matrix for the Fuzzy method is formed by implementing three bounded Fuzzy numbers following the ranking scale as shown in . The criteria (in this case, 14 in number) are continuously compared with all the other criteria and the TFN (1, 1, 1) is assigned in the matrix when circumstances involving the comparison of the criteria with itself arise.
Table 3. Scale of ranking for Fuzzy method (Anagnostopoulos, Gratziou, and Vavatsikos Citation2007)
Step 2: After having formulated the matrix for TFN, the Synthetic Extent value for the ithobject is obtained using Equationequation (iv)(iv)
(iv) :
EquationEquation (iv)(iv)
(iv) can be broken down as:
Over time, various studies conducted to simplify or modernise this method have brought certain changes in the normal Equationequation (v(v)
(v) ) to obtain the Synthetic Extent Value. The changed equation can be denoted as:
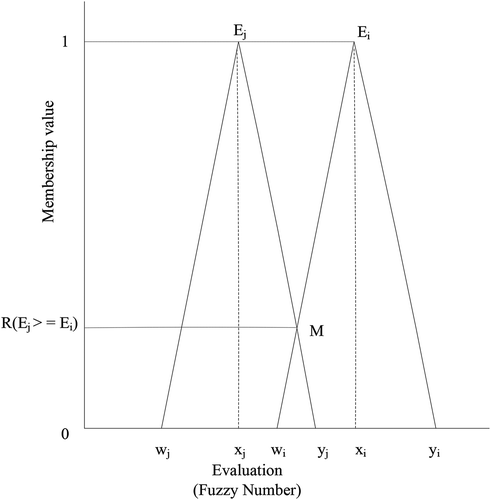
Step 3: Following Step 2, after having obtained the Synthetic Extent Value, comparison methods are employed to find out the degree of possibility of each of the criteria considered:
, otherwise … (vii)
In , M denotes the maximum point of interaction between µEjand µEi.
Figure 2. Graph denoting maximum point of interaction between µEj and µEi.
Step 4: Moving on with the procedure, the following accounts are taken into consideration:
Where
From Equationequation (viii)(viii)
(viii) , the weight vector can be obtained as shown in Equationequation (ix)
(ix)
(ix) :
Step 5: Using modern modifications on the traditional Equationequation (x)(x)
(x) and putting into use the total integral value system, the final Equationequation (xi)
(xi)
(xi) can be obtained as shown below (Roy, Roy, and Pradhan Citation2014).
Where the value of lies in the range from 0 to 1, representing the degree of precedence towards the suitability of the criteria by the decision-maker. The value of the same has been considered as 0.5 (Roy, Roy, and Pradhan Citation2014).
2.2. QFD method
Whenever considering any real-life decision-making problem, it is essential to consider customer requirements. The QFD method was developed to consider challenges associating with design, quality, and increment the chances of a study to cope with customer satisfaction (Sullivan Citation1986; Akao Citation1990). QFD makes use of a matrix known as House of Quality (HOQ) to relate Customer Needs/Requirements (CRs) and Design-associated Requirements (DRs) via engineering characteristics (Onar et al. Citation2016). During its construction, the HOQ considers the matrix showing how the DRs and CRs are related, the corresponding weights marking the importance of each CR and the matrix of correlation for the DRs (Sullivan Citation1986; Akao Citation1990; Onar et al. Citation2016; Prasad Citation1998). Elements of an arbitrary HOQ structure can be discussed as below:
CR: Often denoted as customer needs, attributes, or demanded quality, the foundation step of a HOQ is to identify, clarify and find out the customer needs (Onar et al. Citation2016). CRs represent the customer’s say or the customer’s viewpoint towards the selection of a product.
DR: Known by its various other names of technical attributes, engineering attributes, or substitute quality characteristics, DRs showcase the product necessities associated with the CRs.
Relation Matrix: This matrix depicts the range of affectivity of each DR to its corresponding CR, forming the main body of the HOQ.
DR analysis: From the previous procedural steps, the results are taken and the final weights of the DRs are found.
QFD methodologies revolve around a customer’s viewpoint, helping to bring together verbal data in its corresponding numerical form improving the consensus procedures associated with the research, and can be used for examination of a large range of processes from multidimensional sectors. In this study, the 14 criteria affecting the construction of an EVCS as previously taken for the Fuzzy method were considered as the DRs, while 6 different attributes assessed on a customer viewpoint were taken up as CRs, on which the DRs were used to get new final weights for the 14 DRs. After having obtained the weights of the criteria using the Fuzzy method followed by a QFD analysis (Onar et al. Citation2016), the TOPSIS method, as explained in section 2.3 was carried out.
2.3. TOPSIS method
After having obtained the weights for each of the criteria considered from the methods described in sections 2.1 and 2.2, the application of the TOPSIS method can be demonstrated as:
Step 1: The decision matrix for the TOPSIS method (Srihari, Raval&Shabbiruddin, 2016) is formed. The formulation of this decision matrix was done with the aid of various resourcefully available data as cited in as well as opinion from a team of experts wherever deemed necessary.
Step 2: The elements of the Decision Matrix were normalised to obtain the Normalised Decision Matrix. Normalisation helps in the distribution of equal preference to the criteria during the calculation. This normalisation was done using Equationequation (xii)(xii)
(xii) :
Step 3: Each element of the Normalised Matrix was then multiplied by the weights of the corresponding criteria which had been previously obtained from the TFN and the QFD methods. The matrix now formed is called the Weighted Normalised Matrix.
Step 4: Now the values of M* and M−are obtained using Equationequation (xiii(a(xiii-a)
(xiii-a) ,Equationb
(xiii-b)
(xiii-b) )) as shown below (Srihari, Raval, and Shabbiruddin Citation2016).
Step 5: This is followed by finding the separation measures using equations (xiv(a,b)):
Step 6: The final step of getting the relative closeness to the ideal solution is found out as:
3. Calculations
Using the already discussed methodology technique, the calculation process was carried out. The first step involved the forming of the comparison matrix for the 14 criteria to be applied in the Fuzzy method. A team comprising three experts: a fellow researcher (E1), a representative from the automobile industry (E2), and an official from the Kolkata Municipal Corporation (E3) answered a series of questionnaires prepared by the authors. The solution to the questionnaires as provided by the team of experts was used to formulate the decision matrix.
The opinions as given by expert E1 are shown in , the opinions of expert E2 have been represented in and expert E3’s opinions find a place in .
Table 4. Decision matrix for Fuzzy method as opined by E1
Table 5. Decision matrix for Fuzzy method as opined by E2
Table 6. Decision matrix for Fuzzy method as opined by E3
Having obtained a numerical comparative analysis of the criteria from , and , further steps for the Fuzzy method were carried out and following equations Equation(iv)(iv)
(iv) , Equation(v)
(v)
(v) , Equation(vi)
(vi)
(vi) , (vii), Equation(viii)
(viii)
(viii) , Equation(ix)
(ix)
(ix) , Equation(x)
(x)
(x) and Equation(xi)
(xi)
(xi) , the initial weights for each of the criteria were obtained. These weights were further modified after performing a QFD analysis on them.
After the application of the Fuzzy method, the normalised weights of the criteria were found out as:
C1 = 0.098311,C2 = 0.110700,C3 = 0.109197,C4 = 0.097747,C5 = 0.095746,
C6 = 0.087220,C7 = 0.080279,C8 = 0.080587,C9 = 0.075538,C10 = 0.053953, C11 = 0.036058,C12 = 0.046513,C13 = 0.022450,C14 = 0.005702.
For the QFD analysis, six criteria were selected as:
Charging Cost (Q1), Charging Time (Q2), Charging Capacity (Q3), Parking Fee at Facility (Q4), Proximity to Residence (Q5), and Proximity to public transport facilities (Q6).
The ranking factors as obtained from the Fuzzy method were then correlated with the factors of QFD to formulate the QFD matrix as shown in . In the table, the ranking can be linguistically converted as:
Table 7. QFD matrix
9 = Very strong relation, 7 = strong relation, 5 = moderately strong relation, 3 = moderate relation, 1 = weak relation and 0 = no relation between the criteria and the QFD factors. The factors were ranked at times on consultation with the team of experts and places at the discretion of the authors.
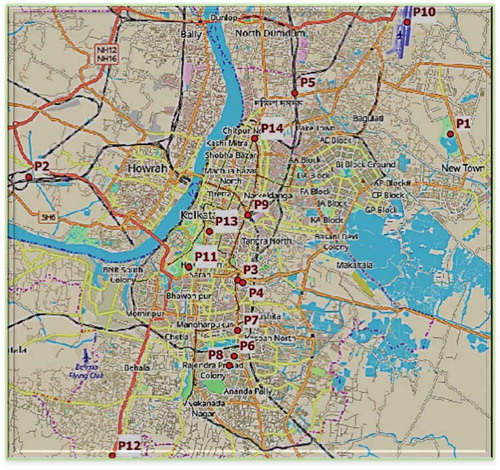
After having finally obtained the weights, 14 different sites from within the city of Kolkata were selected for analysis. The selection of the sites was done on a basis of their population, their overall preference in terms of residence, their popularity within the city, traffic availability, and other such defining factors at the discretion of the authors of this work. The selected regions have been plotted in an open street map of the city using a Q-GIS-based interface with the Global Positioning System (GPS) associated co-ordinates for the selected places as shown in . Considering these areas, the TOPSIS method was proceeded with. For the TOPSIS method, at first, the decision matrix was formulated with data from references as cited in and with the advice of experts wherever discrete data were not available. The decision matrix for the TOPSIS method has been shown in .
Table 8. Initial decision matrix for TOPSIS method
Figure 3. Selected locations for analysis (Extracted using Q-GIS)
The elements of the above matrix were then normalised using the equations for the TOPSIS method, and multiplied by the corresponding criteria weights to get the Weighted Normalised Matrix as shown in .
Table 9. Weighted normalised matrix for TOPSIS method
After completion of the TOPSIS method, the results for the suitability index for each location were obtained, which has been discussed in the ‘Results and Discussions’ section.
4. Results
Evidently from the resultant graph in , the ranking of the areas considered in descending order of preference would be:
Figure 4. Graphical representation of results after TOPSIS method
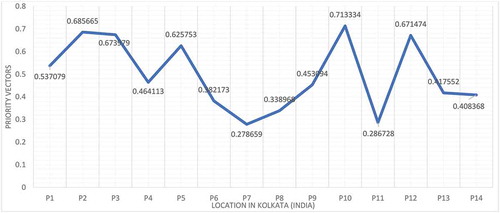
P10> P2> P3> P12> P5> P1> P4> P9> P13> P14> P6> P8> P11> P7
The preference of the areas above concerning a fruitful installation of an EVCS decreases on moving from left to right. The areas with a negotiable well ranking of all the 14 criteria considered in this study secured a higher rank in the preference scale. The top five places in the sequence could be considered as the most preferable hotspots for constructing EVCSs. The topmost place in terms of real-time location is Netaji Subhash Chandra Bose (NSCB) International Airport area. Being the only international airport in the eastern region of the country, the rush of traffic and demand for vehicles, public cars, including EVs is tremendous. Kolkata being a cosmopolitan popular for its heritage, the number of visitors both domestically and internationally in the city is pretty notable. Owing to the demand, the foot count, and the requirement of public transportation, and establishment of an EVCS in this location would deem profitable for the investors. Followed by the Airport, which is a few kilometres afar the heart of the city, comes the Quest Mall area in the ranking. Besides being a top-notch area to reside in and in many instances EVs being a commodity of the elite, the high preferential index of the area is agreeing to the circumstances. The Quest Mall also has the position of owning one of the largest car parking facilities within the city, and with its large footfall every day, the mall premises see a twenty-four-hour rush of traffic, EVs used for public transport being a large fraction of them.
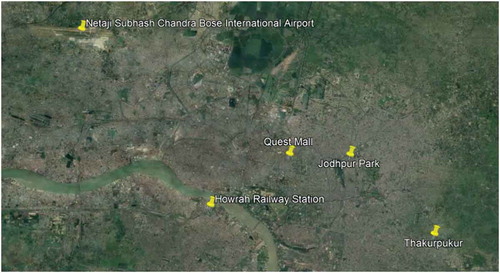
The third in the line of hierarchy would be the Thakurpukur area in the city. The Thakurpukur area has already been marked by the Kolkata Traffic Police as the area with the maximum traffic rush. At peak hours, long traffic jams are inevitable, such as the presence of traffic. Hence, due to the enormously high availability of cars (including EVs), an EVCS would not run very unprofitably in this zone. Howrah Railway Station ranked next in the schema. Considered one of the busiest stations in the country with a daily average footfall of over 10.5 lakhs, this station is the heart of the city’s rushing traffic. The campus is surrounded by streams of stands for buses and cars, making it another hotspot for constructing an EVCS. In the final of the top five places came the Jodhpur Park region, another fancy locality within Kolkata, known for its up-class residents. For a personally owned EV, the houses of Jodhpur Park are the most probable destinations, given the access of its general citizens to a more polished lifestyle and hence an EVCS in this region would not run unprofitably at all. The other areas considered for the study were different zones within the city, as has already been marked in using their coordinates. , obtained from Q-GIS, highlights the top five most preferable areas for an EVCS construction as has been established by this study.
Figure 5. Resultant top areas preferred for construction of EVCS (Extracted using Q-GIS from Google satellite images of Kolkata)
5. Comparison of results
To ensure that the results obtained from the Fuzzy-QFD-TOPSIS method as designed by the authors were complying with a correct solution, they were compared with the same obtained from another benchmark MCDM method, COPRAS method (Ghose et al. Citation2019b). The COPRAS method is another established technique implemented in the MCDM genre. The initial decision matrix for this method was the same as one used for TOPSIS (). COPRAS method follows a different approach to find out the normalised elements, followed by the weighted matrix. The intricacies of this method can be found in numerous instances of usage in the research world (Ghose et al. Citation2019b). The normalised matrix elements can be found as shown in Equationequation (xvi)(xvi)
(xvi) :
where gives an element of initial decision matrix and
is the corresponding element of the normalised matrix. This is followed by forming a weighted normalised matrix by multiplying each normalised element with their corresponding weights as obtained after the QFD method, as shown in .
Table 10. Weighted normalised matrix for COPRAS method
Further procedures with COPRAS would include finding beneficiary and non-beneficiary values denoted as and
respectively (Ghose et al. Citation2019b) to finally obtain the Relative Significance Value (
), given as in Equationequation (xvii)
(xvii)
(xvii) :
Then, the fitness degree is obtained as in Equationequation (xviii)(xviii)
(xviii) :
After obtaining the priority vector values, also known as the Degree of Fitness through the COPRAS method, to find the closeness of results obtained through two methods, Spearman’s Rank Correlation Coefficient (Gauthier Citation2001) was found. Spearman’s Coefficient is an important tool when analysing a comparison between TOPSIS and COPRAS methods. The value of this coefficient adjudges the relation between the results from the two methods based on the following scale:
A Spearman’s coefficient value of 0.00 to 0.19 can be attributed to being a very weak relation, 0.20 to 0.39 a weak relation, 0.40 to 0.59 as a moderate relation, 0.60 to 0.79 as a strong relation, and anything above that as a very strong relationship between the results (Gauthier Citation2001).
The value of the coefficient () is given as shown in Equationequation (xix)
(xix)
(xix) below:
where n = number of parameters, which here is 14 and D is found as shown in .
Table 11. Calculations for Spearman’s constant
On proceeding with the calculation, the value of was found to be 0.993865, which showed a very strong relationship between the results, asserting that the initial results of the TOPSIS method were accurate. This reinforces the top five zones which are shown in to be the most suitable places for construction of an EVCS.
6. Discussions
Quite clearly, with an increment in the number of criteria taken into consideration or even by further diversifying and updating the data, a variation in the results may be obtained. However, the scope for such flexibility is beyond this study. The inclusion of the zones selected for this study was also done much on theoretical grounds discretely on the decision of the authors, and a more stable solid structure for the selection procedures might also result in a more robust result. This work aims at bridging the research gap on many grounds especially in a city like Kolkata which provides a hindrance to the path of completely electrifying the vehicle industry by replacing pollution-causing fuel cars. As it has been mentioned throughout the work, Kolkata serves immensely in potential when it comes to marketising a product like an EV. Only a realisation by the public in general towards the advantages of using an EV over a fuel car and bring in manifold changes in the automobile sector, all of it aiming towards a cumulative sustainable development of the city, and in fact society at large.
The five top suitable locations for the construction of an EVCS have already been listed in the above section. However, a simple theoretical analysis of the locations without any real-life implications of the same would not have any substantial effect on the environmental conditions of the city. This work aims to support the West Bengal government’s initiatives in the EV sector by trying to bridge the gap between the research and industrial worlds. The true motive behind research only lies in its implementation in the practical world. The authors do hope that their work finds a way into the authorities concerned about the same within the government of West Bengal. In many cases, concrete data were unavailable for the calculations, and instead, they had to be presumed from neighbouring values. If a work is done in collaboration with the concerned sector of the government of the state along with scholars from a research background, such hindrances may be overcome, and it may result in a more practical result of the problem. This study, however, does not extend its scope to such depths.
7. Conclusion
For this study, 14 initial criteria from multiple grounds were taken and ranked using the Fuzzy method making use of Triangular member functions to get their preferential weights showing their impact in the selection process. The obtained weights were then evaluated on customer requirement grounds using a QFD analysis by ranking them on six factors. The criteria for the QFD analysis had their significance on grounds of customer money, customer time, customer comfort, and customer accessibility to the site location. Any modern-day industry has the entire reliability of its profitable running on the acceptance by its customers. Without customers, the existence of a market to sell products is completely futile. Hence, it is of utmost necessity to include an index to showcase an industrial study based on a customer’s perspective.
The Fuzzy method for evaluation of data has its advantages: in many cases, for the criteria taken up, the availability of solid concrete data is difficult. The fuzzy methodology allows the relaxation of presuming appropriate data based on neighbouring counterparts of the same for these cases. Usage of just classical MCDM mechanisms would not have allowed such flexibility when it came to the assumption of data, but a Fuzzy-based hybrid mechanism makes space for such robustness in the calculation despite the inclusion of assumptions. The ranking procedure of the data is also much diversified in this process as instead of a single solid number, a combination in form of a set of numbers in a pre-defined order of hierarchy could be used. This too allows for a larger scope to include individual preferences in between solid selection analysis. Diversifying the scale of preference adds up to the more practicability of the results obtained.
The evaluated results for the preference of construction on EVCS which were obtained by applying the TOPSIS method as an MCDM tool were then plotted on a map of the city using their coordinates and a Q-GIS-based interface. The various incentives taken up by the government of this city to include the development of a sustainable environment are notable and the introduction of EVs as an eco-friendly alternative to pollution-causing fuel cars is also a large part of this project. The effectiveness of this study, if properly utilised in such initiatives, can go a long way in aiding the government to achieve their goals in the long run. The government of the state should vent their focus on considering the suggested locations for the EVCS that the authors have brought out through this paper for their future endeavours in the same line. The adaptability of the proposed model allows for the inclusion of more criteria that the corresponding officials may deem necessary to further diversify the results in a practical realm. It is also in the interest of the government that EVs should be portrayed in the light of favour before the citizens and EVCSs can be used as a platform to achieve the same. Construction of a good number of EVCSs in the city premises will surely aid in the process by advertising the government’s ventures and long-run motives to completely drift to EVs from traditional fuel cars.
As discussed earlier, the true success of this work lies in its practical implementation. To carry forward with this kind of research, maybe a collaborative project with the government along with the research world could be of many effects. Many times, actual field situations differ a lot from the available data. The presence of a government-based support system can aid in the inclusion of such exceptions within this work too. As a future extension of this work, one can consider the inclusion of a broader range of criteria from various aspects, along with taking in more robust, accurate data values to get better, more practical results. Even the more complex features of the Q-GIS software can be explored in an attempt to present an extensive progression on this work.
Disclosure statement
We wish to confirm that there are no known conflicts of interest associated with this publication and there has been no significant financial support for this work that could have influenced its outcome.
Correction Statement
This article has been republished with minor changes. These changes do not impact the academic content of the article.
Additional information
Notes on contributors
Sudeep Pradhan
Sudeep Pradhan is affiliated to the Department of Electrical and Electronics Engineering, Sikkim Manipal Institute of Technology, Sikkim Manipal University, Sikkim, India. He has been associated with several research activities in the college especially in the domain of renewable energy and has co-authored several papers on the same as well. He has also presented his works in research conferences of both national and international stature.
Dipanjan Ghose
Dipanjan Ghose is affiliated to QNu Labs Private Limited, Bangalore, India as a Software Engineer. He was a student at the Department of Electrical and Electronics Engineering, Sikkim Manipal University, India, where he had been associated with several research activities in the college especially in the domain of renewable energy and co-authored several papers on the same as well. He has also presented his works in research conferences of both national and international stature.
Shabbiruddin
Dr. Shabbiruddin received his Bachelor of Engineering degree in Electrical & Electronics Engineering from Visvesvaraya Technological University, India in 2009. He has received his Master of Technology degree in Power Electronics from Sikkim Manipal University, India in 2011. He was awarded Ph.D from Sikkim Manipal University, India in 2017. He is working as Assistant Professor (SG) in Electrical & Electronics Engineering department at Sikkim Manipal Institute of Technology, Sikkim, India. He has published several research articles and conference proceedings of both national and international stature.
References
- Akao, Y. 1990. Quality Function Deployment: Integrating Customer Requirements into Product Design. Taylor and Francis.
- Anagnostopoulos, K. P., M. Gratziou, and A. P. Vavatsikos. 2007. “Using the Fuzzy Analytic Hierarchy Process for Selecting Wastewater Facilities at Prefecture Level.” European Water 19: 15–24.
- Badang, D. A. Q., C. F. Sarip, and A. P. Tahud (2018). Geographic Information System (GIS) and Multicriteria Decision Making (MCDM) for Optimal Selection of Hydropower Location in Rogongon, Iligan City, International Conference on Humanoid, Nanotechnolgy, Information Technology, Communication and Control, Environment and Management, Philippines.
- Banerjee, S., and M. Majumder (2016). Application of AHP for Selection of Source for Micro-grid, International Conference on Energy Efficient Technologies for Sustainability, Nagercoil, India.
- Castillo, C. P., F. B. Silva, and C. Lavalle. 2016. “An Assessment of the Regional Potential for Solar Power Generation in EU-28.” Energy Policy 88: 86–99. doi:10.1016/j.enpol.2015.10.004.
- Charabi, Y., and A. Gastli. 2011. “PV Site Suitability Analysis Using GIS-based Spatial Fuzzy Multi-criteria Evaluation.” Renewable Energy 36 (9): 2554–2561. doi:10.1016/j.renene.2010.10.037.
- Chattopadhyay, S., A. Dutta, and S. Ray. 2009. “Municipal Solid Waste Management in Kolkata, India: A Review.” Waste Management 29 (4): 1449–1458. doi:10.1016/j.wasman.2008.08.030.
- Csonka, B., and C. Csiszár. 2017. “Determination of Charging Infrastructure Location for Electric Vehicles.” Transportation Research Procedia 27: 768–777. doi:10.1016/j.trpro.2017.12.115.
- Das, S., and B. K. Bhattacharya. 2014. “Estimation of Municipal Solid Waste Generation and Future Trends in Greater Metropolitan Regions of Kolkata, India.” Journal of Industrial Engineering and Management Innovation 1 (1): 31–38. doi:10.2991/jiemi.2014.1.1.3.
- Fazelpour, F., E. Roohi, and A. Tajeddin (2017). Towards Efficient Implementation of Solar Plants: A Priority Analysis through Multi-criteria Decision Approach, IEEE International Conference on Environment and Electrical Engineering and IEEE Industrial and Commercial Power Systems Eurpoe, Milan, Italy.
- Fredriksson, H., M. Dahl, and J. Holmgren. 2019. “Optimal Placement of Charging Stations for Electric Vehicles in Large-scale Transportation Networks.” Procedia Computer Science 160: 77–84. doi:10.1016/j.procs.2019.09.446.
- Garg, R., R. Kumar, and S. Garg. 2018. “MADM-based Parametric Selection and Ranking of E-Learning Websites Using Fuzzy COPRAS.” IEEE Transactions on Education 1–8. doi:10.1109/TE.2018.2814611.
- Gauthier, T. D. 2001. “Detecting Trends Using Spearman’s Rand Correlation Coefficient.” Environmental Forensics 2 (4): 359–362. doi:10.1006/enfo.2001.0061.
- Ghose, D., S. Naskar, Shabbiruddin, and A. K. Roy. 2019a. “An Open Source Software - Q-GIS Based Analysis for Solar Potential of Sikkim (India).” International Journal of Open Source Software and Processes 10 (1): 49–68. doi:10.4018/IJOSSP.2019010104.
- Ghose, D., S. Pradhan, P. Tamuli, and Shabbiruddin. 2019b. “Optimal Material for Solar Electric Vehicle Application Using an Integrated Fuzzy-COPRAS Model.” Energy Sources, Part A: Recovery, Utilization, and Environmental Effects 1–20. Taylor and Francis. doi:10.1080/15567036.2019.1668879.
- González, J., R. Alvaro, C. Gamallo, M. Fuentes, J. Fraile-Ardanuy, L. Knapen, and D. Janssens. 2014. “Determining Electric Vehicle Charging Point Locations Considering Drivers’ Daily Activities.” Procedia Computer Science 32: 647–654. doi:10.1016/j.procs.2014.05.472.
- Govindan, K., K. M. Shankar, and D. Kannan. 2016. “Sustainable Material Selection for Construction Industry - A Hybrid Multi Criteria Decision Making Approach.” Renewable and Sustainable Energy Reviews 55: 1274–1288. doi:10.1016/j.rser.2015.07.100.
- Guler, D., and T. Yomralioglu. 2020. “Suitable Location Selection for the Electric Vehicle Fast Charging Station with AHP and Fuzzy AHP Methods Using GIS.” Annals of GIS 26 (2): 169–189. doi:10.1080/19475683.2020.1737226.
- Hosseini, S., and M. D. Sarder. 2019. “Development of a Bayesian Network Model for Optimal Site Selection of Electric Vehicle Charging Station.” Electrical Power and Energy Systems 105: 110–122. doi:10.1016/j.ijepes.2018.08.011.
- Huang, Y., and K. M. Kockelman. 2020. “Electric Vehicle Charging Station Locations: Elastic Demand, Station Congestion, and Network Equilibrium.” Transportation Research Part D: Transport and Environment 78: 102179. doi:10.1016/j.trd.2019.11.008.
- Karaşan, A., İ. Kaya, and M. Erdoğan. 2020. “Location Selection of Electric Vehicles Charging Stations by Using a Fuzzy MCDM Method: A Case Study in Turkey.” Neural Computing and Applications 32 (2020): 4553–4574. doi:10.1007/s00521-018-3752-2.
- Kaya, O., A. Tortum, K. D. Alemdar, and M. Y. Çodur. 2020. “Site Selection for EVCS in Istanbul by GIS and Multi-criteria Decision-making.” Transportation Research Part D: Transport and Environment 80: 102271. doi:10.1016/j.trd.2020.102271.
- Liou, T. S., and M. J. Wang. 1992. “Ranking Fuzzy Numbers with Integral Value.” Fuzzy Sets and Systems 50: 247–255. doi:10.1016/0165-0114(92)90223-Q.
- Liu, H., M. Yang, M. Zhou, and G. Tian. 2018. “An Integrated Multi-Criteria Decision-Making Approach to Location Planning of Electric Vehicle Charging Stations.” IEEE Transactions on Intelligent Transportation Systems 20 (1): 362–373. doi:10.1109/TITS.2018.2815680.
- Mayyas, A., Q. Shen, A. Mayyas, M. abdelhamid, D. Shan, A. Qattawi, M. Omar, et al. 2011. “Using Quality Function Deployment and Analytical Hierarchy Process for Material Selection of Body-in-white”. Materials & Design 32: 2771–2782. doi: 10.1016/j.matdes.2011.01.001.
- Onar, S. C., G. Buyukozkan, B. Oztaysi, and C. Kahraman. 2016. “A New Hesitant Fuzzy QFD Approach: An Application to Computer Workstation Selection.” Applied Soft Computing 46: 1–16. doi:10.1016/j.asoc.2016.04.023.
- Prasad, B. 1998. “Review of QFD and Related Deployment Techniques.” Journal of Manufacturing Systems 17 (3): 221–234. doi:10.1016/S0278-6125(98)80063-0.
- “Report Chapter V: Land Prices in Kolkata.” http://shodhganga.inflibnet.ac.in/bitstream/10603/157254/12/12_chapter%205.pdf
- Report: Annual Review. 2017. “Kolkata Traffic Police, Government of West Bengal.” (2017). http://kolkatatrafficpolice.gov.in/KolkataPoliceReview.pdf
- Report: Centre for Science and Environment. (2016, January). 2016. https://www.cseindia.org/kolkata-residents-breathe-in-air-which-has-3-5-times-higher-pollution-levels-than-the-ambient-level-that-is-already-several-times-higher-than-the-permissible-limit-action-must-gather-momentum-says-cses-kolkata-study-6250
- Report: Database on Labour and Employment Statistics of West Bengal-2014. “Department of Statistics and Programme Implementation, Government of West Bengal (2015).” https://www.wbpspm.gov.in/SiteFiles/Publications/12_18052017130924.pdf
- Report: Kolkata City Census. 2011. “Data.” https://www.census2011.co.in/census/city/215-kolkata.html
- Roy, M. K., A. Roy, and B. B. Pradhan. 2014. Non-traditional Machining Process Selection Using Integrated Fuzzy AHP and QFD Techniques: A Customer Perspective, Production and Manufacturing Research 2 (1): 530–549.
- Sadollah, A. 2018. “Introductory Chapter: Which Membership Function Is Appropriate in Fuzzy System.” In Fuzzy Logic Based in Optimization Methods and Control Systems and Its Applications. Intech-Open.
- Sanchez-Lozano, J. M., J. Teruel-Solano, P. L. Soto-Elvira, and M. S. García-Cascales. 2013. “Geographical Information Systems (GIS) and Multi-Criteria Decision Making (MCDM) Methods for the Evaluation of Solar Farms Locations: Case Study in South-eastern Spain.” Renewable and Sustainable Energy Reviews 24: 544–556. doi:10.1016/j.rser.2013.03.019.
- Shahraki, N., H. Cai, M. Turkay, and M. Xu. 2015. “Optimal Locations of Electric Public Charging Stations Using Real World Vehicle Travel Patterns.” Transportation Research Part D: Transport and Environment 41: 165–176. doi:10.1016/j.trd.2015.09.011.
- Shillito, M. L. 1994. Advanced QFD- Linking Technology to Market and Company Needs. New York: Wiley.
- Srihari, K., P. Raval, and Shabbiruddin (2016). Selection of an Electric Motor for an Equivalent Internal Combustion Engine by TOPSIS Method, Springer International Conference on Emerging Trends and Advances in Electrical Engineering and Renewable Energy, ETAEERE 2016 Proceedings Advances in Power Systems and Energy Management, Lecture Notes in Electrical Engineering, Vol. 436. Springer, Singapore.
- Sullivan, L. P. (1986). “Quality Function Deployment: A System to Assure that Customer Needs Drive the Product Design and Production Process.” Quality Programme, pp. 39–50.
- Tahri, M., M. Hakdaoui, and M. Maanan. (2015). “The Evaluation of Solar Farm Location Supplying Geographic Information System and Multi-Criteria Decision-Making Methods: Case Study in Southern Morocco.” Renew. Sustain. Energy Rev. 51.
- Vargas, L. G. 1990. “An Overview of the Analytic Hierarchy Process and Its Applications.” European Journal of Operational Research 48 (1): 2–8. doi:10.1016/0377-2217(90)90056-H.
- Zadeh, L. A. 1965. “Fuzzy Sets.” Information and Control 8 (3): 338–353. doi:10.1016/S0019-9958(65)90241-X.