
 ?Mathematical formulae have been encoded as MathML and are displayed in this HTML version using MathJax in order to improve their display. Uncheck the box to turn MathJax off. This feature requires Javascript. Click on a formula to zoom.
ABSTRACT
The unplanned and rapid growth of urbanisation and energy demand leads to environmental degradation, social inequalities, and economic instability. These global problems have forced society to rethink infrastructure development to evolve the concept of sustainable development in the construction industry. Technological advances have always been the cornerstone in mitigating the unavoidable side effects of development. To rejuvenate ideas of Reuse, Recycle, Reduce, Renew, and Regenerate (5 R’s) into implementable solutions, the technological dimension is necessary to form a Quadruple Bottom line (QBL) approach i.e., Social, Environmental, Economic and Technological (SEET) for achieving sustainable construction. To tackle and monitor the enormous changes in urban transformation in developing countries, it is important to assess the sustainability of building performance. The objective of the study is to establish the interdependency between criteria and indicators for assessing building sustainability. The findings reveal that the criteria Materials & Waste Management (MW) and Energy Efficiency (EE) secured the highest weight among the eight criteria in the Technological aspect. The study facilitates to understand the interrelationship between the criteria and indicators and will be useful for the development of a new sustainable building assessment tool.
1. Introduction
Building construction uses land, energy, water & natural resources, and produces waste, releases hazardous gases causing ecological imbalance (Du Plessis Citation2007). By incorporating sustainability principles in the construction sector, buildings can develop the capacity to curtail Green House Gas (GHG) emissions and reduce carbon footprint (Jain, Mital, and Syal Citation2013; Kylili and Fokaides Citation2017). Buildings create negative impacts during the pre-construction, construction phase, and while in the operation and maintenance (post-construction) phase. Compared to developed countries, developing countries have got a new trend of accepting green building guidelines (Mori and Christodoulou Citation2012; Du Plessis, Chrisna Citation2002; Suchith, Anand Raj, and Rathish Kumar Citation2018). Every country is in the process of developing its rating system or guidelines to achieve an overall sustainable built environment. For example, prominent assessment tools like the Leadership in Energy and Environmental Design (LEED) scheme in the US, and the Comprehensive Assessment System for Building Environmental Efficiency (CASBEE) in Japan. Based on the LEED revision, India introduced the Indian Green Building Council (IGBC) assessment method in the year 2000. Subsequently, The Energy and Resources Institute (TERI) has developed an Indian national green building rating system, Green Rating for Integrated Habitat Assessment (GRIHA) in 2007 (Vyas and Jha Citation2016). The Building Research Establishment’s Environment Assessment Method (BREEAM) in Australia also uses the country-specific format of Norway, Sweden, Spain, and the Netherlands.
The assessment method developed created for one nation or region might not apply to others, because, several factors may prevent the transfer of currently available environment assessment tools to other nations (Suchith, Anand Raj, and Rathish Kumar Citation2018). Some of these factors include regional differences, climatic conditions, geographical features, resource availability, and level of public awareness(Barbosa, Gomes, and Almeida Citation2017; Sev Citation2011). This emphasises sustainable development and economic growth without compromising environmental protection, social needs, and technological features (Liu and Lin Citation2016). Also, an inadequate understanding of the interdependency among criteria will further compound the difficulty to achieve sustainability (Ugwu and Haupt Citation2007).
1.1. Need for sustainability in indian built environment
With the focus on urban rapid transformation integrated approaches like Life Cycle Assessment (LCA), durability, serviceability, etc, are the need of the hour to shift the conventional built environment to a sustainable built environment (Tathagat and Dod Citation2015). From a case study conducted by Gesellschaft für Internationale Zusammenarbeit (GIZ) and the Overseas Development Institute (ODI), under the umbrella of the Economic Policy Forum (EPF) supported by the German Ministry for Economic Cooperation and Development (BMZ) on ‘Promoting sustainability and inclusive growth in emerging economics: Green Buildings’, it was acknowledged that developing countries need further action and development in three broad areas: 1) Policy and regulation: strengthening the regulatory authorities and reinforcing the existing laws towards sustainability. 2) Capacity and skills: Lack of technical skill for the construction process, and 3) Awareness and understanding of benefits: Lack of awareness on sustainability/green practices and their benefits (Economic Policy Forum Citation2014).
1.2 Quadruple Bottom Line (QBL) approach
A building construction project is considered sustainable, only when all the dimensions of sustainability are taken into account (Kaivo-Oja et al. Citation2014). Most of the issues of sustainability are interrelated in existing methods, and the focus is mainly given to environmental aspects (Mahmoud, Zayed, and Fahmy Citation2019; Xu, Wang, and Tao Citation2019). This specifies disregard for the economic, social, institutional, cultural, and technological aspects of sustainability, which could further lead to ecological imbalance and thereby, miss the real goal of sustainable development. For example, though GRIHA has attempted to make green building assessment tools, it was not able to fully incorporate the social, economic, and cultural elements in the sustainability assessment criteria (Ubarte and Kaplinski Citation2016). The existing building assessment tools are hence, limited to unidimensional sustainability. Some of the assessments were based on a Triple Bottom Line (TBL) approach i.e., Environment, Social, and Economic dimensions (Jiang et al. Citation2018; Raouf and Al-ghamdi Citation2019). It was also observed that the building assessment criteria developed originally suit only a specific region of importance. According to Alyami et al (Citation2015), in Saudi Arabia socio-cultural, economic, and general management aspects are included in the existing assessment tool. Similarly, Ding (Citation2014), opines that the building assessment method has a variety of criteria, related to sustainable development.
1.3 Significance of technological criteria
For better use of resources, effectively and efficiently technological innovations play a vital role (ALwaer and Clements-Croome Citation2010; Cancino et al. Citation2015). To re-design, create and adapt new and innovative technologies by manufacturing and production firms it is significant to diffuse environmentally sound, economically viable, and socially feasible technologies. The challenges lie in developing sustainable growth by techniques and technologies and encourage different methodologies, approaches, frameworks, models, policies, and guidelines (Lazar and Chithra Citation2020). The recent technological developments in the field of infrastructure development made to rethink the efficiency of machinery and their implications towards the environment. For example, clean and green technologies for eco-innovation made changes in institutional, organisational, and managerial aspects in existing manufacturing and production units by reducing CO2 emissions and waste production for achieving sustainability (Darko, Amos, Albert Ping Chuen Chan, Ernest Effah Ameyaw, Bao-Jie He, and Ayokunle Olubunmi Olanipekun Citation2017; Salazar Citation2013). Further, enables to increase of the business capacity with reduced impacts and adjustments in the surrounding environment. In developing countries like India, population, urbanisation, weak governance, improper standards, uncertain economic, environmental degradation, etc., are the major challenges (Berardi Citation2015; Singh and Joshi Citation2015). Considering technological aspect along with the environmental, social, and economic shall provide the feasible solutions for the development of smart cities and communities. In addition to this, the innovation and technological developments mitigate urban problems from time to time and enhance the quality of human life.
An in-depth study of the literature indicated that the technological component’s significance could be enhanced by incorporating recent technological advances in sustainability in the construction sector. Technological advances have always been the cornerstone in mitigating the unavoidable side-effects of development and in surpassing the limits/constraints dictated by the other indicators of sustainability. For instance, a shift from working stress method to limit state method in the design philosophy led to thinner and more economical sections without compromising the safety and durability, an introduction of steel columns and steel beams in lieu of stone walls as structural materials made the towering skyscrapers possible (Ruparathna, Hewage, and Sadiq Citation2016). The technological dimension can be incorporated by rejuvenating ideas of Reuse, Recycle, Reduce, Renew, and Regenerate (5 R’s) into implementable solutions to the existing TBL to achieve sustainable construction (Reddy et al., Citation2018). In other words, various methods and approaches are required for benchmarking the threshold values and targets to transform a theoretical concept into practical implementation. Secondly, policies and guidelines for proper governance are needed (Dangwal. Citation2016). For example, converting ‘ waste’ to ‘energy’; ‘replacing raw material’ or ‘conventional materials’ with ‘by-products’ or ‘waste materials’ generating from industry support in achieving a circular economy and biodiversity in the construction supply chain. Finally, it is essential to recognise the advantages of supporting techniques and technologies for achieving sustainable harmony in the construction industry. Thus, technological aspects provide required technical capacity and knowledge base for the stakeholders of the construction industry in terms of use of hard technology, changes in industrial processes, material efficiency, waste management, energy efficiency, infrastructural design solutions, use of soft technologies for decision making, evaluation and monitoring, strengthening regulations, knowledge base systems, and data capturing, etc. Most of the assessment tools provide equal weights to the indicators. In typical developing countries like India, the significance of these indicators may vary with location to regional variations, cultural, topographical, climatic conditions, and availability of localised resources. The present study is in the process of development building assessment tools, which can incorporate the weights of indicators and their related criteria of the above-said variations and standardise them to evaluate the building performance considering a particular region.
1.3.1 Importance of multi criteria decision making
Based on the comprehensive literature review undertaken on indicators and criteria, it is observed that lack of interrelationship between indicators and criteria results in differential solution and uncoordinated actions, necessitating to quantify the interrelationship among and between indicators and criteria. For instance, Bautista et al. (Citation2016) developed a hierarchy model considering dimensions, criteria, indicators but fail to assess the interdependency and sensitivity among them. Jiang et al. (Citation2018) integrated social, economic, and environmental dimensions using Principal Component Analysis (PCA) to measure the corporate sustainable performance, however, this study neglects the interdependency between dimensions and factors affecting them. However, some of the studies derived the interrelationship between the influencing factors and few studies demonstrated the relative importance of one factor over the another considering the hierarchy levels. Since, sustainability is measured considering qualitative and qualtitative aspects it becomes difficult to come to a consensus decision. Most of the existing building assessment tools considered an equal weighting approach and some of them considered a differential weighting approach in evaluating the building score (Ameen and Mourshed Citation2019). Understanding urban sustainability can be viewed from different perspective domains like professionals from designers, contractors, architects, consultants, engineers and suppliers, these perceptions could focus on limited or specific aspects of sustainability ignoring others which result in a comprehensive understanding of the interdependency and interrelationship among and between indicators and criteria (Ju, Ning, and Pan Citation2016),opine that there exists no such assessment tool which qualifies complex relationships among various criteria/indicators. By measuring and analysing these interdependencies, the performance of each criterion can influence or be influenced by other criteria or indicators. Assessment of building performance requires suitable criteria and indicators and active participation of experts from various domains of construction industry to consider real-time conditions of a specific region. This involves multiple perceptions from decision makers considering multiple dimensions and criteria for achieving a single goal. For a framework to be well developed, a reliable weighting structure has to be proposed to accept and institutionalize the importance of a wide variety of sustainable construction concerns. Most of these methods as said earlier are obstructed by components such as climatic circumstances, regional and geographic differences, culture, socio-economic elements. For this reason, every nation/area needs their own strategical plan to assess whether the construction industry is implementing appropriate sustainability practices.
Multi-Criteria Decision Making (MCDM) refers to making decisions when multiple and conflicting criteria are involved. MCDM methods are being applied in different areas of engineering, science, and human activities (Durdyev and Zavadskas Citation2018). It allows several decision-makers to resolve the complex problem involved with conflicting and divergent criteria based on subjective judgements. These methods can provide a solution to obtain the weights for criteria, including, Analytical Hierarchy Process (AHP) (Yoram Wind Citation1980), Preference Ranking Organisation Method for Enrichment Evaluation (PROMOTHEE) (Brussel Citation1986), Elimination and choice corresponding to reality (ELECTRE)(Mousseau, Roy, and Paris-dauphine Citation2005), Structural Equation Modelling (SEM) based aggregation methods were used to account the measured error and observe the relationship between unobserved variables, etc. The SEM based approach measures the path coefficients by estimating the covariance among the variables. But, it is important to trade-off the identified criteria and indicators and analyse the interdependency among them considering a pairwise comparison technique that considers the quantitative and qualitative approach and identifies the risk associated with each of the criteria/indicators. With this idea/approach, it could articulate and depict the interrelationship and then identify the integrated performance of building concerning criteria/indicator over the other and find the relative weights. Analytical Hierarchy Process (AHP) is one such simple and lucid way to obtain the interrelationship between various criteria and alternatives using pairwise comparison, where the problem is decomposed into several hierarchy levels to analyse them independently. This method has an inherent ability to deal with decision-makers’ judgements. However, it is incapable to handle the subjective and uncertainty of the decision. The fuzzy approach addresses and measures human judgement in real-time situations without losing significant information unlike the crisp method does. This is the unique reason to employ the fuzzy concepts in combination AHP is to capture the vagueness and imprecision of individual decisions and combine them to get a single index. This model brings out an effective and reliable solution for the problem (Jakhar and Barua Citation2014). Hence, the present study utilises Fuzzy integrated with AHP to capture the vagueness, uncertainty, and imprecision of the decision-maker. This integrated Hybrid MCDM technique can be utilised to obtain the relative weights of criteria and alternatives for any given problem involved with a number of decision-makers.
The present study encompasses the Social, Environmental, Economic, and Technological (SEET) aspects in achieving sustainable construction. This study is a continuation of the author’s work (Reddy, Anand Raj, and Rathish Kumar Citation2018) to quantify the building performance. The present study concentrates on quantifying the interdependency between SEET indicators and criteria using the Fuzzy Analytical Hierarchy Process (FAHP), a Hybrid Multi-Criteria Decision Making (MCDM) method considering local context, climate conditions, culture, topography and ethical aspects prevailing in developing countries.
1.4 Fuzzy numbers and linguistic terms
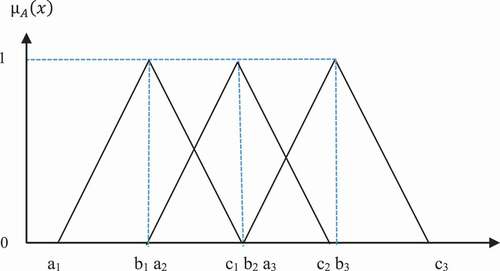
Lofti Zadeh (Citation1965), introduced the Fuzzy set theory to make decisions for problems dealing with vagueness, subjectivity, and impreciseness. Fuzzy comes into play when the judgement is not well defined and does not have proper boundaries/limits. In fuzzy set theory, each element is assigned with a membership value to determine the degree to which the element belongs to a fuzzy set ranging from 0 to 1. The concept of quantitative evaluation using linguistic terms is subjective in nature and involves vagueness. For this, the fuzzy set theory captures and resolves the ambiguity involved in the judgement (Chan, Chan, and Yeung Citation2009).
The fuzzy set denoted by ‘A’ is defined by µA(x): X→[0,1] on the universe of discourse, each element of ‘x’ is well-defined to a membership value µA(x) between 0 and 1 (When µA(x) = 0 the element x does not belong to set A and when µA(x) = 1, the element ‘x’, absolutely belongs to set A). Since there does not exist absolute membership values, generally, subjectivity is assessed based on the context. In the present study, the triangular fuzzy number is preferred to handle the subjectivity of the decision-maker. A membership function for a fuzzy set A on the universe of discourse X is defined as µA: X → [0, 1], where each element of X is mapped to a value between 0 and 1. This membership value or degree of membership quantifies the grade of membership of the element in X to the fuzzy set A. In , the x-axis represents the universe of discourse, whereas the y-axis represents the degree of membership in the [0, 1] interval. Triangular Fuzzy Numbers (TFN) are expressed in linguistic terms and are defined by a lower limit ‘a’, mean value ‘b’ and an upper limit ‘c’. It is usually employed to capture the vagueness of human judgement related to decision making. Instead of crisp numbers, the TFN’s are expressed with boundaries to reflect the fuzziness in conducting pairwise comparison shown in . Consider a TFN defined by = (a, b, c), where µA(x) is the degree of belonging or membership value of the element in the universe of discourse.
Table 1. Linguistic terms and corresponding triangular fuzzy numbers
Figure 1. Triangular fuzzy number
Consider two fuzzy numbers and
, where
and
whose operations of addition, multiplication, division and reciprocal are defined by Equations 2 to 5.
1.5 Analytical Hierarchy Process (AHP)
The AHP is a qualitative and quantitative MCDM technique used to evaluate the relationship between two or more components (Alwaer et al., Citation2010), in a logical way. AHP determines the significance of a set of dependent criteria over indicators. The relative indicators and criteria are adopted in the present study to analyse the problem of interdependency and achieve a single goal i.e., sustainable construction. The decision problem is analysed at various levels of hierarchy structure, to enable them to evaluate independently. To evaluate the building performance based on indicators and criteria, relative weights are determined using the concept of pairwise comparison to eliminate bias existing in the human judgement. The human perception involved with uncertainty and ambiguity can be resolved with the fuzzy logic concept. In the present study, to establish the interrelationship among the criteria, indicators, and criteria to indicators, the Fuzzy Analytical Hierarchy Process (FAHP) has been employed in decision making.
2. Comparison of existing building assessment tools
Based on the credibility and recognition of the rating system, four assessment tools were selected, compared and analysed for similarities and dissimilarities present in the developed, and developing countries. Though these rating systems seem to have some criteria in common (names), they differ in their meaning and understanding. This is mainly due to varied climate, culture, region, awareness, practices and assessment method. In addition to this, the rating systems are not unique in nature, dimension and do not comply with the requirements. The assessment tools in the developed countries i.e., LEED and BREEAM being the most prominent and globally established assessment tools in the domain of sustainable construction are considered in the present paperwork. Also, assessment tools used in developing countries like GRIHA and IGBC have been considered for comparison. The categories and criteria are compared in order to diagnose the significant similarities and differences underlying the existing tools and thereby, establish the criteria and sub-criteria for developing a new assessment method. While diagnosing the similarities and differences, the study emphasised potential and possible criteria to be considered in developing countries. The specific purpose to compare these tools is to check whether these assessment criteria and attributes are transferrable and adaptable to suit the circumstances for developing countries like India. compares and summarises, the components, features, and criteria of the existing assessment tools (BREEAM, LEED, IGBC, and GRIHA) to understand the depth of each of the criteria and their related attributes. The tick mark symbol ‘√’ represents that the criteria are included in the respective assessment tool, whereas cross mark ‘X’ represents that it does not. Some of the criteria, which contribute to building sustainability, are neither included in IGBC nor GRIHA. Similarly, the attributes, which are included in IGBC, are not included in GRIHA and vice-a-vice like for example, ventilation, CO2 emissions, and material efficiency. Also, some criteria like topographical consideration, climatic conditions, local context, and regional variations are not at all considered.
Table 2. Criteria comparison of existing assessment tools
For instance, energy is considered as a key category for all assessment methods and is given the highest possible points. BREEAM measures Building Energy Performance (BEP) along with CO2 emission reductions with the target of net-zero emissions. On the other hand, LEED emphasises reduction of energy costs for BEP rather than CO2 emissions, which is in line with the standards of American Society of Heating, Refrigerating and Air-conditioning Engineers (ASHRAE). LEED mainly focuses on renewable energy utilisation for measuring BEP and energy optimisation. However, energy monitoring and enhanced commissioning are not considered in the GRIHA rating system. The three assessment methods (LEED, BREEAM, and GRIHA), evaluate most of the major water quality and quantity parameters. Indoor water use reduction, potable water use reduction, water recycle and reuse, wastewater treatment and efficient landscaping are the common criteria considered in all the three rating tools. Water leak detection and water metering are considered important criteria but they are not considered in GRIHA for water efficiency evaluation.
Waste related criteria and their parameters are integral to all three-assessment methods. Within this broad criterion, waste management and recycling emerge as the most important parameters, due to their importance in minimising the negative impacts of waste generation for humans and the surrounding environment. Construction materials are another important element of the environmental assessment method due to the impact of material consumption on building users and the environment. BREEAM and LEED emphasise sourcing of raw materials, but it is not considered in GRIHA. Renovation of abandoned buildings is considered in LEED, but not considered in GRIHA evaluation criteria for assessment.
Indoor environmental quality (IEQ) is considered as a key objective for all building assessment methods. BREEAM and GRIHA include this category under Health and Well-being section. LEED assesses this category through low-emitting materials, indoor air quality, and quality views. Similarly, BREEAM assesses this category through visual comfort, the impact of refrigerants and noise pollution. GRIHA assesses this category through air quality; low-VOC paints, sanitation/safety facilities, but at the same time omits visual comfort, quality views, and hazards in its criteria. Tobacco smoke control, pollution, thermal comfort, and air quality are commonly considered in all three assessment methods.
Sustainable site categories focus mainly on-site selection, site reuse, and site protection, with the aim of reducing soil erosion and improving site conditions. BREEAM addresses sustainable sites, with its Land use and ecology category. BREEAM considers environmental protection as its primary parameter and in case of assessment tools LEED & GRIHA, this criteria sustainable site is highly important. Light pollution reduction and joint use of facilities are considered in LEED but not considered in GRIHA. All the tools evaluated in this study offer credits to encourage and support sustainability measures. BREEAM considers Management as a separate category for its assessment, while LEED distributes management parameters across several assessment categories. BREEAM covers sustainable management principles more comprehensively than LEED. Transportation is considered as a separate category in LEED and BREEAM. LEED addresses transportation through factors Location and Transportation criterion with 16 possible points whereas, BREEAM, assesses the same with 13 possible points. From the observations, it was found that the criterion Transportation and Management was not considered in GRIHA for environmental assessment.
3. Methodology
The identification of criteria related to sustainable construction from various sources including existing building rating systems was carried out to address Agenda 21 and UN initiatives towards sustainability. The three pillars were studied along with technological aspects, which has been lagging behind for achieving sustainable construction in terms of policies, guidelines, standards, technical capability, and skill.
3.1 Sustainable indicators, criteria, and attributes
a) Indicators: The multi-dimensional pillars for achieving sustainable construction are identified based on the needs, benefits, impacts, and goals. The present study considered the quadra bottom line approach Social, Environmental, Economic and Technological (i.e., SEET) as indicators.
The “environmental” indicator relates to effects on ecology and atmosphere, emissions, environmental protection measures, conservation of energy and water. The “Social” aspects involve the effects of the local context, employment, serviceability, public safety, sanitation, community development, human well-being, and cultural heritage. The “Economic” aspect refers to market supply and demand, financial investment, payback returns, valuation, and life cycle cost. The “Technological” aspects relate to innovative practices and the use of sustainable materials, specific design strategies for sustainable construction practices and assessment tools.
Criteria: These are the overall performance measurement indents for assessing, promoting and implementing sustainability in buildings.
Attributes: An attribute deals with the measure of performance of building sustainability. A group of attributes categorised under each criterion will address the specific importance.
The methodology to assess the relative weights of criteria and attributes and establish interrelationship among them is shown in . The theoretical approach of the study is shown in .
Figure 2. Methodology to assign relative weights and establish interdependency for criteria and indicators
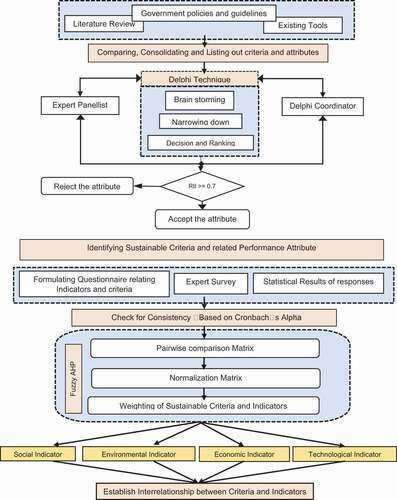
Figure 3. Theoretical approach of the study
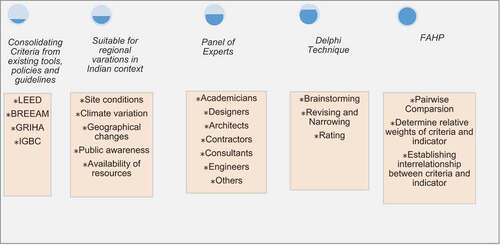
The significant criteria that can assess the sustainable performance of a building are identified based on the existing assessment tools, guidelines, and policies. Based on the comparison of tools like BREEAM, LEED, IGBC, and GRIHA, the criteria, and sub-criteria are assessed and checked for the possibility of transferring and adopting to developing countries. While diagnosing the similarities and differences in various existing tools, the study emphasised on the suitability of potential and possible criteria to be considered. Further, the diagnosed criteria are refined and screened out using Delphi Technique (DT) to reach a consensus on the identified criteria and understand the depth of each of the criteria and their related attributes for quantification. The DT was performed with the data obtained from six experts having a minimum of 20 years of experience in the domain area of sustainable construction, each belonging to categories such as Academicians, Engineers, Designers, Architects, Consultants, and Others to finalise the criteria and their related attributes.
Based on the comparative discussion carried in the paper of the same authors Reddy et al. (Citation2018), the significant criteria and attributes are adopted. The identified list is then refined and was utilised to develop priorities and weights through quantitative research methods and MCDM techniques.
The panellists were asked to assess the significance of each attribute for establishing sustainable building assessment attributes. To determine the relevant attributes for building assessment, data collected from the DT has been evaluated using the Relative Importance Index (RII) based on Equation 6.
Where, RII = Relative Importance Index;
= Respondent’s rating;
= Number of respondents placing identical weighting/rating;
S = sample size;
h = Highest attainable score;
The attributes whose RII value is more than or equal to 0.7 has been screened out for selecting the most significant parameters to assess the performance of the building. The identified attributes are then categorised into main criteria. The grouping of attributes into the main criteria was carried out based on the specific context and common implication followed by the existing assessment tools. This facilitates comparing the importance/weight given to the criteria in various existing tools. The ultimate criteria and attributes for sustainable building assessment are determined as shown in
Table 3. Most prominent sustainable criteria and sub-criteria for developing countries
The formation of the questionnaire to get responses in the AHP strategy is quite intricate due to its reciprocity in matrix development and hence is widely criticised. To receive wide responses from all the domains of civil engineering, the conversion of a 7-point Likert to Saaty’s scale is used (Suchith, Anand Raj, and Rathish Kumar Citation2018). This approach facilitates experts to participate in large numbers giving less/minimum time to respond.
The hierarchy structure of criteria and indicators is shown in . To determine the priority weights of criteria towards each of the indicators, pair-wise comparison of the criteria and indicators is performed for each individual judgements and then averaged.
Figure 4. Hierarchy structure of sustainable criteria with respect to SEET Indicators
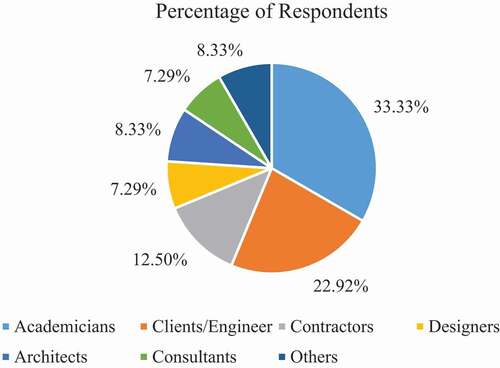
To evaluate the relative weights of criteria and indicators, the present study collected the data from a structured questionnaire survey responses (96 no’s) from all the stakeholders of the construction industry, each belonging to categories such as Academicians, Engineers, Designers, Architects, Consultants, Contractors, and Others. Inappropriate and incomplete response data is screened out and finally, 58 responses are found to be applicable. The questionnaire is formed in such a way that the relative importance of criteria with respect to each indicator (SEET) is obtained on a 7 point Likert scale. The consistency of the data is checked using Cronbach’s Alpha coefficient before performing statistical methods (Vaske, Beaman, and Sponarski Citation2017). Further, the study utilised the FAHP for assigning the relative weights to criteria and indicators.
4. Data collection, results and discussion
The data is collected using questionnaire responses and personal interviews. The questionnaire survey is designed and formulated in such a way that the importance of each of the identified criteria is measured towards the four indicators (SEET). The respondents were invited to assess the level of importance of criteria and indicators by assigning a score on the seven (7) point Likert scale. A score of ‘1ʹ indicates as ‘not important’ whereas, ‘7ʹ indicates ‘highly important’. Professionals from all domains of Civil Engineering including Academicians, Contractors, Engineers, Designers, Consultants, Architects, and Others were considered for the survey. Based on Equations 7(a & b) the sample size was estimated. The population size (N) consisting of 147 experts was considered. Assuming a confidence level of 95%, the corresponding z-score (z) is 1.96 and Population proportion () 0.5; margin of error (
) as 10%, the sample size (n) is calculated to be 58.
Respondent’s rating;
Number of respondents placing identical weighting/rating;
(If population size, N is unknown)
(If population size, N is known)
Among 147 professionals, a total of 96 professionals have responded, having experience between 1–20 years, to the survey ()
Figure 5. Details of respondents
Among the 96 responses, incomplete data and data which is not reliable to be considered have been neglected. As required 58 reliable and complete responses were selected for further investigation. The consistency of the collected data with multiple responses and opinions is measured within the set of closely related items of the group. Statistical analysis was conducted to expedite the results using Cronbach’s alpha coefficient (). Cronbach’s alpha is a function of a number of items and the average intra-class correlation among the items. It is considered to be a measure of scale reliability (Tavakol and Dennick Citation2011). In other words, this measures how consistent individuals have correlated the number of items within the given scale in a group (Cronbach and Shavelson Citation2004). For a given set of data items in a group, Cronbach’s
Table 4. Cronbach’s alpha coefficient for SEET indicators
N is the number of items, c is the average inter-item covariance among the items and v is the average variance. In general, the alpha score of more than 0.70 is considered acceptable (Tavakol and Dennick Citation2011). In the present study, the Cronbach’s alpha was calculated for four different groups (Social, Environmental, Economic, and Technological), from the information provided by 58 valid respondents and is shown in . In all the groups, the ‘α’ values were found to be more than 0.80. Thus, the data provided was found to be reliable and was of good quality.
The data obtained on the importance of sustainability indicators considering the SEET indicator is utilised for statistical calculations as illustrated in . For example, Designers have given higher importance to Indicator (C1) with a Mean (M) of 6.50 and Standard Deviation (SD) of 0.72 among all the experts. Similarly, the academicians have given less importance to C5 with Mean 5.15 and SD 1.09. This illustrates that different expert groups have allocated a different weighted score to indicators, which enables us to understand the perceptions of different expert groups in assessing the weights for different sustainability criteria, and indicators.
Table 5. Importance of sustainable indicators w.r.t expert domains
The approach evaluates the interrelationship between sustainability indicators and criteria, established to understand the relative performance for assessing building sustainability. In the present study, through Aggregation of Individual Priorities (AIP), the weights for sustainability indicators have been evaluated for 58 respondents with respect to the four SEET criteria. Similarly, the weights for eight sustainability criteria have been evaluated (i.e., 58 × 8 x 4 × 4). The relative weights of the sustainability indicators with respect to sustainability criteria and vice versa are evaluated using FAHP.
4.1 Procedure to evaluate the relative weights using Fuzzy AHP (Economic indicator and for one respondent)
The following steps are involved in assessing the weights of criteria and indicators using Fuzzy AHP.
Step 1: Compute the fuzzy pairwise comparison matrix using EquationEquation 9(9)
(9) , where d˜ijk indicates the fuzzified preference of ith indicator over jth indicator by the kth decision-maker for SEET indicator using fuzzy triangular numbers shown in .
Table 6. Triangular fuzzy pairwise comparison decision matrix for economic criteria
Step 2: Compute the triangular fuzzy numbers using minimum, geometric mean and maximum values (Equation 10) shown in . Here, represents triangular values, where
represents the degree of belonging or membership value for a triangular fuzzy function.
Table 7. Fuzzy triangular decision matrix
Step 3: The fuzzy weights of each indicator can be found by aggregating the fuzzy rating (Equation 11) explained in the following three sub-steps.
Step 3a: Find the vector summation of each using Equation 11 ().
Table 8. Vector summation decision matrix
Step 3b: Find the (−1) power of the summation vector and then replace the fuzzy triangular number with an increasing order ().
Table 9. Reverse and increasing order of vector summation decision matrix
Step 3 c: To find the fuzzy weight of indicator (), multiply each
with the increasing vector summation decision matrix using EquationEquation 12
(12)
(12) ().
Table 10. Triangular fuzzy weight of criteria
Step 4: Since are in fuzzy triangular numbers, they are de-fuzzified by Centre of Area method proposed by Wang and Wang (2014) using EquationEquation 13
(13)
(13) ().
Table 11. De-fuzzified weights of Criteria
Step 5: The Mi is a non-fuzzy number and the normalised values are evaluated using EquationEquation 14(Eq.14)
(Eq.14) ().
Table 12. Normalised de-fuzzified weights of criteria
The relative weights of remaining sustainability criteria are evaluated using EquationEquations (9(9)
(9) –Equation14
(Eq.14)
(Eq.14) ), where four no’s of 8 × 8 matrices for 58 respondents are performed. The average of individual priority weight is evaluated, using arithmetic mean operation and is represented in .
Figure 6. Relative weights of sustainable criteria w.r.t sustainable Indicators
Step 6: Similarly, the steps (4 to 8) are performed to obtain the relative weights of sustainability indicator (SEET) with respect to sustainability criteria; where eight no’s of 4 × 4 matrices for 58 respondents are performed and the final weights are obtained as shown in .
Figure 7. Relative weights for sustainable indicators w.r.t sustainable Criteria
Step 7: The interrelated weights are obtained by multiplying the relative weights of sustainability indicators and criteria ().
Figure 8. The interrelated weights for SEET indicator w.r.t sustainable criteria
From , considering Social indicator, the criteria Sustainable Sites (SS) has attained the highest weight (i.e.,13.93%) and overall rank sixth among all the 32 criteria (say 8 criteria x 4 indicators). Following this, the criteria, Transportation (T) and Social Welfare (SW) has achieved a nearby weight of 13.39% and 13.35% with an overall ranking of 12 and 13 respectively.
Considering Environmental indicator, the criteria Materials and Waste Management (MW) has attained the highest weight (i.e.,14.69%) and overall rank second among all the 32 criteria. The criteria Sustainable Sites (SS) and Energy Efficiency (EE) achieved a weight of 14.17% and 13.76% with an overall ranking of eight and three respectively. Considering the Economic indicator, the criteria MW has attained the highest weight (i.e., 14.09%) and an overall rank of fourth among all the 32 criteria. Next, to it, Health and well-being (HW) and Energy Efficiency (EE) has achieved a weight of 13.92% and 13.71% with an overall ranking of 7 and 9 respectively. Similarly, in the Technological indicator, MW and EE have attained the highest weight (i.e., 14.98% and 13.96%) and ranked first and fifth among 32 criteria respectively. From , it can be observed that the criteria MW have a major role in creating social justice in the built environment. It also reveals that with the use of efficient, non-pollutant and eco-friendly vehicles, there will be a reduction in the emissions and pollutants, further leading to reduced environmental impacts. Similarly, it can be noticed that the use of EE materials and technologies will benefit the user over a period of time. However, the initial cost may be high, but the cost to benefit ratio would be very low, due to a reduction in operational and maintenance costs. With proper implementation of guidelines and policies with respect to sustainable design principles of the buildings (technological indicator), the criteria, SS, eventually provides the source to attain the allotted weight. From , it can be noticed that for assessing the performance of a building towards sustainability, the criteria EE has the highest interrelationship weight (6.03%) corresponding to Economic indicator, Secondly, MW corresponding to Environmental indicator has a higher weight (5.81%). Similarly, SS in Technological indicator (5.54%), MW in Social (4.78%) and Management (M) in Technological (4.76%) indicator. Considering the interrelated weights of criteria and indicators, the average weights obtained by pooling along with the criteria with regard to Social, Environmental, Economic and Technological indicators (i.e., 2.77%, 3.67%, 2.66% and 3.45%) is taken as a cut off value to observe the effective or most significant criteria responsible for indicator performance. The weights which are higher than the obtained average weights are highlighted in . Then, the normalised % weights are calculated for criteria and indicators. It is noteworthy to observe that the Technological indicator incorporated along with the Triple-Bottom line (Environmental, Social and Economic) has the highest weight (28.4%) among SEET indicators. Similarly, Sustainable sites (SS) and Materials and Waste Management (MW) have achieved higher weights (16.91% and 15.56% respectively) among the 8 criteria.
Table 13. The interrelated weights of criteria and indicators
5. Validation
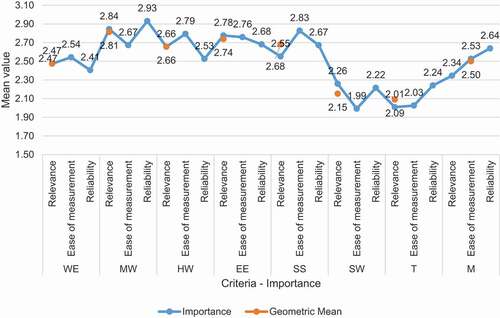
To validate the proposed approach for the obtained results in conceptual models, the study took a practical validation survey in the sub-urban region of an area located in one of the smart cities in India to explore the technical feasibility of designed interrelationships. A structured questionnaire survey is prepared to analyse the importance of eight criteria from the habitats. A total of 118 individual respondents were received by reaching them door to door. The importance is calculated based on three categories of measurement: relevance, ease of measurement, and reliability. A dimensionless scale from null (0), low (1), moderate (2), and high (3) is used for measuring the level of importance. A detailed description of each of the criteria and the intention of the survey is mentioned in the form of a letter. For effective understanding, the survey questionnaire is mentioned in both English and local language (i.e. Telugu).
As a result, multiple points of view were received from the habitats. It was observed that close variations are analysed concerning the interdependency in the developed approach (). The criteria whose interrelated weights are found to be highest and prioritised i.e. Material and Waste Management (MW), Energy Efficiency (EE), and Sustainable Site (SS) are in line with the habitat expectations and observed perceptions. On the whole, the assessment of building performance based on the identified criteria and attributes standards can serve as the basis for further developments in the field of sustainable construction in developing countries.
Figure 9. Importance of sustainability criteria
6. Conclusions
The study observed that there is an imperative need for encouraging and adopting sustainability principles in developing countries compared to developed countries. It is made clear that the development of the nation involved with the adoption of sustainable principles in the construction industry promotes overall growth without disturbing the eco-system and avoiding adverse impacts caused by the conventional principles and practices.
Based on the comparison of LEED, BREEAM, IGBC and GRIHA assessment tools and guidelines undertaken in the study, the relevant criteria and their related attributes for assessing the performance of a building are identified. This enabled to explore and bring out the similarities and dissimilarities that exist in the building assessment tools of developed and developing countries. The study utilised the Delphi Technique (DT) and Relative Importance Index (RII) for finalising the significant attributes, criteria, and indicators. While comparing these tools, the adaptability of various criteria and their corresponding attributes in developing countries were observed considering regional variation, climatic conditions, and topographical aspects. Thus, the study has refined and tailored the indicators, criteria and attributes to adapt to the conditions and consequences that prevail in developing countries like regional variation, culture, heritage etc.
The relative weights of criteria and indicators along with the interdependency are calculated using the Fuzzy Analytical Hierarchy Process, a subjective pairwise comparison. This has facilitated eliminating uncertainty and ambiguity of human judgement. Among SEET indicators, Environmental indicator has secured the highest relative weight of 30.15% and the Technological indicator is next to this with a weight of 28.52%. This shows the importance of Technological indicator which was not finding a deserved place in the Triple bottom line approach. In this way, the study brought out the significance of the proposed ‘Technological’ indicator and encouraged the Quadra-Bottom Line approach in implementing and achieving sustainable construction. Thus, the findings facilitate the incorporation of innovative ideas and implement the concepts of 5 R’s into sustainable design principles.
Based on DT and RII, the present study defines 37 attributes broadly under eight major criteria that are most appropriate for the assessment of sustainable performance for construction in developing countries. These criteria include Water Efficiency (WE), Materials and Waste Management (MW), Health and Well-being (HW), Energy Efficiency (EE), Sustainable Sites (SS), Social Welfare (SW), Transportation (T), and Management (M). These criteria facilitate policymaking, guidelines, and development of the green building rating tool. Among all the criteria, MW has attained the highest relative weight of 13.96% and subsequently, EE attained 13.15%. The MW secured the first position and EE is ranked fifth among the eight criteria. It is noteworthy to observe that both these criteria belong to the Technological indicator. Based on the interrelated weights, the criteria WE, MW, SS, and S are categorised under Social indicator, MW, EE, T, and M are categorised under the Environmental aspect. While, WE, HW, EE, and SS are grouped under Economic indicator and HW, SS, SW and M criteria are categorised under the Technological indicator. This interdependency between criteria and indicators facilitates the scope for the development of a framework for a sustainable building assessment in developing countries like India.
Acknowledgments
The authors gratefully thank all the expert decision-makers for providing valuable comments and responses for the questionnaire survey.
Data Availability Statement
No data, models, or code were generated or used during the study
Disclosure statement
No potential conflict of interest was reported by the authors.
Additional information
Notes on contributors
A. Suchith Reddy
Dr Suchith Reddy Arukala is a Chartered Engineer by his qualification, obtained Ph.D. from the National Institute of Technology, Warangal, India. He has operated the domain projects in civil engineering in large-scale industry in various giant companies like HCC Ltd, LnT and Madhucon Projects Ltd. His areas of interest are construction technology and management, sustainable concrete technology, fuzzy logic, MCDM and sustainable building assessment, life cycle assessments of materials and sustainable product declaration. He is a member of ASCE, CIOB, ISTE and ISPE. He has been recently awarded Earth Leader for Sustainable Development by Council for Green Revolution, India. He has also received Rosaland Honorary Membership from London Press Journals for his outstanding paper published in International Journal of Sustainable Engineering. He has published a good number of papers in reputed SCI/Scopus-indexed international and national journals
P. Rathish Kumar
Dr. P. Rathish Kumar is currently Professor and Head of the Department of Civil Engineering, National Institute of Technology Warangal. He obtained his Ph.D from the NIT Warangal and Doctor of Engineering & Post-Doctoral Fellow from Hokkaido University, Japan. His major areas of interest include new/alternate/supplementary cementitious materials, special concretes, rehabilitation of structures, construction technology and management, structural health monitoring, earthquake engineering and sustainable materials and technologies. He has published 213 technical articles in various international and national journals and conferences of repute along with one Book and 13 Book Chapters. He has guided 6 Doctoral students and 8 students are presently working with him. He has guided 66 Master’s students and 34 Bachelor’s student teams. He is a recipient of several awards including Aftab Mufti Medal, prestigious Monbusho and JSPS Scholarships of the Japanese Government, Best Engineering Researcher Award, Heritage Scholarship to pursue research at IST Portugal, Danish Government Scholarship, Italy Government Post Doctoral Scholarship, Heritage Scholarship under Erasmus Mundus, AIT Fellowship, ASEM-DUO India Fellowship, Slovakian Government Scholarship, Jawaharlal Nehru memorial fellowship, Distinguished Alumnus award and Earth Leader Award for the year 2019 from KPR Foundation. Prof Kumar is a member of the Research Advisory Council member of the National Council for Cement and Building Materials (NCCBM), Hyderabad for the past four years. He represents several Bureau of Indian Standard(BIS) committees like CED-4 ie Lime and Gypsum Products of the BIS, Member of the Preparation of Handbook of lime for the BIS, Convenor for revision of all parts of Indian Standard Code IS 2542-1978 including tests for Gypsum, Plaster, Concrete and Mortars, Member of Revision of Indian Standard Code IS 712:1984 ie Specification for building limes. He is on the editorial board of Journal of FactaUniverstatis, Journal of Cement WapnoBeton among others and is a reviewer of several International Journals published by Elsevier, Thomas Telford, Taylor and Francis etc.
P Anand Raj
Prof. P. Anand Raj (Ph.D. (DSS-IIT), Int. PG. Dip (H & WRE), MISTE, MIE(I), C. Engr. (I), MIAHS (UK), MISMCDM(USA) is a well-qualified academician with various professional affiliations and has been awarded various honors and awards, took responsibilities in various administrative, organizational, societal, community services. Awarded 6 Ph.D’s and 3 are under pursuing. He has published various papers in SCI journals and various conferences. He is an expert in Systems Analysis, Fuzzy Systems, Multi-Criteria Decision Making, Hydrology and Fluid Mechanics.
References
- ALwaer, H., and D. J. Clements-Croome. 2010. “Key Performance Indicators (Kpis) and Priority Setting in Using the Multi-Attribute Approach for Assessing Sustainable Intelligent Buildings.” Building and Environment 45 (4): 799–807. doi:https://doi.org/10.1016/j.buildenv.2009.08.019.
- Alyami, S. H., Y. Rezgui, and A. Kwan. 2015. “The Development of Sustainable Assessment Method for Saudi Arabia Built Environment: Weighting System.” Sustainability Science 10 (1): 167–178. doi:https://doi.org/10.1007/s11625-014-0252-x.
- Ameen, R., F. Mohammed, and M. Mourshed. 2019. “Urban Sustainability Assessment Framework Development: The Ranking and Weighting of Sustainability Indicators Using Analytic Hierarchy Process.” Sustainable Cities and Society 44: 356–366. doi: https://doi.org/10.1016/j.scs.2018.10.020. February 2018.
- Barbosa, M., T. Gomes, and M. Almeida. 2017. “Developing the Methodology for Determining the Relative Weight of Dimensions Employed in Sustainable Building Assessment Tools for Brazil.” Ecological Indicators 73: 46–51. doi:https://doi.org/10.1016/j.ecolind.2016.09.017.
- Bautista, S., M. Enjolras, P. Narvaez, M. Camargo, L. Morel, et al. 2016. “Biodiesel-Triple Bottom Line (TBL): A New Hierarchical Sustainability Assessment Framework of Principles Criteria & Indicators (PC&I) for Biodiesel Production. Part II-Validation.” Ecological Indicators 69 :803–817. doi:https://doi.org/10.1016/j.ecolind.2016.04.046.
- Berardi, U. 2015. “Building Energy Consumption in US, EU, and BRIC Countries.” Procedia Engineering 118: 128–136. doi:https://doi.org/10.1016/j.proeng.2015.08.411.
- Brussel, V. U. 1986. “How to Select and How to Rank Projects: The PROMETHEE Method.” 24: 228–238.
- Cancino, C., A. La Paz, A. Ramaprasad, and T. Syn. 2015. “Management of Technological Innovation for Sustainable Growth: An Ontological Meta-Analysis.” 179: 374–388. https://www.scopus.com/inward/record.uri?eid=2-s2.0-84975728130&partnerID=40&md5=f7eaad35d4f4e7fa79c4248cc93bd5bb
- Chan, A. P. C., M. C. Daniel W, and Y. Y. John F. 2009. “Overview of the Application of “Fuzzy Techniques.Pdf.” Journal of Construction Engineering and Management 135 (11): 1241–1252. doi:https://doi.org/10.1061/(ASCE)CO.1943-7862.0000099.
- Cronbach, L. J., and R. J. Shavelson. 2004. “My Current Thoughts on Coefficient Alpha and Successor Procedures.” Educational and Psychological Measurement 64 (3): 391–418. doi:https://doi.org/10.1177/0013164404266386.
- Dangwal, R., 2016. “A Fuzzy Approach for Supplier Evaluation and Selection in Supply Chain Management.” Journal of Cleaner Production 2 (4): 1–11. doi:https://doi.org/10.1080/19397038.2016.1153168.
- Darko, A., A. P. C. Chan, E. E. Ameyaw, B.-J. He, A. O. Olanipekun, et al. 2017. “Examining Issues Influencing Green Building Technologies Adoption: The United States Green Building Experts’ Perspectives.” Energy and Buildings 144 :320–332. doi:https://doi.org/10.1016/j.enbuild.2017.03.060.
- Ding, G. K. C. 2014. “3 Life Cycle Assessment (LCA) of Sustainable Building Materials: An Overview.” Eco-Efficient Construction and Building Materials: Life Cycle Assessment (LCA), Eco-Labelling and Case Studies, Woodhead Publishing38–62
- Du Plessis, C. 2007. “A Strategic Framework for Sustainable Construction in Developing Countries.” Construction Management and Economics 25 (1): 67–76. doi:https://doi.org/10.1080/01446190600601313.
- Du Plessis, Chrisna. 2002. “Agenda 21 For: Sustainable Construction in Developing Countries - a Discussion Document.”91. http://researchspace.csir.co.za/dspace/handle/10204/3511
- Durdyev, S., and E. K. Zavadskas. 2018. “Sustainable Construction Industry in Cambodia : Awareness, Drivers and Barriers.” Sustainability 24 (1): 1–19.
- Forum, E. P. 2014. “Promoting Sustainable and Inclusive Growth in Emerging Economies : Green Buildings.” 1–62. https://economic-policy-forum.org/wp-content/uploads/2016/02/Sustainable-and-Inclusive-Growth-Green-Buildings.pdf
- Jain, M., M. Mital, and M. Syal. 2013. “Obstacles and Catalysts Associated with Implementation of LEED-EB? in India.” Environment and Urbanization Asia 4 (2): 349–363. http://eua.sagepub.com/cgi/doi/10.1177/0975425313511164
- Jakhar, S. K., and M. K. Barua. 2014. “An Integrated Model of Supply Chain Performance Evaluation and Decision-Making Using Structural Equation Modelling and Fuzzy AHP.” Production Planning & Control 25 (11): 938–957. http://www.tandfonline.com/doi/abs/10.1080/09537287.2013.782616
- Jiang, Q., Z. Liu, W. Liu, T. Li, W. Cong, H. Zhang, J. Shi, et al. 2018. “A Principal Component Analysis Based Three-Dimensional Sustainability Assessment Model to Evaluate Corporate Sustainable Performance.” Journal of Cleaner Production 187 :625–637. doi:https://doi.org/10.1016/j.jclepro.2018.03.255.
- Ju, C., Y. Ning, and W. Pan. 2016. “A Review of Interdependence of Sustainable Building.” Environmental Impact Assessment Review 56: 120–127. doi:https://doi.org/10.1016/j.eiar.2015.09.006.
- Kaivo-Oja, J., J. Panula-Ontto, J. Vehmas, and J. Luukkanen. 2014. “Relationships of the Dimensions of Sustainability as Measured by the Sustainable Society Index Framework.” International Journal of Sustainable Development and World Ecology 21 (1): 39–45. doi:https://doi.org/10.1080/13504509.2013.860056.
- Kylili, A., and P. A. Fokaides. 2017. ““Policy Trends for the Sustainability Assessment of Construction Materials : A Review.”.” Sustainable Cities and Society 35: 280–288. July. doi:https://doi.org/10.1016/j.scs.2017.08.013.
- Lazar, N., and K. Chithra. 2020. “A Comprehensive Literature Review on Development of Building Sustainability Assessment Systems.” Journal of Building Engineering 32: 101450. May. doi:https://doi.org/10.1016/j.jobe.2020.101450.
- Liu, H., and B. Lin. 2016. “Ecological Indicators for Green Building Construction.” Ecological Indicators 67: 68–77. doi:https://doi.org/10.1016/j.ecolind.2016.02.024.
- Mahmoud, S., T. Zayed, and M. Fahmy. 2019. “Development of Sustainability Assessment Tool for Existing Buildings.” Sustainable Cities and Society 44: 99–119. doi: https://doi.org/10.1016/j.scs.2018.09.024. May 2017.
- Mori, K., and A. Christodoulou. 2012. “Review of Sustainability Indices and Indicators: Towards a New City Sustainability Index (CSI).” Environmental Impact Assessment Review 32 (1): 94–106. doi:https://doi.org/10.1016/j.eiar.2011.06.001.
- Mousseau, V., B. Roy, and U. Paris-dauphine. 2005. Electre Methods. New York, NY: Springer.
- Raouf, A. M. I., and S. G. Al-ghamdi. 2019. “Building Information Modelling and Green Buildings : Challenges and Opportunities.” 2007.
- Reddy, A. Suchith, P. Anand Raj, and P. Rathish Kumar. 2018. “Developing a Sustainable Building Assessment Tool (SBAT) for Developing Countries—Case of India.” In Urbanization Challenges in Emerging Economies: Resilience and Sustainability of Infrastructure, pp. 137–148. Reston, VA: American Society of Civil Engineers
- Ruparathna, R., K. Hewage, and R. Sadiq. 2016. “Improving the Energy Efficiency of the Existing Building Stock: A Critical Review of Commercial and Institutional Buildings.” Renewable and Sustainable Energy Reviews 53: 1032–1045. doi:https://doi.org/10.1016/j.rser.2015.09.084.
- Salazar, J. 2013. “1 Eco-Efficient Construction and Building Materials: Life Cycle Assessment (LCA), Eco-Labelling and Case Studies.” Life Cycle Assessment (LCA) of Windows and Window Materials. http://www.sciencedirect.com/science/article/pii/B9780857097675500212
- Sev, A. 2011. “A Comparative Analysis of Building Environmental Assessment Tools and Suggestions for Regional Adaptations.” Civil Engineering and Environmental Systems 28 (3): 231–245. doi:https://doi.org/10.1080/10286608.2011.588327.
- Singh, B., and R. Joshi. 2015. “Benchmarking Academics through Sustainable Assessment Criteria: An Indian Case Study.” Benchmarking: An International Journal 22 (3): 505–536. doi:https://doi.org/10.1108/BIJ-01-2013-0006.
- Tathagat, D., and R. D. Dod. 2015. “Role of Green Buildings in Sustainable Construction-Need, Challenges and Scope in the Indian Scenario.” IOSR Journal of Mechanical and Civil Engineering Ver. II 12 (2): 2320–2334. www.iosrjournals.org
- Tavakol, M., and R. Dennick. 2011. “Making Sense of Cronbach’s Alpha.” International Journal of Medical Education 2: 53–55. doi:https://doi.org/10.5116/ijme.4dfb.8dfd.
- Ubarte, I., and O. Kaplinski. 2016. “Review of the Sustainable Built Environment in 1998–2015.” Engineering Structures and Technologies 8 (2): 41–51. doi:https://doi.org/10.3846/2029882X.2016.1189363.
- Ugwu, O. O., and T. C. Haupt. 2007. “Key Performance Indicators and Assessment Methods for Infrastructure Sustainability-a South African Construction Industry Perspective.” Building and Environment 42 (2): 665–680. doi:https://doi.org/10.1016/j.buildenv.2005.10.018.
- Vaske, J. J., J. Beaman, and C. C. Sponarski. 2017. “Rethinking Internal Consistency in Cronbach’s Alpha.” Leisure Sciences 39 (2): 163–173. doi:https://doi.org/10.1080/01490400.2015.1127189.
- Vyas, G. S., and K. N. Jha. 2016. “Identification of Green Building Attributes for the Development of an Assessment Tool: A Case Study in India.” Civil Engineering and Environmental Systems 33 (4): 313–334. doi:https://doi.org/10.1080/10286608.2016.1247832.
- Wind, Y., and T. Saaty. 1980. “MArketing Application of the Analytic Hierarchy Process.” Managemeent Science 26: 7.
- Xu, X., Y. Wang, and L. Tao. 2019. “Comprehensive Evaluation of Sustainable Development of Regional Construction Industry in China.” Journal of Cleaner Production 211: 1078–1087. doi:https://doi.org/10.1016/j.jclepro.2018.11.248.
- Zadeh, L. A. 1965. “Fuzzy set theory and its applications.” 8: 338. University of California, California.