
 ?Mathematical formulae have been encoded as MathML and are displayed in this HTML version using MathJax in order to improve their display. Uncheck the box to turn MathJax off. This feature requires Javascript. Click on a formula to zoom.
ABSTRACT
A novel hybrid composite material was developed through the compression moulding technique by adding bagasse fibre, stone-dust and 6063 aluminium alloy (Al-Mg-Si) particles to recycled high-density polyethylene (rHDPE) matrix. The bagasse fibres were treated while the stone-dust and 6063 aluminium alloy (Al-Mg-Si) particles were sieved to particle sizes of ˂75 µm and ˂250 µm, respectively, before blending with the matrix. The work investigates comparatively, the influence of bagasse fibre-stone dust (hybrid-of-2) and bagasse fibre-stone dust-Al-Mg-Si particles (hybrid-of-3) on composite formation systems for reinforced rHDPE composites. The properties of recycled HDPE and rHDPE composites were thoroughly investigated through selected mechanical properties, wear resistance and thermal conductivity tests. The results show that the addition of bagasse fibre-stone dust-Al-Mg-Si alloy particles improves the mechanical, wear and thermal properties of the composites. The ultimate tensile strength was enhanced by 39% having a UTS value of 32 MPa, tensile modulus by 13% with a value of 98 MPa and wear resistance by 53% with a value of 0.8 g. SEM images showed that these reinforcements blended more properly when lower contents were added. This is responsible for the enhancement observed in the mechanical properties of the hybrid-of-3 reinforced composite.
Introduction
The increasing rate of production of plastics on a global scale is amazing since there is more plastic produced in the previous decade than during the entire twentieth century. This exponential growth in plastics production is due to what is known as the ‘plastics revolution’ whereby chemists are developing new methods to push the limits of polymers (Peplow Citation2016). However, new environmental regulations are beginning to target plastic products, such as micro-plastics (Carrington Citation2018). Kazemi-Najafi (Citation2013) in his review reports that ‘waste plastics account for 11.2% of the annual 84.2 thousand tons of municipal waste stream generated in Tehran in 2006 and 12.4% out of 250 million tons in the USA in 2010’. This is also evident in most African countries and particularly Nigeria, with lots of waste plastics accounting for much of the pollution both on land and in the oceans (Adekomaya and Ojo Citation2016). To alleviate this problem, conventional domestic waste plastic recycling methods include only a few types of plastics like low-density polyethylene (LDPE), high-density polyethylene (HDPE), and polypropylene (PP) (AlmMa’adeed et al. Citation2018). Often, the recycled material needs to be processed in ways that reduce contamination (Scelsi et al. Citation2011). Thus, current recycling methods involve filtering for size and type, a comprehensive washing and separation operation, crushing, drying, and granulation to produce a recycled resin pellet product that can be utilised (AlmMa’adeed et al. Citation2018). However, the low economic value of waste plastic and the difficult filtering process causes low plastic recycling rates (Rajendran et al. Citation2012). Based on the consciousness of the detrimental effects of these waste plastics on the environment, developed and developing nations of the world began to research into ways and/or methods of recycling these waste plastics such that it could be returned into the economy with little or no extra cost, thus, limiting or reducing their negative impact on the environments.
In the last few decades, researchers around the world have worked assiduously to develop quite a number of new and novel materials in their quest to satisfy human needs and/or provide laudable solutions to problems of interest (Oladele, Omotosho, and Adediran Citation2020a). However, many of these new materials are developed from a combination of one or more of the fundamental sources of materials like metals, polymers/cellulosic and/or ceramics. Most developed composite materials are with or without a prior understanding of either their end application or the trends in material development. This means that many of the newly developed materials are produced with researchers focusing mainly on the end application of the developed materials and not considering the immediate and/or future environmental impact of such materials. According to Da Luz et al. (Citation2018) and Monteiro et al. (Citation2016); bagasse fibre is a plant product from lingo-cellulosic fibre extracted from sugarcane (Saccarum officinarum), a traditional crop produced and grown in tropical and temperate regions around the globe. Considerable parts of this bagasse in many countries are disposed of in open-air piles as waste. It is however worth noting that both incineration and disposal of this fibre affect the environment due to the emission of large volumes of CO2, which contributes to global warming and climate change. Hence, their use in composite development has been highly researched as part of measures to reduce their undesirable environmental impact (Oladele Citation2014).
Stone/quarry dust, on the other hand, is a residue produced from stone-crushing plants. It is the finest particle produced from the mines (Bahoria, Parbat, and Nagarnaik Citation2016). The dust may be spherical, cubic, tetragonal, a platelet, or of other regular or irregular shapes, but it is approximately equiaxed. Out of the different quarry wastes, stone dust is usually available in abundance to the extent of 200 million tonnes per annum. About 20–25% of the total production in each crusher unit is left out as the waste material in stone dust. It is associated with landfill disposal problems as well as health and environmental hazards (Mahali and Sinha Citation2015). In a research carried out by Abdellahi and Hejazi (Citation2015), it was reported that the flexural and compressive strength could be improved by increasing the stone powder weight percentage in composites. In another research involving the addition of PET strips with stone dust, the strength of subgrade produced improved substantially. Thus, this makes them become useful materials in construction industries (Mahali and Sinha Citation2015). Prakash and Rao (Citation2016) also reported that the addition of stone dust particles could help to improve the water absorption level of reinforced waste plastic composites. Wastes from the machining of aluminium profiles are readily available in Nigeria and are being discarded in an unwanted place in particle forms. Machined particles from these Al-Mg-Si alloy profiles have been characterised by excellent ductility as well as good corrosion properties and have been used in material development (Zeid Citation2019;; Chelladurai et al. Citation2020).
After a meticulous study of the rate at which wastes are being generated from almost all human activities, Bahoria, Parbat, and Nagarnaik (Citation2016) reported the environmental problems associated with the incessant and indiscriminate disposal of waste with millions of tons produced yearly. Therefore, the need for a reduction in these wastes through their effective utilisation form part of the reason for this current research. The production of these wastes causes economic and environmental problems. Hence, to help reduce the environmental impact of industrial waste, this research was carried out to study their potential usage in bio-composite material developments. This was in line with the current trends of proffering solutions to waste plastics (Oladele et al. Citation2020b). However, part of the novelty of this work was the blend of waste materials from different fundamental sources in a single matrix. These reinforcements are drawn from metallic (Al-Mg-Si), ceramic (stone dust), and polymer (cellulosic bagasse fibre). The work considers the use of total waste materials for the development of new materials instead of creating new ones and if this can be sustained, sustainable development will be advanced and our environment will be clean. This material can be suitable for application in automobile industries where it can be used as part of the interior cover for metallic bodies.
Materials and methods
Materials
The materials used for this research were sugarcane bagasse fibre obtained from farmland located in Akure South Local Government Area, Akure Ondo State, Nigeria, and stone-dust particles obtained from Sandex Quarry Company located in the same geopolitical zone, Akure Ondo State, Nigeria while particles of Al-Mg-Si metal were collected from Aluminium fabricators at Aluminium Village, Dopemu, Agege, Lagos. Recycled High-Density Polyethylene (HDPE) supplied by ZL Global Alliance Plastic Recycling Company, Akure, Ondo State Nigeria. Other materials used were Sodium Hydroxide (NaOH) pellets which are of experimental grade supplied by Pascal Scientific Limited, Akure, Ondo State, Nigeria, while Distiled water was sourced from the Corrosion and Electrochemical Research Laboratory, Department of Metallurgical and Materials Engineering, Federal University of Technology, Akure (FUTA) Nigeria.
Methods
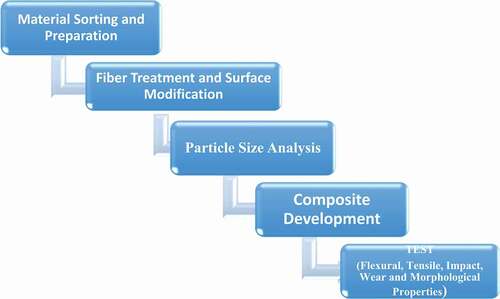
The flowchart in shows the methodology for this research.
Figure 1. Flowchart for methodology
Material sorting and preparation
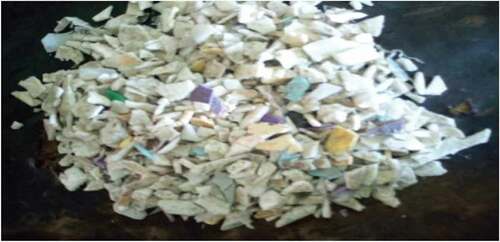
Recycled HDPE was washed with detergent and rinsed with clean water to remove oil stains, debris, and other contaminants before manual sorting to remove larger sizes that will not fit into the mould cavity. shows the as-received/sorted recycled HDPE
Figure 2. Sorted recycled HDPE
Fibre treatment and surface modification
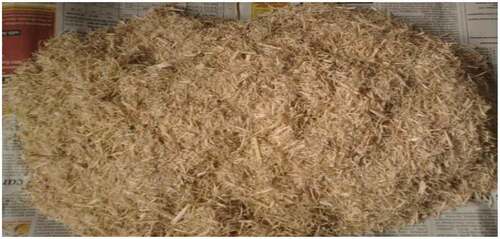
The bagasse fibre was rinsed with clean water and then chopped into short fibres of 8–10 mm length using a penknife before treatment with Sodium Hydroxide (NaOH) solution. The chopped sugarcane bagasse fibre was treated with 0.5 M NaOH solution by weighing and dissolving 40 g of NaOH pellets in 0.5 litres of distiled water. The treatment was done at a temperature of 550°Cfor 2 hours and then rinsed with distiled water until the pH of the rinse solution stabilised at 7. Thereafter, it was sun-dried for 3 days at a temperature of about 25 ± 22°Cduring sunlight at an average of 6 hours/day to remove the moisture content of the treated bagasse fibre. The chopped and treated bagasse fibre is as shown in .
Figure 3. Chopped and treated sugarcane bagasse fibre
Particle size analysis
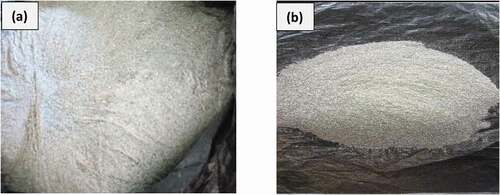
The as-received stone dust and Al-Mg-Si particles were both analysed in the laboratory by sieving with a sieve shaker from where particle sizes of ˂75 µm and ˂250 µm, respectively, were collected and used for the composite development. The analysed particles are as shown in .
Figure 4. Analysed (a) stone dust of ˂75 µm (b) Al-Mg-Si of ˂250 µm
Composite development
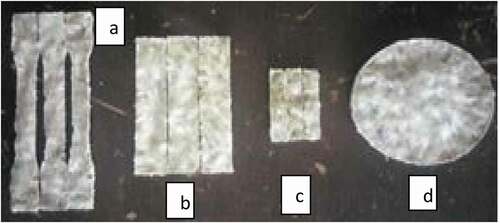
The composites were developed using a compression moulding technique. The predetermined proportion of recycled HDPE, stone-dust, Al-Mg-Si particles and treated bagasse fibre was mixed in a container before pouring into the mould. The blend in the mould was compounded with a compression moulding machine. Compounding of the samples was carried out in a rectangular mould of dimension 150 × 100 × 3 mm. The working condition for the production of the composites was 170°C for 7 min at 5 bar. Compounding of samples was carried out to ensure an even distribution of the reinforcement in the matrix and a proper blend, followed by the reproduction of the sample using the same working parameters. The respective moulds for the properties to be examined were used at this stage. Subsequently, the mould was removed from the compression moulding machine and the materials were then allowed to cool in the air at ambient temperature. This is done by controlling samples and composite samples filled with various weight fractions of stone-dust, Al-Mg-Si particles, and treated bagasse fibre (3, 6, 9, 12, and 15 wt.%) were developed. The mould dimensions for tensile, flexural, impact and wear are, 90 × 10 × 3 mm, 120 × 15 × 3 mm, 15 × 5 × 3 mm, 80 × 10 × 3 mm, respectively. Three samples were developed for each specimen. shows the compression moulded composite samples prior to testing.
Figure 5. Developed rHDPE composites samples before test {(a) tensile (b) flexural (c) impact (d) wear}
Examination of mechanical and morphological properties
Flexural Test
A three-point bending test was used to evaluate the flexural strength of the samples according to ASTM D790-15. Citation2015 The tests were performed on a universal tensile testing machine, the Instron Series 3369 model. The length, width and thickness of the specimen were 120, 15 and 3 mm, respectively. The tests were carried out using a displacement control rate at 10 mm/min. The test speed was 5 mm/min over a span of 65 mm. Three samples were tested for each composition and the average value was used as the representative values.
Tensile test
The tensile tests were conducted according to ASTM D638-10. Citation2010 standard on a universal testing machine Instron series 3369 model. The specimens with dimension 90 × 10 × 3 mm dumbell shape were used. The test was conducted at a crosshead speed of 5 mm/min. In each case, three samples were used and the average values were reported.
Wear test
The wear procedure follows the standard CS-10 Calibrase or H-16 calibrade. The wear test was carried out with Taber Abrasers, Model ISE AO16. The standard load used was 500 g and a revolution of 150 RPM. A centre hole of 10 mm was made on the sample to fix the test piece on the machine. The sample was secured to the instrument platform which is a motor driven at a fixed speed and the values were recorded. Each specimen was a flat and round disc of approximately 100 mm2 and a standard thickness of approximately 6.35 mm. Wear resistance was measured using the weight difference before and after abrasion (weight loss technique). Care was taken to remove loose particles adhering to specimens during testing, especially prior to weighing. The weight losses of each of the samples are determined using Equationequation (1)(1)
(1) :
Impact test
An impact test was carried out on the sample using a Charpy impact testing machine in accordance with ISO 179–1. Citation2010 Samples were cut into the impact test dimension of 80 × 10 × 3 mm and notched at the centre. Samples were placed horizontally on the machine, maintaining a distance of 60 mm between lines of supports. The initial reading of the gauge was taken and then a suspended handle that swings and fractures the sample was released. The final reading was taken after the sample has fractured. For each sample, three test pieces were tested. The average value was taken as the representative value.
Thermal conductivity
Lee’s disk apparatus, comprising a temperature controller, contactor, thermocouple sensor, and heater, was used for the determination of thermal conductivity of the developed composites and the control sample. Power was supplied to the contactor switch and heater from 220 V/50 or 50/60 Hz source. Temperature controller 1 was activated to a preset temperature value T1 for disk A. The heat from the heater is transferred from the disk A through the sample to the disk B. The two sensors Th1 and Th2 connected to the disks are used to sense temperature changes in the metal disks. The process was set up by placing the sample in between disk A and disk B. The switch was on and disk A is preset to known temperatures that act as the reference temperature. A temperature change in disk B was noted and recorded at a regular interval until there is no temperature change taking place. The apparatus was switched off after taking the final readings which were used to determine the thermal conductivity from Equationequations 2(2)
(2) and Equation3
(3)
(3) .
Thermal conductivity,
Where m – mass of the disk, 0.0078 Kg
cp – specific heat capacity of the disk, 0.91 kJ/Kg K
θ1, θ2- initial and final temperature of disk B
D – diameter of the sample, 0.04 m
x – thickness of the sample, 0.003 m
T1, T2 – Temperature of disk A and B in Kelvin
t – final time taken to reach a steady temperature.
Thermal conductance was calculated from the thermal conductivity and thickness of the material as shown in Equationequation 3(3)
(3) .
Thermal Conductance,
where; k – thermal conductivity
x – thickness of the sample
Hardness test
A hardness test was conducted on the specimen using a Shore D hardness tester following ASTM D2240-00, Citation2000. The samples were placed on the flat surface of the tester stand and indented. Four values were obtained by indenting the samples in four different places and the average value was used for analysis.
Scanning Electron Microscope (SEM) observation
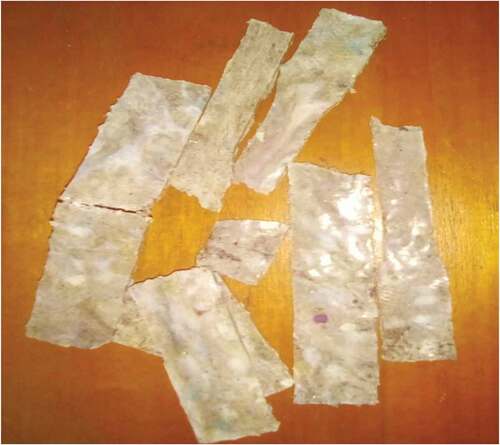
Scanning Electron Microscope of Model JEOL JSM-7600 F was used for the morphological characterisation of the fractured surfaces of the composite samples that were shown in . This was carried out to study the miscibility of the particles and fibre with the matrix at the fractured surfaces. Cut samples were air-dried and glued on sample holder before being coated with thick iridium in a JEOL sputter ion coater. The coated sample surfaces were observed with the SEM.
Figure 6. Fractured samples after mechanical properties tests
Results and discussion
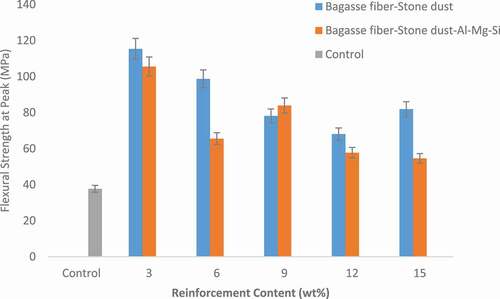
shows the variation of flexural strength at peak with composite samples. It was observed from the results that flexural strength at peak for all the developed composite samples improved significantly compared to the control sample. This showed that the addition of the reinforcements enhances the flexural strength of the composite samples. However, it was noticed that the strength decreases as the reinforcement content increases. This could be as a result of weak interfacial bonding that arises as the amount of the reinforcement content increases due to the likely reduction in the polymer strength due to degradation. Hence, reinforcement is being sought to fill in the gap or setback that may arise from the initial use of the polymer. However, composite samples reinforced with hybrid-of-2 (bagasse fibre-stone dust) showed a more pronounced improvement in the flexural strength of most of the composite samples compared to their counterparts reinforced with hybrid-of-3 (bagasse fibre-stone dust-Al-Mg-Si particles). This may be due to the reason stated above. Thus, a linear decrease was observed in the flexural strength of the hybrid-of-2 reinforced composite samples from 3 to 12 wt.% reinforcement contents before showing a subtle increase at 15 wt.%. On the other hand, a sinusoidal waveform pattern was observed in the flexural strength of the hybrid-of-3 reinforced composite samples from 3 to 12 wt.%. Furthermore, composite samples having 3 wt.% reinforcements in both cases gave the optimum results with a respective value of 115 MPa and 106 MPa for hybrid-of-2 and hybrid-of-3 reinforced composites. This may be due to the less agglomeration observed in the composite samples as a result of the evenly dispersed reinforcements in the composite samples at this level of reinforcements. Hence, bringing about 205% enhancements in the flexural strength at the peak of the composite sample over the control sample.
Figure 7. Variation of flexural strength at peak with composite samples
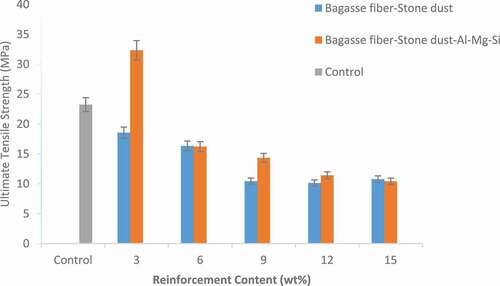
The variation of the ultimate tensile strength (UTS) with the composite and control samples is as shown in . From the results, it was observed that as the addition of reinforcements increases, the UTS decreases. Both hybrid-of-3 and hybrid-of-2 reduce the ultimate tensile strength of the composite samples as observed in the composite samples having 6–15 wt.% reinforcement content. However, hybrid-of-3 reinforced composite samples had better UTS at lower reinforcement content than the hybrid-of-2 reinforced composite samples. Furthermore, it was also observed that the ultimate tensile strength of the hybrid-of-3 reinforced composite at 3 wt.% reinforcement content had the optimum results with a value of 32 MPa. This showed that the addition of Al-Mg-Si particles at lower weight percent was able to enhance the UTS of the composite sample by 39%.
Figure 8. Variation of ultimate tensile strength with composite and control samples
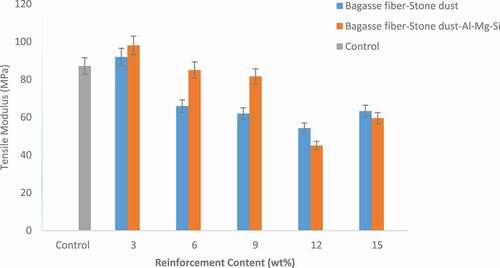
shows the variation of tensile modulus with composite samples. It was observed from the result that the addition of both reinforcements at lower weight fraction enhances the tensile modulus of the developed composite. However, the hybrid-of-3 reinforced composite samples exhibited better tensile modulus compared to their counterpart reinforced with hybrid-of-2. Furthermore, all the developed composite samples except for 3 wt.% composite samples revealed a linear decrease in tensile modulus of composite samples with an increase in reinforcement content up to 12 wt.% before showing a subtle increase at 15 wt.%, this was in agreement with the work of Verma et al. (Citation2012) which reported that an increase in reinforcement content could result in a decrease in the tensile modulus of composite samples. Comparatively, a hybrid-of-3 reinforced composite sample having 3 wt.% reinforcements content gave the optimum result with a value of 98 MPa resulting in 13% enhancement in the tensile modulus of the composite sample, this also showed that the addition of Al-Mg-Si alloy particles at lower weight per cent was responsible for the improved tensile modulus observed in the composite sample, this was followed by its counterpart reinforced with hybrid-of-2 of the same weight per cent with a value of 92 MPa.
Figure 9. Variation of tensile modulus with composite samples
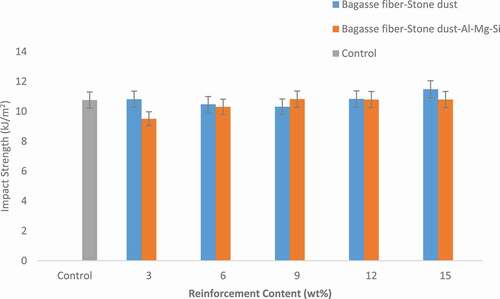
shows the variation of the impact strength with composite samples. It was observed from the result that the addition of both reinforcements steadily enhances the impact strength of the developed composite samples seeing that most of the developed composite samples had improved impact strength than the control sample with a value of 10.76 kJ/m2. However, hybrid-of-2 reinforced composite samples exhibited better impact strength compared to their counterparts reinforced with hybrid-of-3. Furthermore, hybrid-of-2 reinforced composite samples show a steady increase in impact strength of composite samples with an increase in reinforcement content, this agreed with the work of Zhang et al. (Citation2011) which reported that an increase in reinforcement content may result in a slow but steady increase in the impact strength of composite samples. A similar trend was also observed in the hybrid-of-3 reinforced composite samples, although hybrid-of-2 reinforced composite samples gave the best result when compared with their counterparts reinforced with hybrid-of-3. Comparatively, composite sample having 15 wt.% reinforcement in the hybrid-of-2 reinforced composite gave the best result with a value of 11.48 kJ/m2 while its counterpart reinforced with hybrid-of-3 has a value of 10.79 kJ/m2, this was followed by 9 wt.% hybrid-of-3 reinforced composite sample with a value of 10.82 kJ/m2 while its counterpart reinforced with hybrid-of-2 has a value of 10.31 kJ/m2.
Figure 10. Variation of the impact strength with composite samples
shows the wear resistance of composite samples reinforced with hybrid-of-2 and hybrid-of-3 as well as the control sample. From the results, it was observed that all the composites’ samples had better wear resistance compared to the control and wear resistance increases as the reinforcement content increases, this was in agreement with the work of Chelladurai and Arthanari (Citation2019) which reported that weight loss of samples decreases with increase in the reinforcement content of the matrix. This shows that the addition of these reinforcements improves the wear resistance of the developed composite samples. Composite samples with 15 wt.% reinforcement content for both the hybrid-of-2 and hybrid-of-3 with respective values of 0.7 g and 0.8 g gave the optimal results. The rate at which the samples exhibit wear resistance was seen to be increasingly higher in hybrid-of-2 than hybrid-of-3; hence, the reason for its least value at 15 wt% that culminated into been emerged the optimum. This implies that the addition of both reinforcements (hybrid-of-2 and hybrid-of-3) enhances the wear resistance of the developed composite samples by almost 53%. shows comparison of the average values of wear rates of developed composite samples with that of other researchers.
Figure 11. Variation of wear resistance with composite samples
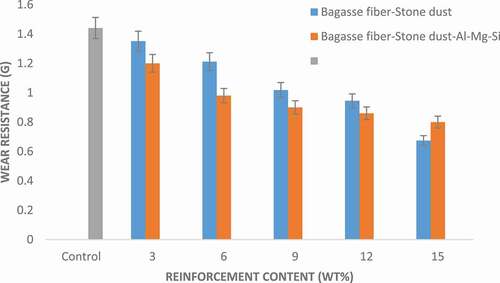
Table 1. Comparing the wear rates of developed composite samples with other researchers
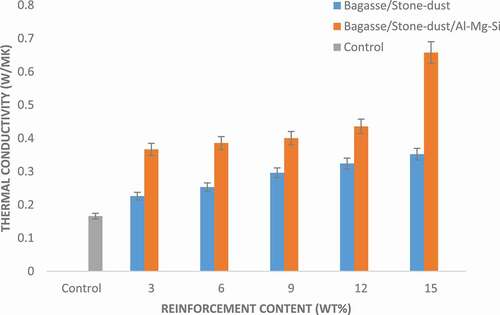
shows the thermal conductivity of the samples where it was observed that the addition of these reinforcements improved the thermal conductivity of the developed composite samples by over 200% when compared with the control sample. This showed that good thermal conductivity property can be achieved by the incorporation of these combinations of reinforcements in the composite samples, which is in agreement with the work of Zhang et al. (Citation2011). However, hybrid-of-2 reinforced composite samples showed a slight linear increase in thermal conductivity from 3–15 wt.% with a maximum value of 1.056 W/mK while their counterpart reinforced with hybrid-of-3 also exhibited a more pronounced linear increase in thermal conductivity with an increase in reinforcement content from 3–12 wt.%. A rapid increase in thermal conductivity at 15 wt.% reinforcement content with an optimum value of 1.972 W/mK was achieved with hybrid-of-3. It was noticed from the results that hybrid-of-3 reinforced composite samples gave the overall best result which may be attributed to the presence of the Al-Mg-Si which is a good conductor in the developed composite. Hence, the addition of a metallic conductor to a polymer can help improve the conductivity of the respective composites. This feat was interesting and further investigation may be carried out comparatively for virgin polymers.
Figure 12. Variation of thermal conductivity with composite samples
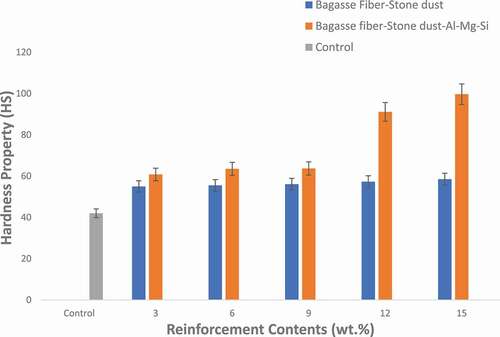
The hardness property is the ability of a material to withstand and/or resist surface indentation. shows the hardness property of the developed composite samples. From the results, it was observed that all the developed composite samples had better hardness property than the control sample; this is due to the addition of the reinforcements which has produced remarkable increase in the hardness property of the composite samples. Following the trends from previous results, a linear relationship was observed in both the hybrid-of-2 and hybrid-of-3 reinforced composites from 3 to 9 wt.% with respect to the hardness where the hardness values tend to increase as the reinforcement content increase. Furthermore, a sharp increase was observed in the hardness property of the hybrid-of-3 reinforced composite samples between 12 and 15 wt.% with a respective value of 91.1 and 99.7 HS. The result further revealed that hybrid-of-3 reinforced composite samples had better hardness property than their counterpart reinforced with hybrid-of-2; this may be due to the presence of the Al-Mg-Si particles in the hybrid-of-3 reinforced composite samples. Consequently, the optimum result was observed in the hybrid-of-3 reinforced composite sample having 15 wt.% reinforcement content with a value of 99.7 HS while the least result was observed in the hybrid-of-2 reinforced composite sample having 3 wt.% reinforcement content with a value of 55.0 HS. These resulted in overall percentage enhancements of 137% and 31%, respectively, when compared with the control sample. However, relating the hardness property and the wear behaviour of the developed composite samples using Archard law of wear (Equationeq. 4)(4)
(4) revealed that a linear relationship exists between the hardness property and the wear behaviour of composite samples in that the wear rate decrease as the hardness property of composite sample increases. This linearly proportional relationship can also be observed by comparing which shows the wear resistance and hardness property of the composite’s samples, respectively.
Where:
Q is the total volume of wear debris produced
K is a dimensionless constant
W is the total normal load
L is the sliding distance
H is the hardness of the softest contacting surfaces
Note that WL is proportional to the work done by the friction forces as described by Reye’s hypothesis. Also, K is obtained from experimental results and depends on several parameters. Among them are surface quality, chemical affinity between the material of two surfaces, surface hardness process and others.
Figure 13. Variation of hardness property with composite samples
SEM images as shown in reveal the surface morphologies of the control and hybrid-of-3 reinforced composite samples developed from recycled HDPE composites. These composite samples were selected due to their improved properties compared to hybrid-of-2 samples. The SEM evidence why composites developed with hybrid-of-3 reinforcements shows better results in terms of the mechanical, wear-resistance, and thermal conductivity properties than those developed with hybrid-of-2 reinforcements which show little or no enhancement. The presence of large voids, microcavity, and brittle mode of fracture was observed in the recycled HDPE of ) without reinforcement and this explains why the mechanical properties are lower and there is a low rate of thermal conductivity. In ) the SEM image showed that there is uniform dispersion of the bagasse fibre-stone dust-Al-Mg-Si particle reinforcements in the polymer matrix with little or no agglomeration of the fibres and/or particles. In ) the SEM image is slightly similar to that of ) except that the volume fraction of the hybrid-of-3 reinforcements is larger. This results in poor interaction between the reinforcements and polymer in the fibre/particle-matrix interphase, as evident in the presence of the fibre pull out. In ), the presence of void is conspicuously noticed as a result of the large particle size and/or volume fraction of the reinforcements and delamination is possible in this sample due to poor distribution of reinforcements in the matrix. This explains its modest mechanical properties as compared to that of ) and (c). A similar scenario is observed in ) although there is little improvement in the distribution of reinforcements amidst the considerably high-volume fraction of reinforcements as evident in the slight appearance of fibre and/or particle agglomeration, leading to the voids being considerably reduced in this sample. However, ) reveals the formation of large agglomerates which may be due to the presence of a considerably higher volume fraction of reinforcements. Therefore, the SEM results indicate that there is better interaction between the reinforcements and the polymer matrix at lower weight fractions. This confirms that the increase in the mechanical properties observed in the hybrid-of-3 reinforced composite sample was as a result of the uniform distribution of the fibres and/or particles in the HDPE matrix.
Figure 14. SEM micrographs with (a) recycled HDPE at x90; (b) 3 wt.% hybrid-of-3 reinforced composite at x95; (c) 6 wt.% hybrid-of-3 Reinforced Composite at x95; (d) 9 wt.% hybrid-of-3 reinforced composite at x90; (e) 12 wt.% hybrid-of-3 Reinforced composite at x95; (f) 15 wt.% hybrid-of-3 reinforced composite x91, at accelerating voltage of 10KV
Conclusions
It was revealed at the end of the research that the mechanical properties of the developed composites were mostly enhanced when a low quantity of the bagasse fibre-stone dust-Al-Mg-Si alloy particles was blended and compacted with rHDPE. Hybrid-of-3 reinforced composite samples were noticed to be more enhanced compared to hybrid-of-2 reinforced composite samples and control. It was learned that flexural strength at peak was enhanced by 205% with a value of 115 MPa, UTS by 39% with a value of 32.3157 MPa, Young’s Modulus by 13% with a value of 98.00 MPa, and wear resistance by 53% having a value of 0.8 g. Besides, there is a linear relationship between the reinforcements and wear resistance as well as the thermal conductivity of the composites. The SEM images revealed well-dispersed and uniform distribution of the composite constituents and the reason for the improved properties. This was confirmed by the increase in mechanical properties observed in hybrid-of-3 reinforced composite samples. Hence, reuse of waste materials as starting materials for the development of new product is an area of research that should be advanced.
Disclosure statement
No potential conflict of interest was reported by the author(s).
Additional information
Notes on contributors
I. O. Oladele
Isiaka Oluwole Oladele is a Lecturer, Researcher and Associate Professor in the Department of Metallurgical and Materials Engineering, Federal University of Technology, Akure with specialization in Composite Materials and Polymer Technology.
A. S. Taiwo
Samuel Anuoluwapo Taiwo is a Lecturer and Doctoral Researcher in the Department of Metallurgical and Materials Engineering, Federal University of Technology, Akure and School of Aerospace Transport and Manufacturing, Cranfield University Cranfield United Kingdom respectively with specialization in Composite Development, Polymer Technology and Welding Engineering.
T. A. Okegbemi
Ayobami Tekiulai Okegbemi is a graduate in the Department of Metallurgical and Materials Engineering, Federal University of Technology, Akure with specialization in Polymer Composite Development.
M. A. Adeyemi
Adesola Mulikat Adeyemi is a graduate in the Department of Metallurgical and Materials Engineering, Federal University of Technology, Akure with specialization in Polymer Composite Development.
S. O. Balogun
Samuel Olufemi Balogun is a Lecturer and Researcher in the Department of Science Laboratory Technology, Ogun State Institute of Technology, Igbesa with specialization in Environmental Engineering, Polymer Technology and Recovery of Valuable Materials from Engineering Waste.
References
- Abdellahi, S. B., and S. M. Hejazi. 2015. “Effect of Glass and Polypropylene Fibers in Cementitious Composites Containing Waste Stone Powder, Journal of Industrial Textiles 0 (00) 1–17, sagepub.co.uk/journalsPermissions.nav.” doi:https://doi.org/10.1177/1528083714567239.
- Adekomaya, O., and K. Ojo. 2016. “Adaptation of Plastic Waste to Energy Development in Lagos: An Overview Assessment.” Nigerian Journal of Technology 35 (2): 778–784. doi:https://doi.org/10.4314/njt.v35i1.12.
- AlmMa’adeed, M. A., N. Madi, A. Hodzic, and S. Rajendran (2018), “Reinforced Polymer Composites from Recycled Plastic.” Patent No. US 9309392B2. Available online: https://patents.google.com/patent/US9309392B2/en (accessed on 22 July 2020
- ASTM D2240-00. 2000. Standard Test Methods for Determining the Hardness of Soft and Hard Plastics. West Conshohocken, PA, North America.
- ASTM D638-10. 2010. Standards Test Method for Tensile Properties of Plastics. West Conshohocken, PA: ASTM International.
- ASTM D790-15. 2015. Standard Test Methods for Flexural Properties of Unreinforced and Reinforced Plastics and Electrical Insulating Materials. West Conshohocken, PA: ASTM International.
- Bahoria, B. V., D. K. Parbat, and P. B. Nagarnaik (2016). “XRD Analysis of Natural Sand, Quarry Dust, Waste Plastic (LDPE) to Be Used as a Fine Aggregate in Concrete”, International Conference on Processing of Materials, Minerals and Energy, Materials Today: Proceedings 5 ( 2016) 1432–1438, Ongole, Andhra Pradesh, India.
- Carrington, D. (2018), “Micro-Plastic Pollution in Oceans Is Far Worse than Feared,” The Guardian (UK Edition). Available online: https://www.theguardian.com/environment/2018/mar/12/microplastic-pollution-inoceans-is-far-greater-than-thought-say-scientists (accessed on 22 July 2020
- Chelladurai, S. J. S., and Arthanari R. 2019. “Investigation on Mechanical and Wear Properties of Zinc-Coated Steel Wires Reinforced LM6 Aluminium Alloy Composites by Squeeze Casting.” Surface Review and Letters 26 (1): 1850125. doi:https://doi.org/10.1142/S0218625X18501251.
- Chelladurai, S. J. S., S. S. Kumar, N. Venugopal, A. P. Ray, T. C. Manjunath, and S. Gnanasekaran. 2020. “A Review on Mechanical Properties and Wear Behaviour of Aluminium Based Metal Matrix Composites.” Materials Today: Proceedings. doi:https://doi.org/10.1016/j.matpr.2020.06.053.
- Da Luz, F. S., V. S. Candido, A. C. Da Silva, and S. N. Monteiro. 2018. “Thermal Behavior of Polyester Composites Reinforced with Green Sugarcane Bagasse Fiber, Characterization of Green Materials, the Minerals, Metals and Materials Society.” JOM 70 (10): 1965–1971. doi:https://doi.org/10.1007/s11837-018-3086-7.
- ISO 179-1:2010, “Plastics - Determination of Charpy Impact Properties - Part 1: Non-Instrumented Impact Test,” https://webstore.ansi.org/Standards/ISO/ISO1792010
- Kazemi-Najafi, S. 2013. “Use of Recycled Plastics in Wood Plastic Composites – A Review.” Waste Management 33 (9): 1898–1905. doi:https://doi.org/10.1016/j.wasman.2013.05.017.
- Kumar, N., P. Avinash, and A. Singh. 2020. “Effect of Fiber Orientation on the Tensile and Wear Properties of Flax Fiber-Reinforced Composites.” Advances in Mechanical Engineering. doi:https://doi.org/10.1007/978-981-15-0124-1_46.
- Mahali, K. P., and A. K. Sinha. 2015. “Utilization of Stone Dust with Plastic Waste for Improving the Subgrade in Highway Pavement Construction.” International Journal of Research in Engineering and Technology 04 (Issue: 6): e 2319-1163 | p 2321-7308 Available © http://www.ijret.org
- Monteiro, S. N., V. S. Candido, F. O. Braga, L. T. Bolzan, R. P. Weber, and J. W. Drelich. 2016. “Sugarcane Bagasse Waste in Composites for Multilayered Armor.” European Polymer Journal 78: 173–185. doi:https://doi.org/10.1016/j.eurpolymj.2016.03.031.
- Oladele, I. O. 2014. “Effect of Bagasse Fibre Reinforcement on the Mechanical Properties of Polyester Composites.” The Journal of the Association of Professional Engineers of Trinidad and Tobago 42 (1): 12–15.
- Oladele, I. O., A. A. Adediran, A. D. Akinwekomi, M. H. Adegun, O. O. Olumakinde, and O. O. Daramola. 2020b. “Development of Ecofriendly Snail Shell Particulate-Reinforced Recycled Waste Plastic Composites for Automobile Application.” Scientific World Journal (Hindawi) 1–8.
- Oladele, I. O., T. F. Omotosho, and A. A. Adediran. 2020a. “Polymer-Based Composites: An Indispensable Material for Present and Future Applications.” International Journal of Polymer Science 2020: 1–12. doi:https://doi.org/10.1155/2020/8834518.
- Oladele, I. O., A. S. Taiwo, O. O. Daramola, A. D. Akinwekomi, and O. G. Agbabiaka. 2019. “Mechanical, Wear Resistance and Water Absorption Properties of Particulate Palm Kernel Shell Reinforced Epoxy Composites for Automobile Application.” Journal of Engineering and Engineering Technology, Federal University of Technology, Akure 13 (Issue 1): 88–95.
- Peplow, M. 2016. “The Plastics Revolution: How Chemists are Pushing Polymers to New Limits.” Nature 536 (7616): 266–268. doi:https://doi.org/10.1038/536266a.
- Prakash, K. S., and C. H. Rao. 2016. “Study on Compressive Strength of Quarry Dust as Fine Aggregate in Concrete.” Advances in Civil Engineering 2016: 5. Article ID 1742769. doi:https://doi.org/10.1155/2016/1742769.
- Rajendran, S., L. Scelsi, A. Hodzic, C. Soutis, and M. A. Al-Maadeed. 2012. “Environmental Impact Assessment of Composites Containing Recycled Plastics.” Resour. Conserv. Recycl 60: 131–139. doi:https://doi.org/10.1016/j.resconrec.2011.11.006.
- Scelsi, L., A. Hodzic, C. Soutis, S. A. Hayes, S. Rajendran, M. A. AlMa’adeed, and R. Kahraman. 2011. “A Review on Composite Materials Based on Recycled Thermoplastics and Glass Fibres.” Plast. Rubber Compos 40 (1): 1–10. doi:https://doi.org/10.1179/174328911X12940139029121.
- Verma, D., P. C. Gope, M. K. Maheshwari, and R. K. Sharma. 2012. “Bagasse Fiber Composites: A Review.” Journal of Materials & Environmental Science 3: 1079–1092.
- Zeid, E. F. 2019. “Mechanical and Electrochemical Characteristics of Solutionized AA6061, AA6013 and AA5086 Aluminum Alloys.” Journal of Materials Research and Technology 8 (2): 1870–1877. doi:https://doi.org/10.1016/j.jmrt.2018.12.014.
- Zhang, S., . Y., X. Y. Cao, M. Ma, Y. C. Ke, J. K. Zhang, and F. S. Wang. 2011. “The Effects of Particle Size and Content on the Thermal Conductivity and Mechanical Properties of Al2O3/High Density Polyethylene Composites.” Express Polymer Letters 5 (7): 581–590. doi:https://doi.org/10.3144/expresspolymlett.2011.57.