
 ?Mathematical formulae have been encoded as MathML and are displayed in this HTML version using MathJax in order to improve their display. Uncheck the box to turn MathJax off. This feature requires Javascript. Click on a formula to zoom.
ABSTRACT
Over the last few decades, there has been increasing pressure on manufacturing organisations to reduce their current level of emissions due to governmental policies on climate change and increased awareness of sustainability. To mitigate these challenges, there is a need for industries to measure and analyse environmental wastes using tools like life cycle assessment (LCA). But, to implement LCA comprehensively, it is indispensable to look at barriers that deter successful implementation of this assessment tool. The present work deals with the identification, investigation, and prioritisation of LCA barriers in the manufacturing sector of India using advanced decision-making tool: Grey Relational Analysis (GRA) and further validation using Best Worst Method (BWM). It has been found that lack of top management support, lack of education and training of employee on environmental management, and lack of team effort across supply chain partners to collect effective data as key barriers to LCA implementation with grey relational grades 0.8296, 0.6294, and 0.6219, respectively. The corresponding BWM weights have been found as 0.3232, 0.1534, and 0.1039. The present work will enable the manufacturing organisations and practitioners to apply LCA through comprehensive understanding of barriers for improved organisational sustainability.
1. Introduction
In the current policy scenario, the energy demand will rise by 1.3% per year, without considering further pursuits to improve efficiency. This will lead to an upward march in energy-related emissions and grow strains on all the aspects of energy security. So, there is an immense need to improve global energy efficiency to ensure a sustainable future (EA (International Energy Agency) Citation2019). The traditional manufacturing methods and unlimited use of global resources have been led to a substantial increase in the level of greenhouse gases (GHGs) (Vinodh, Ruben, and Asokan Citation2016; Kaswan and Rathi Citation2020a). So, the manufacturing organisations should shift their operation dynamics from traditional to sustainability ones.
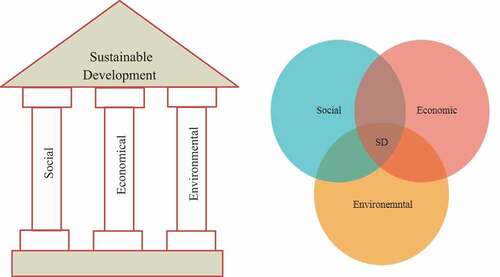
Sustainability and sustainable development (SD) are two key concepts that have received global attention in last few decades due to challenges faced in the areas of climate change, environmental protection, energy crisis, human well-being, etc. (Purvis, Mao, and Robinson Citation2019). Sustainability is defined as a process and mechanism to achieve sustainable development (Olawumi and Chan Citation2018). Axelsson et al. (Citation2011) stated that sustainability is the policy of society with the primary purpose of preventing natural resources. In contrast, SD is a more collective process that engages multiple stakeholders with different salience level and powers (Slimane Citation2012; Yadav et al., Citation2021). It makes a balance between preserving ecosystem and meets human needs. SD is meeting the needs of the present without compromising the ability of future generations to meet their own needs’ (WCED Citation1987). Environmental, social, and economic sustainability are three pillars of SD, and there must be harmony among them to achieve inclusive sustainability (). Environmental sustainability focuses on restraining human activities within the capability of the ecosystem and places prominence on qualitative human life (Sarkis and Zhu Citation2018; Kaswan and Rathi Citation2020b). Besides, economic sustainability considers the effective utilisation of resources to increase profitability and market share (Kaswan, Rathi, and Khanduja Citation2020). The social aspect of sustainability focuses on the social well-being of people, public consciousness, and participation from the local community and labour (Dehghan-Manshadi et al., Citation2007; Amrutha and Geetha Citation2020).
Figure 1. Pillars of sustainable development
In the sustainable development scenario, the level of CO2 emission from the industry has been increased from 5.1 Gigatonne (Gt) to 8.5 Gt. The countries have been decided their national determined contributions (NDC) and intended nationally determined contributions (INDC) under the Paris pact to reduce emissions (Conference of parties, 25). To achieve NDC and INDC, the manufacturing sector will have to enhance the material, energy efficiency, reduce dependency on fossil fuels together with development in clean technologies. The manufacturing organisations in developing nations like India have been developed policies like perform achieve and trade (PAT), zero effect zero defect (ZED) for the reduced emissions of the greenhouse gases (GHGs). But for the enhanced material and energy efficiency, the manufacturing organisations need to relook the operations and assessment of environmental and associated wastes. So, to mitigate environmental challenges, industrial organisations need a constructive measurement and analysis of various wastes and emissions. The effective measurement and analysis of various environmental and lean wastes depend on the effective execution of assessment tools like life cycle assessment (LCA), strategic environment assessment (SEA), environmental impact assessment (EIA), etc. (Tabesh et al. Citation2019).
LCA is a tool that provides a detailed environmental analysis of a system consisting of different unit processes (Abdelsalam et al. Citation2019). The quantification and investigation of wastes from a system using LCA further lead to the identification of major reasons for these non-value-added activities (Shi et al. Citation2019b). Once potential reasons for the source of wastes have been identified, they can be eradicated from the system (Rödger and Bey Citation2019). The success of green technology implementation is directly related to the effective execution of LCA as it is the main driving force to quantify or measure wastes (Kumar et al. Citation2016). Despite extensive study of LCA in developed nations, it found very limited applications in the manufacturing sector of India. The main reason for the same can be attributed to the barriers that hinder LCA implementation. In the literature, no study exists on prioritisation and analysis of LCA barriers in the manufacturing industry in the Indian context. So, this study deals with the identification and analysis of LCA barriers in the manufacturing environment of India. The LCA barriers have been identified through the literature survey and further validated through the experts’ opinions (manufacturing and academicians personnel). The industrial organisations lack financial resources and time so they cannot focus on all barriers for incremental implementation of green technologies through LCA. Hence, the present study further investigates and prioritises LCA barriers through a novel decision-making approach: Grey relational analysis (GRA).
The main benefits of GRA are the use of original data, easiness in the calculation, and understanding in the business environment . It offers distinct advantages over other MCDM methods in terms of its dynamic nature that gives opportunities for change in the number of parameters and transformations in computer algorithm for a quick solution. The results of the study have been validated using best worst method (BWM) and sensitivity analysis. BWM is an MCDM method developed by Rezaei (Van De Kaa, Kamp, and Rezaei Citation2017). It is a modified version of the analytical hierarchy process (AHP) that utilises fewer pairwise comparisons compared to AHP. This method utilises 2 n-3 pairwise comparisons as compared to 2 n-1 comparisons of AHP that results in more inconsistency and reliable results (Rezaei Citation2015).
The present study has been executed to identify barriers to LCA implementation in the manufacturing industries of India. Moreover, to prioritise the LCA barriers in the manufacturing industry using GRA and validation of the same through BWM. The remainder of the article is organised as follows. Section 2 presents pertinent literature in the field of LCA. Section 3 depicts the adopted research methodology and barriers to LCA execution. Section 4 is dedicated to the case of the concerned industrial organisation. Section 5 represents the discussion and implications of the present research. Section 6 concludes the research, highlights limitations, and future research for present research work.
2. Literature review
The literature review section consists of three sub-sections. The first subsections depict literature search methodology. The grey areas of LCA have been identified through pertinent literature of LCA in second sub-section. The research gaps are presented in the final subsection of this section.
2.1 Literature search methodology
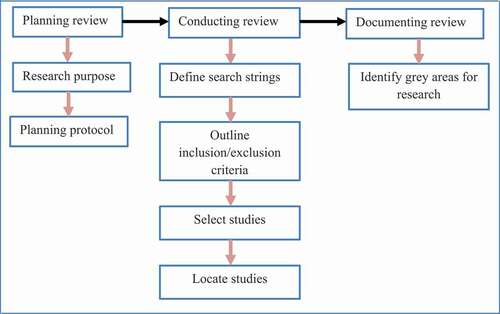
The present study considers the systematic literature review (SLR) of LCA through a systematic process. SLR uses an explicit and inclusive approach so that accuracy can be assured in the literature review(Singh and Rathi, Citation2019). In the first phase of SLR, research purpose and goal are identified. In the second phase of SLR, the literature review is conducted. Search strings of sustainability; barriers; life cycle assessment; grey relational analysis; best worst method have been used in this study. The search engine of Springer, Elsevier, Taylor and Francis, Wiley online library, were used to locate relevant research articles. In the present study, the criteria of years and sources have been as a basis for inclusion and exclusion articles. The articles published from 2000 to 2021 have been considered for the present study. Finally, any books, websites, chapters, reports were excluded and only papers published in high-quality journals have been considered for the present study. represents the systematic literature review methodology.
Figure 2. Systematic literature review methodology
2.2 Literature pertains to LCA
Life cycle assessment measures the impact of a product on the environment from raw materials to disposal stage (Belhadi et al. Citation2020). The main aim of LCA is to identify and quantify wastes, energy utilised, raw material consumed from the inception to the disposal of product a (Farooque et al. Citation2020). The results of several researchers manifested that adoption of LCA is a beneficial process to access the environmental and energy performance of a material.
Ensuing ISO 14,044, there are four major steps of LCA (1) scope and goal; (2) collection of data and analysis (3) Calculation of environmental effects (4) Explanation of results. The first step of LCA deals with outlining the goal and scope of the study under consideration. The goal is related to expressing the improvements that one wants to make in the existing process or system. The scope is defining the boundary of the study being considered. Here, it is decided that whether you are considering a unit process, the entire system, or the project for study. Once the goal and scope of the study are defined, the next step is the analysis of various inventories. The inventory analysis is done on the data set collected related to process energy, feedstock energy, wastes, and pollutants from the input stage to the finished goods (Mendoza Beltran et al. Citation2020). The next step of LCA is impact analysis; here, GHGs emissions, etc. are found from the existing process or system under consideration. The evaluation of the various wastes and emission potentials is made in the following LCA step. The possible green and sustainable solutions are proposed in the next stage of the LCA. The best solution is implemented in the subsequent stage of the LCA for reduced environmental-related emissions. The findings after the implementation of the potential solution are monitored in the subsequent step of LCA, and if substantial improvements are reported, then the adopted solution or methods is sustained.
The LCA came to picture in the 1960s and found its first application in packaging studies (Vink et al. Citation2003; Shafique et al. Citation2020). LCA has employed in industrial organisations for determining the eco-efficiency of the manufacturing process (Egilmez, Kucukvar, and Tatari Citation2013); assessment of the energy content in cement manufacturing (Huntzinger and Eatmon Citation2009); environmental assessment of 3D printing (Böckin and Tillman Citation2019); assessing the low energy use for cubicle manufacturing (Menoufi et al. Citation2012); assessment of energy for hot forming of automotive parts (Witik et al. Citation2011); greenhouse gas estimation for remanufacturing of air conditioners (Biswas and Rosano Citation2011), etc. LCA can be employed in design, development, marketing, and supply chain management functionality of a product in the manufacturing industries (Shi et al. Citation2019b). It also has been used to improve environmental performance, in environmental communications, and to support their environmental decision-making. Bevilacqua et al. (Citation2011) used LCA to determine the carbon footprint of different players involved in the supply chain of the textile industry. It has been found that the main contribution to the GHGs was transportation, electrical and thermal energy used. But LCA rare application pertains to the identification of environmental bottlenecks and marketing have been rarely reported. The increasing proclivity towards sustainability and circular economy has also led to an increased LCA use to meet targets of intergovernmental policies set by governments (Prasad et al. Citation2020).
Manufacturing industries are considered as the engine for the economic growth of a nation, but at the same time being faced with increasing pressure from government policies, society, and clients to work on environmental issues (Heidrich and Tiwary Citation2013). So, the manufacturing industries must estimate their current environmental impacts and restore methods to reduce same. LCA has been applied for the evaluation and description of environmental impacts of product systems of the manufacturing industry (Vieira, Calmon, and Coelho Citation2016). It provides a solid scientific base to identify environmental hotspots throughout the life cycle of products and potential shifting of impacts to mitigate the current challenge of climate. Research pursuits towards the implementation of the LCA methodology in manufacturing have been ramped up in the last decade. LCA has been used increasingly in the manufacturing industry of the developed nations to assess the current state of environmental footprint and to disseminate knowledge on environmental aspects to the stakeholders (Marconi and Favi Citation2020a). But it has found very limited application in the manufacturing industry of developing nations like India. The reasons for the same can be attributed to barriers from inside and outside the LCA community of stakeholders. LCA is a capital intensive, it demands the collection of authentic data across the entire supply chain, needs expertise or know-how, and funds for software and import of expertize knowledge (Farooque et al. Citation2020). The resistive culture of the organisation and lack of continuous improvement thinking further hinders LCA adoption (Cerdas et al. Citation2017). So, to enhance the adoption of LCA in the manufacturing sector of Indian context, it is imperative to find out specific barriers of LCA, understanding the barriers, and provides actions to overcome the same.
2.3 Research gaps
Despite a promising future and distinct advantages of LCA to assess environmental impacts and exploration of hot spots for improvement, its implementation has not attracted much attention in developing economies like India. LCA implementation as an environmental tool is restricted due to its multidimensionality, system-scale implementation, and financial constraints. The manufacturing industry in developing nation like India, constraints in funds, limited organisational resources, and cultural differences exhibits challenges to LCA implementation. In the literature, no study on the identification and analysis of LCA barriers pertains to the Indian manufacturing sector has been reported. Furthermore, the literature lacks evidence on the analysis of LCA barriers using GRA and validation using BWM. So, the said research gaps provide motivation and direction to conduct the present study. This study bridges the knowledge gap by investigating barriers to LCA implementation in India, the world’s one of the largest developing country that faces a tremendous challenge in environmental management.
3. Research methodology
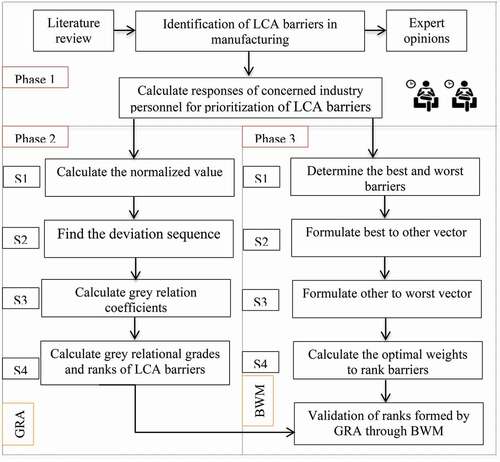
The present study consists of a three-phase methodology (). The first phase is related to the identification of barriers of LCA in manufacturing. Prioritisation of LCA barriers through GRA has been performed in the second phase whereas authentication of ranks of LCA barriers has been done using BWM and sensitivity analysis in the final phase. The various phases of the adopted research methodology are:
Figure 3. Research Methodology
Phase 1: LCA barriers identification
In the first phase, LCA barriers in the manufacturing environment of India have been found through a comprehensive literature survey. The successful adoption of green technologies depends on the measurement and analysis of various wastes that eventually depends on the effective and systematic application of LCA. An inclusive application of LCA depends on a few prominent factors known as barriers. Barriers to a tool or technology are those crucial characteristics that defer achieving the organisation’s objectives (Kaswan, Rathi, and Khanduja Citation2020). depicts the barriers of LCA in the manufacturing environment.
Table 1. LCA barriers in the manufacturing environment
The questionnaire centred survey has been used in this study to authenticate LCA barriers found through literature study. A five-point Likert scale questionnaire was formulated and experts (industrial and academics personnel) (102 experts) were asked to state the importance of enlisted barriers on the scale, 1 to 5, with ‘1ʹ tallies to the weakest and ‘5ʹ as the strongest barriers of LCA. To check the internal consistency of the questionnaire the reliability test (Cronbach’s alpha) has been used.
The value of the Chronbach’s alpha for the present work was found to be 0.863 and that is quite for the internal consistency of the instrument under consideration.
s2 × t (cov)/sum (var/cov) (Cortina 1993) (1)
The questionnaire was sent to the practitioners at the mid and high levels of management in the manufacturing industry and academicians (102 respondents). depicts the characteristics and demographic background of respondents. The potential experts were identified through the purposive sampling technique using the Linkedin profiles and personal contacts. The dataset received from all respondents was checked for the normality using the Shapiro–Wilk test and Q-Q plot in the statistical package for social sciences version 20 (SPSS 20). The value ‘p’ of the Shapiro–Wilk test (p ≥0.05) and data points distributed along the line in the Q-Q plot designate that data is normally distributed The p-value was found as 0.074 all data distributed along the line in Q-Q plot ().
Table 2. Characteristics and demographic background of respondents
Figure 4. Q-Q plo
To prioritise the barriers of LCA responses were collected from the coterie of the concerned manufacturing industry and these responses were further analysed in the respective second and third phases for the prioritisation of the LCA barriers using GRA and BWM.
Phase 2: Prioritisation of LCA barriers through GRA
The steps of GRA are as follows:
Step 1: The first step of the GRA method is normalisation or data processing. The responses collected from the personnel of the case industry against each alternative (barrier) was summed up. , represents the sum of response of barriers ‘i’ to personnel ‘o’ The normalised values are obtained using equation (2). Here,
represents the normalised value of the barriers ‘i’ to personnel ‘o’.
Step 2: In the second step of the GRA the deviation sequence () is calculated using equation (3).
Step 3: In this step, the grey relational coefficients () are calculated using equation (4). Here,
represents the minimum value of the deviation sequence and
designates the maximum value of the deviation sequence.
value considered here is 0.5.
Step 4: In this step, the grey relational grade () is estimated using equation (5). Here, ‘n’ is the number of respondent group of the case industry (in our case 5)
Phase 3: Prioritisation of LCA barriers through BWM
BWM is a multi-criterion decision-making method developed used to make decisions in a complex environment. The steps to execute BWM are:
Step 1: Determine the best and worst barrier
The first step of BWM is to determine, the best and the worst criteria or barrier, denoted by ‘P and ‘F’, respectively. Here, in this method, the most important and the least important barrier are found to calculate the relative weights of barriers (Ren, Liang, and Chan Citation2017).
Step 2: Construct best to others and others to worst vector
The second step of BWM is to determine the comparative preferences of the most important criterion or barrier over all the other criteria and that of other criteria over the least important criterion using scales adopted by (Saaty, 1980), see in the appendix. Then, the best to others () vector and the others to worst (
) vector can be found, as depicted in equations, (6) and (7), respectively.
where apj indicates the preference of best barrier ‘P’ over j
Here, indicates the preference of barrier j over the worst barrier ‘F’. It is clear that the value
for
Step 3: Calculate optimal weights to estimate the rank of LCA barriers
The optimal weight for a barrier is the one where for each pair of and
,
and
.
To meet all these conditions for j, where the maximum absolute differences, and
for all j is minimised. Considering the non-negativity and sum condition for the weights, the following problem has resulted
The problem of equation (8) can be transferred to the following linear programming model
min ξL
The optimal weights and the optimal value of ξ called ξ* have been found for the above mentioned LPP problem. The consistency ratio exhibits more persistent comparisons that have been estimated using equation (10). The value of consistency ratio varies between ‘0’ and ‘1’ and closeness to ‘0’ exhibit more consistent comparisons.
4. Case explanation
The industry is the focal point for the prosperity and economic growth of any nation. The industrial organisations contribute nearly one-fourth of CO2 emission and hence it must be the central part of clean technologies transition. So, to achieve operational and environmental excellence organisations must adopt sustainable practices. The present study has been carried out in a manufacturing industry in India. The organisation is in the business run for more than 40 years and its annual turnover is more than INR 5000 M. The foremost apprehension for case industry is negative environmental impacts from the generation of products, reuse of waste material and recycling of after use products. So, the industry is planning to adopt an eco-friendly approach that reduces emissions and maintain a balance between societal and economic dimensions of sustainability. But effective management of an environmentally friendly approach depends on the quantification, measurement, and analysis of various environmental and lean wastes. LCA is an effective tool that measures and investigates the various non-value-added activities of the system and process (Agrawal and Vindoh, Citation2020). The efficacious execution of LCA within an industrial organisation for a process or system is constrained by many factors called barriers. So, the said organisation has to identify the barriers in the path of LCA execution. The organisation cannot eliminate all the barriers at one time, so it is substantial to rank the barriers to identify the barrier which must be handled at the inception stage of LCA execution. In this study, prominent LCA barriers have been identified through literature and further validated through industrial personnel and academicians. The identified LCA barriers have been prioritised through GRA and validated by BWM. The entire process to prioritise LCA barriers was discussed with the said manufacturing industry to sensitise them about the current research work and potential benefits.
Computational steps of GRA for analysis of LCA barriers
The grey relational analysis has been executed through the following steps.
Step 1: The first step of the GRA method is normalisation or data processing. The responses collected from the personnel of the case industry against each alternative (barrier) has been summed up. depicts the responses from five coteries of industrial personnel (40 industrial personnel of the case industry) of the case industry corresponding to each barrier. The responses from managers (M), deputy managers (DM), engineers (E), assistant engineers (AE), and supervisors (S) have used in the present to prioritise the barriers. The normalised values have been obtained using equation (2). depicts the normalised values.
Table 3. Responses from industrial personnel
Table 4. Normalised values
Step 2: In the second step of the GRA, the deviation sequence () was calculated using equation (3). depicts the deviation sequence.
Table 5. Deviation sequence
Step 3: In this step, the grey relational coefficients () are calculated using equation (4). Here,
represents the minimum value of the deviation sequence and
designates the maximum value of the deviation sequence.
value considered here is 0.5. represents the grey relational coefficients.
Table 6. Grey relation coefficients
Step 4: In this step. the grey relational grades are estimated from the grey relational coefficients using equation (5). The corresponding ranks were estimated from the grey relational coefficients. depicts the grey relational grades and ranks of the LCA barriers in manufacturing.
Table 7. Grey relation grade and ranks of LCA barriers
The ranks of LCA barriers were further validated using the advanced decision-making approach: BWM.
Computational steps of BWM for validation of ranks of LCA barriers
The various steps for the execution of BWM are as follows:
Step 1: In the first step the best barrier and the worst barrier have been identified from the identified barriers through comprehensive discussion with the experts of the case industry. The barrier top management support (B7) has been identified as the best barrier and ambit of LCA implementation organisational ambience (B1) as the worst or least desirable.
Step 2: Subsequently, the preference of the best barrier over all other barriers have been identified. depicts the best to others and others to the worst preference.
Table 8. Preference table for barriers of LCA
Step 3: In this step, the preference of all other barriers over the worst barrier has been determined. also depicts the other to worst preference.
Step 4: Henceforth, to rank LCA barriers the optimal weights has been found by solving the LPP model of equation (9). The LCA barrier’s weight firstly has been found using different values of ξ and finally, the optimum weights have been found using the optimum value of ξ i.e. ξ*. The consistency ratio has been found using equation (10) to check consistency in results. The value of consistency ratio was found to be 0.0210, that is, 2.10%, this depicts highly consistent results. represents the ranks of LCA barriers using BWM. It has found the ranks of LCA barriers found same using GRA and BWM. So, the results of BWM have been found in agreement with the result of GRA, this states that the result found are consistent and reliable.
Table 9. BWM weighted matrix to rank LCA barriers
5. Discussion on findings
Life cycle assessment is an important tool to assess the ecological impacts and resources used throughout the entire life cycle of a product (Sonnemann and Margni Citation2015). It encompasses all the environmental aspects from the acquisition to disposal of the product. There has been a significant methodological development in the field of LCA from the last two decades. The LCA has been utilised in many industrial aspects like, to support corporate decision-making, managing the supply chain, optimising the process and making strategic marketing decisions (Butt et al. Citation2019; Lin, Man, and Ren Citation2020). But the execution of LCA is substantial work and bottlenecks called barriers hinder effective execution of this sustainability assessment tool. The present study identifies and investigates the barriers to LCA execution within a manufacturing organisation of India.
In this study, critical barriers to LCA execution in the manufacturing industry of India have been identified through a comprehensive literature survey and further validated through experts’ survey (manufacturing and academicians personnel). The prioritisation of barriers was done through GRA and further validated using BWM. It has been recognised that a lack of management support is the most significant barrier to LCA execution. The management provides comprehensive training to the industrial personnel in environmental indices, type of data set required, and interpretation of the same. The top management commitment play a vital for the adoption of a sustainable development approach through the interlining organisational objectives with a new approach and building a culture of learning (Luthra et al. Citation2016). The inclusive management obligation, ample financial resources, and thorough training of employees lead to the build a culture of sustainability in the organisations (Mangla, Govindan, and Luthra Citation2017).
Lack of education and training of employee on environmental management and lack of team effort across supply chain partners are also the major barriers to the success of the LCA programme. Ghazilla et al. (Citation2015) also identified a lack of expertise as one of the key barriers to sustainable development adoption for SMEs. LCA needs specialised expertise knowledge or know-how and analysts of data obtained from the team through feedback measures established at the various points of a dedicated system. The LCA execution leads to the substantial financial burden on the organisation for training, purchase of LCA software packages, and feedback devices. Álvarez Jaramillo, Zartha Sossa, and Orozco Mendoza (Citation2019) found the lack of financial capital as one of the major barriers for sustainability incorporation in SMEs. So, industrials organisations have to invest a huge capital for execution of sustainable development programmes. Despite LCA evolution, there is still an absence of LCA framework that provides a systematic way for its execution in the manufacturing sector to developing nations. The manufacturing organisations to be competitive in the global market have to embrace not only clean technologies measures within operational dynamics but also in their culture.
The manufacturing organisations have to interlink clean technologies with the organisational objectives to embed sustainability in their culture. The success of LCA implementation also depends on how well you decide the ambit of the study. The extended scope demands more data and complexities increase as interrelations amplified with the numbers of processes and systems. LCA execution depends on the effective collection of data and interpretation of the same in various indices for improvement in the current system or process. LCA considers all the aspects of sustainability (social, economic, and environmental), system, and process from a life cycle perspective. The top-management assistance, proper training, effective feedback measures, proper data measures, and mining methods lead to effective LCA implementation. Moreover, embedding organisational objectives with clean technologies leads to 3ʹ R culture (reduce, reuse, and rework) in the industry which in turn results in high material and energy efficiency.
5.1 Sensitivity analysis
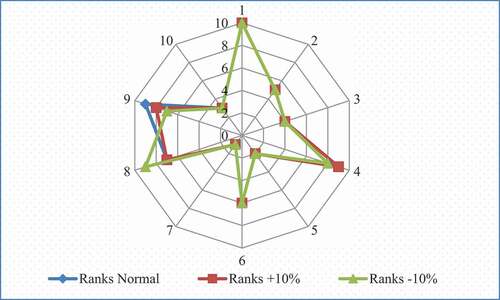
In the present study, integrated GRA-BWM method has been used to analyse LCA barriers in manufacturing. Besides, to have more robustness in results authors performed a sensitivity analysis. The sensitivity analysis is an important tool to check the biasness in the results. Sensitivity analysis is performed by changing the responses of the personnel with varying percentage and noting down changes in the output parameters. It has been applied for studying the behaviour of output for change in input parameters like meta model-based optimisation in building energy models (Eisenhower et al. Citation2012); environmental modelling for uncertainty assessment (Pianosi et al. Citation2016); analysing the dominant controls of the system and support robust decision-making, etc. (Anderson et al. Citation2014). depicts changing GRGs and ranks of the barriers during different runs of the sensitivity analysis. It has been found that for top-ranked barriers, the GRGs did not change significantly during different runs of sensitivity analysis. So, ranks of top-six rank barriers have been found the same throughout during different runs and this signifies the robustness in the results of the study. depicts ranks of LCA barriers using radar chart for the different run of the sensitivity analysis. It has been found that for top-ranked barriers (B7, B5, B10, B3, B2, and B6) the radar chart for different degree of responses skewed to one point that signifies that there is no variation in the ranks of the said barriers for different trials of the sensitivity analysis. The trends of the change in GRGs of barriers in table 15 and ranks in the radar chart present the same pattern. So, the ranks of the barriers did not change considerably, which depicts the character of a consistent system. Therefore, the sensitivity analysis confirmed that the model and results presented in the study are consistent and reliable.
Table 10. Sensitivity Analysis
Figure 5. Radar chart for ranking LCA barriers using sensitivity analysis
5.2 Implications
The increasing awareness about sustainability, intergovernmental pressure, and globalised pressure to cut the carbon emissions has been forced industries to changes traditional methods to sustainable ones (Oztemel and Gursev Citation2020). So, there is a need to adopt clean technologies measures that mitigate emission and leads to a healthy work ambience. The adoption of environmentally friendly management approaches depends on the effective measurement of associated emissions and wastes in the process or system. LCA is an effective tool to estimate environmental wastes in a system. The present research work facilitates industrial organisations and managers to implement LCA through a systematic understanding of contextual relationships among the barriers.
The barrier ‘Lack of financial resources’ can be overcome by setting up financial institutions so that credit access make it easier for industrial settings that want to implement LCA to access environmental performance. The supportive government fiscal policies will facilitate banks about probable risks involved in releasing funds to LCA adopting organisations. The industry can use different types of plans to enhance their internal competencies to execute LCA. The organisation should develop a memorandum of understanding with environmental centred organisations, academic and research institutes to get opportunities for finance, technical knowledge, and capacity enhancement through the training programs. This collaborative strategy will lead to a reduction in the organisation’s expenses that otherwise go in vain by providing training from outer agencies. The agencies like the UN climate change learning partnership (UNCC: Learn) and US environmental protection agencies provide free resources for climate literacy, mitigation action for carbon footprint, and guide industrial organisations to become more sustainable through the adaptation of environment management tool like LCA. This type of work will lead to the removal of resistive organisation culture to new practices like LCA, lack of education and training of employee on environmental management, lack of management support, and link of green technologies with organisational objectives. Barriers like ‘lack of effective data collection’ can be overcome by appropriate implementation of visual/statistical control, establishment of real-time data collection measures, and electronic data interchange system. So, LCA major barriers can be overcome by making everyone in the organisation responsible for sustainability, adopting the culture of mutual learning and cooperation that helps to collect effective data, generates expertise knowledge, and identification and assessment of environmental hotspots. The manufacturing organisations in the developing nations lack financial resources and time so they cannot eradicate all the barriers in the single run. Prioritisation of LCA barriers provides direction to industrial managers for systematical removal of LCA barriers by focusing on the prominent barriers during the initial stage of the removal plan.
6. Conclusion
The LCA has been recognised as an important tool for sustainable development through assessment and analysis of the carbon footprints and associated wastes. To mitigate environmental concerns and meet the demands for sustainable products, industrial organisations need to analyse and rank the barriers to LCA implementation. Ten barriers pertain to LCA implementation in the manufacturing industry of India have been identified and prioritised through GRA and further validated through BWM. It can be concluded that top management whole hearty cooperation, comprehensive education, and training of the employee in various aspects of LCA and culture of teamwork are the most central areas for effective execution of the LCA program in developing economies like India. The manufacturing organisations can mitigate negative environmental impacts and implement LCA by removing the barriers of effective data assimilation, feedback both upstream and downstream of the process, and linking green initiatives with the organisational objectives of the manufacturing organisations.
Despite several contributions, the present study has its limitations. Given the infancy of LCA interventions in research and practice pertains to the manufacturing sector in developing nations, the analysis presented in this work was based on the expert’s opinion, so the biasness in the experts’ judgement may prevail. Although, it is expected that findings may have wider applicability further studies in different manufacturing industries, size, and country context should be undertaken to validate findings. Finally, in the present work, 10 prominent barriers that hinder LCA implementation in manufacturing industries of India have been identified, but in offing, with growing literature of LCA, the list can be extended by including some other barriers that may arise from rapid organisational and technological advancements.
Overall, the study provides some useful insights into the implementation of LCA in the manufacturing environment, encouraging in these ways its application. So, it provides trustworthy evidence for practitioners and industrialists of LCA barriers that hinders its execution. Hence, empirically validation of barriers in different manufacturing industries according to size, type, and culture is a future research agenda derived from the current research work. Moreover, to understand the contextual relationship among the barriers interpretive structural modelling (ISM) and structural equation modelling (SEM) can be used by the potential researchers. In future, barriers of blockchain-based LCA barriers can also found and underlining relationship among the same can be adjudged using multi-criterion decision-making (MCDM) approaches like intuitionistic fuzzy decision-making trial and evaluation laboratory (IF-DEMATEL).
Nomenclature
LCA Life cycle assessment
GRA Grey relational analysis
BWM Best worst method
GHGs Greenhouse gases
SD Sustainable development
NDC National determined contributions
INDC Intended national determined contributions
ZED Zero effect zero defect
PAT Perform achieve and trade
SEA Strategic environment assessment
EIA Environmental impact assessment
MCDM Multi criterion decision-making
AHP Analytical hierarchy process
SLR Systematic literature review
ISM Interpretive structural modelling
SEM Structural equation modelling
IF-DEMATEL Intuitionistic fuzzy decision-making trial and evaluation laboratory
Disclosure statement
No potential conflict of interest was reported by the author(s).
Additional information
Notes on contributors
Mahender Singh Kaswan
Mahender Singh Kaswan is working as an Assistant Professor in the School of Mechanical Engineering Lovely Professional University, Punjab, India. His areas of research are: Green Lean Six Sigma, Life cycle assessment, Sustainability and Green Manufacturing. As inspired researcher, he has presented papers in national and international conferences and published articles in various reputed journals. He is adept in optimization and decision making techniques like: ISM, Preference Ranking Organization Method for Enrichment of Evaluations, BWM, Decision-Making Trial and Evaluation Laboratory.
Rajeev Rathi
Rajeev Rathi is working as an Associate Professor in the School of Mechanical Engineering Lovely Professional University, Punjab, India. His areas of research are: Six Sigma, Lean Six Sigma, Green Lean Six Sigma, LCA, Sustainability and Green Manufacturing. As inspired researcher, he has presented many papers in national and international conferences and published articles in various reputed journals. He is adept in optimization and decision making techniques like: ISM, Preference Ranking Organization Method for Enrichment of Evaluations, Best worst method, Decision-Making Trial and Evaluation Laboratory.
References
- Abdelsalam, E., O. Hijazi, M. Samer, I. H. Yacoub, A. S. Ali, R. H. Ahmed, and H. Bernhardt. 2019. “Life Cycle Assessment of the Use of Laser Radiation in Biogas Production from Anaerobic Digestion of Manure.” Renewable Energy 142: 130–136. doi:https://doi.org/10.1016/j.renene.2019.04.090.
- Agrawal, R., and S. Vinodh. 2020. “Life Cycle Assessment of an Additive Manufactured Automotive Component.” In Advances in Additive Manufacturing and Joining, edited by Shunmugam M., and M. Kanthababu, 219–228. Singapore: Springer.
- Álvarez Jaramillo, J., J. W. Zartha Sossa, and G. L. Orozco Mendoza. 2019. “Barriers to Sustainability for Small and Medium Enterprises in the Framework of Sustainable Development—a Literature Review.” Business Strategy and the Environment 28 (4): 512–524.
- Amrutha, V. N., and S. N. Geetha. 2020. “A Systematic Review on Green Human Resource Management: Implications for Social Sustainability.” Journal of Cleaner Production 247: 119131. doi:https://doi.org/10.1016/j.jclepro.2019.119131.
- Anderson, B., E. Borgonovo, M. Galeotti, and R. Roson. 2014. “Uncertainty in Climate Change Modeling: Can Global Sensitivity Analysis Be of Help?.” Risk Analysis 34 (2): 271–293. doi:https://doi.org/10.1111/risa.12117.
- Axelsson, R., P. Angelstam, M. Elbakidze, N. Stryamets, and K. E. Johansson. 2011. “Sustainable Development and Sustainability: Landscape Approach as a Practical Interpretation of Principles and Implementation Concepts.” Journal of Landscape Ecology 4 (3): 5–30. doi:https://doi.org/10.2478/v10285-012-0040-1.
- Belhadi, A., S. S. Kamble, S. A. R. Khan, F. E. Touriki, and D. Kumar. 2020. “Infectious Waste Management Strategy during COVID-19 Pandemic in Africa: An Integrated Decision-Making Framework for Selecting Sustainable Technologies.” Environmental Management 66 (6): 1085–1104. doi:https://doi.org/10.1007/s00267-020-01375-5.
- Bevilacqua, M., F. E. Ciarapica, G. Giacchetta, and B. Marchetti. 2011. “A Carbon Footprint Analysis in the Textile Supply Chain.” International Journal of Sustainable Engineering 4 (1): 24–36. doi:https://doi.org/10.1080/19397038.2010.502582.
- Bhander, G. S., M. Hauschild, and T. McAloone. 2003. “Implementing Life Cycle Assessment in Product Development.” Environmental Progress 22 (4): 255–267. doi:https://doi.org/10.1002/ep.670220414.
- Biswas, W., and M. Rosano. 2011. “A Life Cycle Greenhouse Gas Assessment of Remanufactured Refrigeration and Air Conditioning Compressors.” International Journal of Sustainable Manufacturing 2 (2/3): 222–236. doi:https://doi.org/10.1504/IJSM.2011.042153.
- Böckin, D., and A. M. Tillman. 2019. “Environmental Assessment of Additive Manufacturing in the Automotive Industry.” Journal of Cleaner Production 226: 977–987. doi:https://doi.org/10.1016/j.jclepro.2019.04.086.
- Bojarski, A. D., J. M. Laínez, A. Espuña, and L. Puigjaner. 2009. “Incorporating Environmental Impacts and Regulations in a Holistic Supply Chains Modeling: An LCA Approach.” Computers & Chemical Engineering 33 (10): 1747–1759. doi:https://doi.org/10.1016/j.compchemeng.2009.04.009.
- Butt, A. A., J. T. Harvey, D. Reger, A. Saboori, M. Ostovar, and M. Bejarano. 2019. Life-Cycle Assessment of Airfield Pavements and Other Airside Features: Framework, Guidelines, and Case Studies (No. DOT/FAA/TC-19/2). Washington, DC.
- Cerdas, F., S. Thiede, M. Juraschek, A. Turetskyy, and C. Herrmann. 2017. “Shop-floor Life Cycle Assessment.” Procedia CIRP 61: 393–398. doi:https://doi.org/10.1016/j.procir.2016.11.178.
- Cha, J. M., and S. H. Suh. 2011. “Developing a Conceptual Framework for UT Based LCA.” In Glocalized Solutions for Sustainability in Manufacturing, edited by Hesselbach J., and C. Herrmann, 587–592. Berlin, Heidelberg: Springer.
- Clark, G., and B. De Leeuw. 1999. “How to Improve Adoption of LCA.” The International Journal of Life Cycle Assessment 4 (4): 184–187. doi:https://doi.org/10.1007/BF02979492.
- D’Incognito, M., N. Costantino, and G. C. Migliaccio. 2015. “Actors and Barriers to the Adoption of LCC and LCA Techniques in the Built Environment.” Built Environment Project and Asset Management (2). doi:https://doi.org/10.1108/BEPAM-12-2013-0068.
- Dehghan-Manshadi, B., H. Mahmudi, A. Abedian, and R. Mahmudi. 2007. “A Novel Method for Materials Selection in Mechanical Design: A Combination of Non-linear Normalization and A Modified Digital Logic Method.” Materials & Design 28 (1): 8–15. doi:https://doi.org/10.1016/j.matdes.2005.06.023.
- EA (International Energy Agency). 2019. Energy Access Outlook 2017: World Energy Outlook Special Report, OECD/IEA, Paris.
- Egilmez, G., M. Kucukvar, and O. Tatari. 2013. “Sustainability Assessment of US Manufacturing Sectors: An Economic Input Output-based Frontier Approach.” Journal of Cleaner Production 53: 91–102. doi:https://doi.org/10.1016/j.jclepro.2013.03.037.
- Eisenhower, B., Z. O’Neill, S. Narayanan, V. A. Fonoberov, and I. Mezić. 2012. “A Methodology for Meta-model Based Optimization in Building Energy Models.” Energy and Buildings 47: 292–301. doi:https://doi.org/10.1016/j.enbuild.2011.12.001.
- Farooque, M., V. Jain, A. Zhang, and Z. Li. 2020. “Fuzzy DEMATEL Analysis of Barriers to Blockchain-based Life Cycle Assessment in China.” Computers & Industrial Engineering 147: 106684. doi:https://doi.org/10.1016/j.cie.2020.106684.
- Ghazilla, R. A. R., N. Sakundarini, S. H. Abdul-Rashid, N. S. Ayub, E. U. Olugu, and S. N. Musa. 2015. “Drivers and Barriers Analysis for Green Manufacturing Practices in Malaysian SMEs: Preliminary Findings.” Procedia Cirp 26 (1): 658–663. doi:https://doi.org/10.1016/j.procir.2015.02.085.
- Heidrich, O., and A. Tiwary. 2013. “Environmental Appraisal of Green Production Systems: Challenges Faced by Small Companies Using Life Cycle Assessment.” International Journal of Production Research 51 (19): 5884–5896. https://www4.unfccc.int/sites/NDCStaging/Pages/All.aspx. doi:https://doi.org/10.1080/00207543.2013.807372.
- Huntzinger, D. N., and T. D. Eatmon. 2009. “A Life-cycle Assessment of Portland Cement Manufacturing: Comparing the Traditional Process with Alternative Technologies.” Journal of Cleaner Production 17 (7): 668–675. doi:https://doi.org/10.1016/j.jclepro.2008.04.007.
- Kaswan, M. S., and R. Rathi. 2020a. “Green Lean Six Sigma for Sustainable Development: Integration and Framework.” Environmental Impact Assessment Review 83: 106396. July. doi:https://doi.org/10.1016/j.eiar.2020.106396.
- Kaswan, M. S., and R. Rathi. 2020b. “Investigating the Enablers Associated with Implementation of Green Lean Six Sigma in Manufacturing Sector Using Best Worst Method.” Clean Technologies and Environmental Policy 22 (4): 1–12. doi:https://doi.org/10.1007/s10098-020-01827-w.
- Kaswan, M. S., R. Rathi, and D. Khanduja. 2020. “Integration of Green Lean Six Sigma: A Novel Approach for Sustainable Development.” Int. J. Six Sigma and Competitive Advantage 12 (4): 389–405. doi:https://doi.org/10.1504/IJSSCA.2020.112369.
- Kumar, S., S. Luthra, K. Govindan, N. Kumar, and A. Haleem. 2016. “Barriers in Green Lean Six Sigma Product Development Process: An ISM Approach.” Production Planning & Control 27 (7–8): 604–620.
- Lin, R., Y. Man, and J. Ren. 2020. “Life Cycle Decision Support Framework: Method and Case Study.” In Life Cycle Sustainability Assessment for Decision-Making, 175–204. Elsevier.
- Luthra, S., S. K. Mangla, L. Xu, and A. Diabat. 2016. “Using AHP to Evaluate Barriers in Adopting Sustainable Consumption and Production Initiatives in a Supply Chain.” International Journal of Production Economics 181: 342–349. doi:https://doi.org/10.1016/j.ijpe.2016.04.001.
- Mangla, S. K., K. Govindan, and S. Luthra. 2017. “Prioritizing the Barriers to Achieve Sustainable Consumption and Production Trends in Supply Chains Using Fuzzy Analytical Hierarchy Process.” Journal of Cleaner Production 151: 509–525. doi:https://doi.org/10.1016/j.jclepro.2017.02.099.
- Marconi, M., and C. Favi. 2020a. “Eco-design Teaching Initiative within a Manufacturing Company Based on LCA Analysis of Company Product Portfolio.” Journal of Cleaner Production 242: 118424. doi:https://doi.org/10.1016/j.jclepro.2019.118424.
- Mendoza Beltran, A., B. Cox, C. Mutel, D. P. Van Vuuren, D. Font Vivanco, S. Deetman, and A. Tukker. 2020. “When the Background Matters: Using Scenarios from Integrated Assessment Models in Prospective Life Cycle Assessment.” Journal of Industrial Ecology 24 (1): 64–79. doi:https://doi.org/10.1111/jiec.12825.
- Menoufi, K., A. Castell, L. Navarro, G. Pérez, D. Boer, and L. F. Cabeza. 2012. “Evaluation of the Environmental Impact of Experimental Cubicles Using Life Cycle Assessment: A Highlight on the Manufacturing Phase.” Applied Energy 92: 534–544. doi:https://doi.org/10.1016/j.apenergy.2011.11.020.
- Olawumi, T. O., and D. W. Chan. 2018. “A Scientometric Review of Global Research on Sustainability and Sustainable Development.” Journal of Cleaner Production 183: 231–250. doi:https://doi.org/10.1016/j.jclepro.2018.02.162.
- Oztemel, E., and S. Gursev. 2020. “Literature Review of Industry 4.0 And Related Technologies.” Journal of Intelligent Manufacturing 31 (1): 127–182.
- Pianosi, F., K. Beven, J. Freer, J. W. Hall, J. Rougier, D. B. Stephenson, and T. Wagener. 2016. “Sensitivity Analysis of Environmental Models: A Systematic Review with Practical Workflow.” Environmental Modelling and Software 79: 214–232. doi:https://doi.org/10.1016/j.envsoft.2016.02.008.
- Prasad, S., A. Singh, N. E. Korres, D. Rathore, S. Sevda, and D. Pant. 2020. “Sustainable Utilization of Crop Residues for Energy Generation: A Life Cycle Assessment (LCA) Perspective.” Bioresource Technology 303: 122964. doi:https://doi.org/10.1016/j.biortech.2020.122964.
- Purvis, B., Y. Mao, and D. Robinson. 2019. “Three Pillars of Sustainability: In Search of Conceptual Origins.” Sustainability Science 14 (3): 681–695. doi:https://doi.org/10.1007/s11625-018-0627-5.
- Ren, J., H. Liang, and F. T. Chan. 2017. “Urban Sewage Sludge, Sustainability, and Transition for Eco-City: Multi-criteria Sustainability Assessment of Technologies Based on Best-worst Method.” Technological Forecasting and Social Change 116: 29–39. doi:https://doi.org/10.1016/j.techfore.2016.10.070.
- Rezaei, J. 2015. “Best-worst Multi-criteria Decision-making Method.” Omega 53: 49–57. doi:https://doi.org/10.1016/j.omega.2014.11.009.
- Rödger, J. M., and N. Bey. 2019. “Sustainability Assessment in Manufacturing and Target Setting in Highly Automated Production.” In Eco-Factories of the Future, edited by Sebastian Thiede Christoph Herrmann, 69–84. Cham: Springer.
- Rossi, M., M. Germani, and A. Zamagni. 2016. “Review of Ecodesign Methods and Tools.” Barriers and Strategies for an Effective Implementation in Industrial Companies. Journal of Cleaner Production 129: 361–373.
- Sarkis, J., and Q. Zhu. 2018. “Environmental Sustainability and Production: Taking the Road Less Travelled.” International Journal of Production Research 56 (1–2): 743–759. doi:https://doi.org/10.1080/00207543.2017.1365182.
- Shafique, M., A. Azam, M. Rafiq, M. Ateeq, and X. Luo. 2020. “An Overview of Life Cycle Assessment of Green Roofs.” Journal of Cleaner Production 250: 119471. doi:https://doi.org/10.1016/j.jclepro.2019.119471.
- Shi, J., Y. Wang, S. Fan, Q. Ma, and H. Jin. 2019b. “An Integrated Environment and Cost Assessment Method Based on LCA and LCC for Mechanical Product Manufacturing.” The International Journal of Life Cycle Assessment 24 (1): 64–77. doi:https://doi.org/10.1008/s11367-018-1497-x.
- Shin, S. J., S. H. Suh, I. Stroud, and S. Yoon. 2017. “Process-oriented Life Cycle Assessment Framework for Environmentally Conscious Manufacturing.” Journal of Intelligent Manufacturing 28 (6): 1481–1499. doi:https://doi.org/10.1007/s10845-015-1062-4.
- Singh, M., and R. Rathi. 2019. “A Structured Review of Lean Six Sigma in Various Industrial Sectors.” International Journal of Lean Six Sigma 10 (2): 622–664. doi:https://doi.org/10.1108/IJLSS-03-2018-0018.
- Slimane, M. 2012. “Role and Relationship between Leadership and Sustainable Development to Release Social, Human, and Cultural Dimension.” Procedia-Social and Behavioral Sciences 41: 92–99. doi:https://doi.org/10.1016/j.sbspro.2012.04.013.
- Sonnemann, G., and M. Margni, Eds.. 2015. Life Cycle Management. New York London: Springer Dordrecht Heidelberg.
- Tabesh, M., M. F. Masooleh, B. Roghani, and S. S. Motevallian. 2019. “Life-Cycle Assessment (LCA) of Wastewater Treatment Plants: A Case Study of Tehran, Iran.” International Journal of Civil Engineering 17 (7): 1155–1169. doi:https://doi.org/10.1007/s40999-018-0375-z.
- Testa, F., B. Nucci, F. Iraldo, A. Appolloni, and T. Daddi. 2017. “Removing Obstacles to the Implementation of LCA among SMEs: A Collective Strategy for Exploiting Recycled Wool.” Journal of Cleaner Production 156: 923–931. doi:https://doi.org/10.1016/j.jclepro.2017.04.101.
- Testa, F., B. Nucci, S. Tessitore, F. Iraldo, and T. Daddi. 2016. “Perceptions on LCA Implementation: Evidence from a Survey on Adopters and Nonadopters in Italy.” The International Journal of Life Cycle Assessment 21 (10): 1501–1513. doi:https://doi.org/10.1007/s11367-016-1106-9.
- Van De Kaa, G., L. Kamp, and J. Rezaei. 2017. “Selection of Biomass Thermochemical Conversion Technology in the Netherlands: The Best-worst Method Approach.” Journal of Cleaner Production 166: 32–39. doi:https://doi.org/10.1016/j.jclepro.2017.07.052.
- Vieira, D. R., J. L. Calmon, and F. Z. Coelho. 2016. “Life Cycle Assessment (LCA) Applied to the Manufacturing of Common and Ecological Concrete: A Review.” Construction and Building Materials 124: 656–666. doi:https://doi.org/10.1016/j.conbuildmat.2016.07.125.
- Vink, E. T., K. R. Rabago, D. A. Glassner, and P. R. Gruber. 2003. “Applications of Life Cycle Assessment to NatureWorks™ Polylactide (PLA) Production.” Polymer Degradation and Stability 80 (3): 403–419. doi:https://doi.org/10.1016/S0141-3910(02)00372-5.
- Vinodh, S., R. B. Ruben, and P. Asokan. 2016. “Life Cycle Assessment Integrated Value Stream Mapping Framework to Ensure Sustainable Manufacturing: A Case Study.” Clean Technologies and Environmental Policy 18 (1): 279–295. doi:https://doi.org/10.1007/s10098-015-1016-8.
- WCED. 1987. “Our Common Future.” In Brundtland Report, 1–300. Brundtland: World Commission on Environment and Development- Oxford University Press.
- Witik, R. A., J. Payet, V. Michaud, C. Ludwig, and J. A. E. Månson. 2011. “Assessing the Life Cycle Costs and Environmental Performance of Lightweight Materials in Automobile Applications.” Composites. Part A, Applied Science and Manufacturing 42 (11): 1694–1709. doi:https://doi.org/10.1016/j.compositesa.2011.07.024.
- Yadav, V., P. Gahlot, M. S. Kaswan, and R. Rathi. 2021. “Green Lean Six Sigma Critical Barriers: Exploration and Investigation for Improved Sustainable Performance.” Int. J. Six Sigma and Competitive Advantage, In Press.
Appendix
Table A1: Comparative scale of Saaty method (Saaty, 1980)