
 ?Mathematical formulae have been encoded as MathML and are displayed in this HTML version using MathJax in order to improve their display. Uncheck the box to turn MathJax off. This feature requires Javascript. Click on a formula to zoom.
ABSTRACT
Eco-houses play a pivotal role in reducing greenhouse gas emissions. To implement such a concept, the current Conventional Design Process (CDP) needs to be improved. Thus, Integrated Design Process (IDP) was recently introduced to the buildings sector. IDP involves early stakeholders in a systematic approach to achieve performance targets. In this study, IDP was implemented in a single-family house, targeting efficient houses with minimum/no cost. Many energy efficiency strategies (EESs), such as envelop insulation, orientation, window properties, and efficient air-conditioning system, have been applied. These energy strategies predicted a substantial energy reduction where the energy use intensity (EUI) would fall from 182 to 72 kWh/m2.year. In addition, solar renewable energy, domestic solar hot water (DSHW), and photovoltaic (PV) panels (10 kW) saved 18.78 MWh/year. Besides, water efficiency strategies (WESs) are anticipated to save 217,581 gallons/year due to the use of a water recycling unit, low flowrate faucets, and efficient shower systems, all of which have been proposed. All the recommended energy efficiency strategies (EESs) and water efficiency strategies (WESs) had a simple payback period of fewer than 10 years and proved their cost feasibility over their life-cycle. Moreover, a considerable CO₂ emission avoidance (117 tons/year) was attained.
1. Introduction
Buildings are the primary energy consumer and contributor to climate change and ozone layer depletion issues, as reported by the United Nations Environment Programme (UNEP Citation2009). For instance, buildings in the USA consume 40% of all energy. In contrast, in a hotter country such as Singapore, energy consumption rises to 57% due to the continuous need for space cooling (Dong, Lee, and Sapar Citation2005). In the Middle East and North Africa (MENA), buildings consume over 74% of the total electricity generated (Ihm and Krarti Citation2012). Unfortunately, building consumption’s adverse effect is expected to increase due to population and economic growths (DOE Citation2010).
Residential buildings worldwide are the leading energy consumer and peak demand among building typologies. In Gulf Cooperation Council (GCC) region, residential buildings consume about 70% of all other building types in Kuwait (MEW Citation2019) and about 76–83% in Oman (Al-Saadi & Shaaban Citation2019). In response, many researchers have devoted significant effort to mitigating building consumption adverse effects. The research approach tended to look at one aspect of each study, e.g., the insulation effect on energy consumption. Al-Sanea and Zedan (Citation2011) studied the best distribution of the insulation layers within a wall. They found that outward insulation and in the middle improve the time lag dramatically and the decrement factor, thereby reducing the peak heat and cooling loads. In another study, Al-Sanea, Zedan, and Al-Hussain (Citation2012) fixed the wall thermal resistance and manipulated the thermal mass thickness. They found that maximum annual savings were 17% and 35% for cooling and heating transmission loads, respectively. Likewise, the effect of building envelope on energy saving in dwellings has been studied by Alaidroos and Krarti (Citation2015) in different cities of Saudi Arabia. The optimum solutions saved 22.7%–39.5%, depending on the city’s climate (Alaidroos & Krarti, Citation2015). Recently, researchers have started to look holistically at many energy efficiency strategies. Taleb (Citation2014) tested a typical villa in Dubai using eight passive cooling techniques (evaporative cooling, shading, glazing, insulation, natural ventilation, radiant cooling, light-coloured coatings, and green roofing), which showed a possible reduction of 23.6% (Taleb Citation2014).
Currently, a holistic approach is set to lessen the building energy consumption effects known by zero energy buildings (ZEBs). ZEB is defined in different ways depend on where demand is met; the most used definition is where its energy demand can be covered by on-site renewable energy generation over the course of a year (Brambilla et al. Citation2018). Many countries enforce ZEB concept on their policies such as the European Union, which has instructed ZEBs through the Energy Performance of Building Directive 2018/844 (Directive (EU) Citation2018).
Many studies sought to achieve the ZEBs target in different climates. Noris et al. study proved that electrical demand in Europe can be met by a biomass boiler together with roof-top PV (Noris et al. Citation2014). Another study was designing a house that complies with Italian code and seeking near-zero energy (Cellura et al. Citation2015) using simulation. The house achieved ZEB using a 20 kW roof-top PV system with an on-site backup battery and geothermal heat pump to meet the heating and domestic hot water demand. Another attempt to achieve ZEB for two climates; hot dry in Madrid and hot humid in Shanghai (Deng et al. Citation2011). Different solar and efficient mechanical systems were investigated, which showed that electrical demand could be covered with varying periods of payback. Further, a study that evaluates passive and active energy-efficient strategies applied to a house in China using simulation software showed a reduction in energy consumption by 18% (Zhou et al. Citation2016).
Similarly, cost-effective passive and active design strategies with solar collectors for domestic hot water (DHW) were sufficient to comply with ZEBs requirement in the Mediterranean climate (Evola, Margani, and Marletta Citation2014). Krarti and Ihm (Citation2016) looked at the potential of designing ZEB energy residential buildings in the MENA region. The authors concluded that a reduction of 56% could be obtained compared to conventional practices (Krarti and Ihm Citation2016). Al-Saadi and Shaaban (2019) analyse a life scale house built at Sultan Qaboos University, Oman, which was less by 3% to the ZEB target.
The discussed research above proved that the concept of ZEB is an attainable target if appropriate passive and active energy efficiencies were considered from the early design stage. In addition, cost-effective renewable energy technologies are integrated to cover the remaining expected energy use. However, most of the discussed studies were theoretical, i.e., by conducting a simulation package that did not include designing and constructing of an actual building. Also, most of the studies were conducted on heating demand climates focusing on energy saving and production, overlooking many essential factors such as water efficiency.
This work presents an integrated design process (IDP) of an eco-house that ensures all possible active and passive energy and water efficiency strategies (WESs) at the design stage with minimum or no extra cost. IDP brings together all stakeholders of a building in a collaborative approach to work towards achieving performance targets. It also ensures the integrity of the design when constructing a building with all its primary and sub-systems such as renewable energy. Unlike the Conventional Design Process (CDP) that uses a sequential design steps approach. In addition, the house will be monitored for future energy performance analysis.
2. Integrated Design Process (IDP) in houses
2.1. Benefits of implementing IDP
In order to substantially enhance a house’s performance, current conventional design and construction processes need to be improved. The conventional design process (CDP) of a residential house is built by assigning an architect then conducting the civil, mechanical, plumbing, and electrical works separately (Gercek and Arsan Citation2019; Feng, Lu, and Wang Citation2019). CDP basically goes through unrelated processes; it begins with the architect developing a concept design that meets client requirements. After that, the plan is handed separately to the plumber, mechanical and electrical engineers to implement it. CDP leads to an inefficient design process, oversized heating and cooling systems, and extra unnecessary investment due to intertwining other building aspects such as aesthetic and cost (Åkerman, Halonen, and Wessberg Citation2020; Jalaei, Jalaei, and Mohamaddi Citation2019; Najjar et al. Citation2019).
Conversely, the integrated design process (IDP), which was only introduced recently to the building sector, is characterised by a series of design processes per stage (Larsson Citation2009). IDP includes all building parties: designers, energy experts, authorities, energy system providers, construction companies, as well as other actors at the early phases of the design dialogue through a collaborative approach. IDP has been used in many disciplines, but not as much within the buildings sector, while their most common types are quality function deployment (QFD) and axiomatic design (AD) methods. These methods are oriented around customer needs and satisfaction. Recently, these methods have drawn the attention of researchers in the building construction industry. For instance, Vilūnė and Violeta (Citation2021) have integrated the IDP methods into a hypothetical building, thereby proving their superiority over the CDP, with a 10% less primary energy and less iterative process where needed. On a larger scale, Bocheńska-Skałecka and Walter (Citation2020) have compared the CDP and IDP in a neighbourhood in Poland and found that the IDP is optimal for this kind of project. However, the downside of such an IDP in its original form is requiring a design facilitator that might be acceptable for a large building, but not in the case of residential ones.
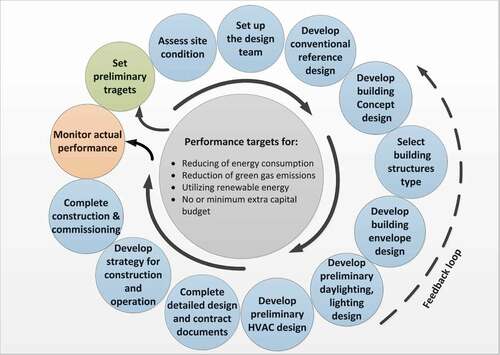
For residential buildings, using the most sophisticated IDP methods such as QFD and AD will complicate the construction industries’ as usual business, which will incur extra cost and time, something that clients will not accept. However, in this study, a transition step has been taken to utilise the IDP concept, keep it doable, and bring water consumption to the centre of attention, particularly in an arid climate. Giving the project coordination to an energy engineer or architect within an architecture firm. Besides, the client becomes more actively involved from kick-off by participating in setting the project’s goals and strategies in terms of building performance. The expected outcome is an efficient design at little or no associated additional capital expense but with added benefits. These include a reduction in continuing operating and maintenance costs and enhancements in the functional programme, in the decisions about structural assemblies, and architectural expression relative to conventional approaches. The steps to implement an IDP for a residential building (house) are described in the following:
Step 1: Form a professional team of designers, energy regulator, energy system providers, construction companies, and a specialist in energy simulation.
Step 2. Participants define the targets and formulate approaches to achieve those targets. The primary goals in this project are as follows:
Minimise heating and cooling loads but maximise daylighting.
Meet heating and cooling loads using efficient HVAC systems without prejudicing the indoor environment quality.
Maximise the use of solar and other renewable energy technologies.
Develop several alternative concepts, which are then tested using a building performance simulation program to meet the design goals.
Step 3: Budget is considered more comprehensively, recognising that adding a budget line for one feature (such as sun shading) may reduce capital and operation costs for another (installing cooling system).
Step 4: Develop a strategy for construction, commissioning, and operation.
Step 5: Monitor the building’s actual energy and water performance for future design adjustment.
An overview of the IDP process is illustrated in
Figure 1. Overview of the integrated design process (IDP)
2.2. Eco-house preliminary design criteria
The participants’ design workshop (brainstorming) concluded with many valuable ideas about the house design criteria. First, the main house façades will be oriented in the direction with the least solar heat gain (South and North). Second, the envelope thermo-physical materials and construction methods (wall bearing) were chosen to enhance the thermal envelope performance and minimise thermal bridging. Third, the windows’ size and specifications are selected to reduce the direct solar heat gain and conducted heat gain by employing an enhanced glazing property such as low emissivity (low-e). Fourth, an attached overhang shading device was carefully sized in the south fenestration to prevent unwanted solar incidents that penetrate the house during summer while permitting them during winter. Fifth, the window dimensions ensure maximum daylighting harvesting. Sixth, the variable refrigerant flow (VRF) air-conditioning system was proposed as an ever-improving technology that works with an efficient variable speed compressor which proved to be energy-efficient during part-load demand. Ultimately, the appliances were selected from the high-efficient rated list recognised by global rating systems such as the EnergyStar.
Furthermore, to enhance the house’s overall footprint, solar energy technologies, namely photovoltaic (PV) and solar domestic hot water (SDHW), were incorporated. The former produced electricity using the photovoltaic concept, while the latter used solar thermal energy to provide hot water. Regarding water efficiencies strategies (WESs), a water recycling unit was proposed to reprocess sewage to produce greywater; such a step is unprecedented in this building typology. The recycled water will be used for the irrigation system (to feed the green area and vegetation) and for dust cleaning purposes. Besides, efficient head showers and water fixtures were considered.
This house is the first of its kind in the country; therefore, extensive measurements were made of indoor air temperatures, humidity, and CO₂ of most zones. Also, heat fluxes at different points on the wall, floor, and roof will be installed. In addition, mechanical and electrical system energy consumption will be recorded, the amount of recycled water will be monitored, and a local weather station will be installed. The collected data from the house will be worthy of measurement and verification in a separate study. Details of the main components of the conventional and eco-house are presented in section 3.
3. Eco-house’s detailed design
3.1. Characteristics of the local climate
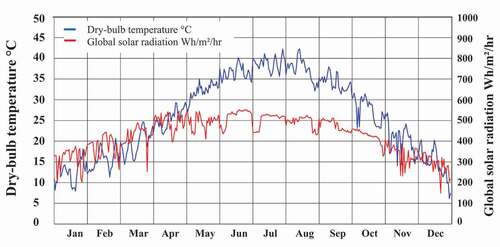
Kuwait is situated in the north-eastern section of the Arabian Peninsula, at latitude 29° 22ʹ north and longitude 47° 58ʹ east. The summer season could go on for months, lasting from April to October when the temperature could reach as high as 50 °C in July and August with low humidity; and in the cold season from November to March, the temperature ranges between 5 and 25 °C with high relative humidity. Kuwait’s cooling degree is around 3,442 hours, based on 18.3 °C (ASHRAE Fundamentals Handbook (SI) Citation2013). The high temperature that categorises the local weather and its long summer season explain the high energy demand in summer, which may peak in July and August due to the need for non-stop air-conditioning (Al-Badi, Malik, Al-Areimi, & Al-Mamari, Citation2009; Al-Badi, Malik & Gastli, Citation2009).
Coincidently, Kuwait and other GCC countries get the highest solar irradiance on the planet (Kazem Citation2011). The average hourly global solar radiation is 540 Wh/m2/hr for 9 hours of sunshine per day. More notably, the general lack of wind and hydro resources in the GCC countries means that most of the renewable energy supply is likely to be supplied by solar energy. shows the main weather elements (temperatures and solar radiation) of a typical year in Kuwait.
Figure 2. Dry-bulb temperature and average hourly global solar radiation in Kuwait
3.2. Eco-House architectural design
The eco-house is located in Jaber Al Ahmed, 26 km west of Kuwait City. The main house façades will be oriented in the directions with the least solar heat gain (South and North). The eco-house’s total plot area is 400 m2, consisting of two occupied floors and a service floor on the roof. The total built area is 450 m2 with a 2002 m3 volume. The first floor consists of a bedroom, two lounges, a dining room, a kitchen, and a house driver’s room. The second floor has four bedrooms and a living room. The service section on the roof has a laundry and a maid’s bedroom. The house design and floor layouts are shown in .
Figure 3. Top: House isometric view of the final design, Bottom: Floors’ layouts
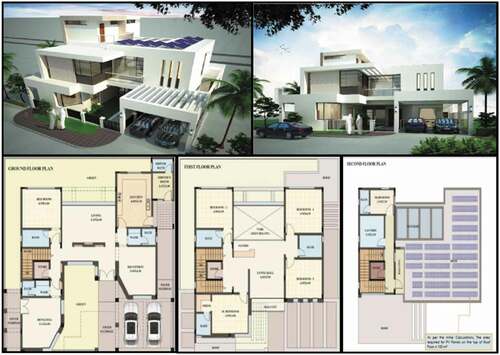
The aspect ratio of the structure is 0.85; the southwest and northeast facades have larger glazing and door openings. The window to wall ratio (WWR) of the house is 15% for the North and South and 8 and 9% for the East and West. Overhangs shade the south to prevent direct sunlight from penetrating the inner space during the autumn and summer seasons. The lounge/dining room on the north side of the ground floor has a double-height ceiling to allow more daylight with minimum possible heat gain as the north side is not subjected to direct solar gain. Due to diligently selected construction methods, the house is expected to be well-tight, and no more than 0.5 air changes per hour (ACH) at 50 Pa pressure. A verification of this assumption will be made after the house is commissioned using the related technique.
3.3. Envelope and fenestration specifications
Buildings in the State of Kuwait have to comply with the ‘Energy Conservation Code of Practice,’ MEW/R-6 (MEW Citation2019). The MEW/R-6/2014 prescribes the minimum requirements for the overall heat transfer coefficient (U-value) of a building envelope (slab-on-grade, exterior wall, and roof) and fenestration (window and external door). Therefore, the design team has considered these requirements as the base-case house, whereas the construction envelope’s selected specifications and fenestration exceeded the code’s requirements. The internal walls’ specifications are not included in the code, although they influence the indoor temperature’s stability. Thus, the team endorsed similar specifications for the external wall construction to increase indoor temperature stability. Moreover, exterior and internal painting materials were chosen based on being environmentally friendly. For the thermal characteristic, the coating materials for the external roof and walls have lower absorptance values than conventional painting by less than 20%, thereby helping to reduce the heat gain through the envelope (Hample Middle East Citation2014).
Fenestration is one of the main elements for allowing heat gain to penetrate a hot climate building. Using the same approach of selecting an efficient house component without jeopardising construction stream practice, the team set up the best high-performance windows available in the local market. The low emissivity (low-e, allocated at surface number 2) of a double-pane window with a specification of 6-mm glass, 20-mm air, and 6-mm glass, usually denoted as 6/20/6 mm, was selected. This renders its overall heat transfer coefficient at up to 1.23 W/m2K compared to the 3.33 W/m2K required by the code of the same window to wall ratio (WWR). The solar heat gain coefficient (SHGC) of the selected window is 0.22, which is better than the code’s requirement of 0.25, while the light transmittance is 0.21. The window’s frame retained an aluminium type based on common practice and the construction team’s suggestion.
3.4. Selected energy and water efficiency technologies
3.4.1. HVAC type selection
The biggest energy consumer in a hot climate is undoubtedly the air-conditioning system (A/C). In GCC countries, air conditioning counts for more than 60% of the total energy consumption (Elsarrag and Alhorr Citation2012). The common practice in the State of Kuwait is to use the central direct-expansion unit (DX) in residential buildings. The MEW/R-6/2014 limits the air-conditioning system’s power supplies by 56 W/m2 for residential areas to restrict poor building design and A/C system performance (MEW Citation2019). The code regulator has highly discouraged using the DX system due to its low energy performance, particularly during the part-load demand. Therefore, the design team has suggested installing the variable refrigerant flow (VRF), which has been proven to be more efficient at both full and partial loads than the DX system (Kani-Sanchez and Richman Citation2017). The arrangement of the A/C system is shown in .
Figure 4. Schematic diagram of the VRF system and ventilation with energy recovery unit (ERU)
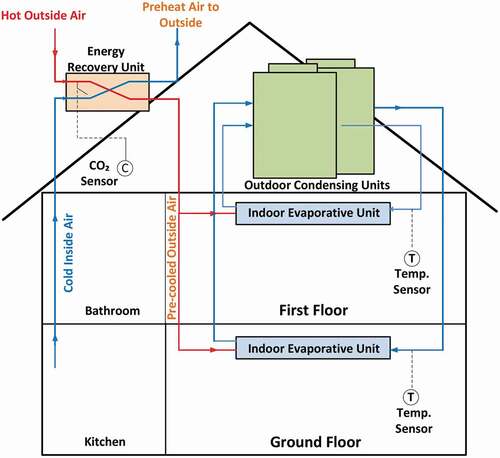
3.4.2. Ventilation system with energy recovery unit
One of the main advantages of the eco-house design concept is being able to incorporate the indoor environment quality, unlike the conventional residential building design where the ventilation is neither considered by the MEW/R-6/2014 code nor by practitioners and owners. Therefore, it tends not to include a dedicated ventilation system that can pull in outside air to refresh the recycled cooled air. This is due to the severe outside condition where the owner relies on the infiltrating air to bring in fresh outdoor air.
Whereas in this project, a ventilation unit has been selected to provide outside air to each zone. Also, the energy of the exhaust air is recovered by an energy recovery unit (ERU), minimising the energy consumption due to ventilation. The ERU is controlled by a CO₂ sensor that allows outside air to get into the house only when the occupants need it. A schematic diagram of the ventilation system cycle is shown in the upper left corner of .
3.4.3. Lighting and appliances
Nowadays, house owners are transitioning from the most commonly used lighting system, i.e. compact fluorescent (CFL), to the light-emitting diode (LED). This move is encouraged by the falling LED prices, while the technology has proven its practicality and efficiency. Thus, the internal lighting system has been chosen as LED with motion controls in specific zones such as toilets, corridors, and storerooms. Additionally, the exterior lighting has been selected as a solar-based LED type. There are 172 luminaires needed to light the house, most of which with a power of 8 W type, while the equivalent luminaries from the CFL would be around 19.5 W. Thus, the total lighting power density (LPD) for the eco-house is set to be 2 W/m2. In contrast, the conventional house would be 5 W/m2. The life expectancy of LED is anticipated to be 25,000 h, whereas CFL is only 8,000 h. The LED’s replacement time is once every five years, while the CFL is every two years if the operating hours are around 10 hours/day.
The design team also ensures the selection of efficient appliances such as TV, refrigerator, freezer, and white goods highly-rated by EnergyStar. This program promotes energy efficiency (Energy Star Citation2019) for use in the house. This ensures that the appliance power density (APD) of the eco-house is fixed at 0.35 W/m2 while the conventional one would be more than 1 W/m2.
3.4.4. Water efficiency systems
Water efficiency strategies (WESs) are as essential as energy since water in Kuwait comes from a desalination process based on burning fossil fuel. In this house, there are eight bathrooms (nine washbasins, four showerheads), one laundry, one pantry, and one kitchen. By using the International Plumbing Code (International pluming code (IPC) Citation2018), the nine washbasins, two kitchen/pantry sinks, six showerheads try, and one washing machine use an average of 220, 200, 225, and 30 L/day, respectively. This yields a total greywater quantity of about 3760 L/day (3.76 m3/day).
Based on this method, the plumbing contractor has designed a water treatment recycle unit in the specified capacity that has been set up below the ground level at the back of the house.
The greywater treatment plant goes through several processes, starting from collecting the greywater into a tank. After that, it goes into a filtration system to remove impurities and bacteria. The purified water will then be stored in a separate container for use in the irrigation system and cleaning purposes, such as cleaning the household’s cars, outside porch, and sidewalk from dust. The landscape water requirement was found to be around 48 L/day for a 12.32 m2 plant area using the drips irrigation system (Alsulaili et al. Citation2019). The green space is approximately 90 m2. Therefore, the total water consumption will be 336 L/day. The amount of water needed to wash a car is about 284 L/car (Alsulaili et al. Citation2019), therefore assuming two vehicles will be washed a day, this puts the total amount of water for car washing at 568 L/day. The amount of water for cleaning was assumed to be around the same as for the car wash (284 L/day). This puts the total predicted reused water from the recycling treatment plant at 1188 L/day, representing only 31.5% of the plant’s capacity. The remaining recycled water may be reused for other future needs.
Besides, a unique showerhead system has been proposed called ‘Orbital Head Shower System’. This system has its recycling and purifying system within the shower box. This system will be installed in four out of six showerheads in the house as a second option for those who may not prefer to use a full-scale recycling unit. Statistically, the average shower time obtained by a local survey is 20 min with a water flow rate by showerhead of 9.5 L/min [25]. Therefore, the four showerheads will consume 760 L/day. However, using the new head shower technology, water consumption will be reduced by 75–90%. As a result, the four showerheads’ average saved water will be around 627 L/day (165.5 Gallons/day).
Lastly, lavatory and kitchen taps will be using low-flow tap aerators. There are 32 fixtures that may be used for two minutes at a flow rate of 8.3 L/min (Al-Odwani, Ahmed, and Bou-Hamad Citation2007); in conventional faucets, this will consume a total amount of 531 L/day. However, efficient aerators can reduce the flow rate by 40% so that the amount of saved water will be 212 L/day.
3.4.5. Renewable energy technologies
Renewable energy technologies (RETs) are the most viable energy source, both regionally and globally. The most obvious choice in a hot climate country is to utilise solar energy in domestic applications such as photovoltaic (PV) to generate electricity and thermal solar hot water. The PV’s supplier has offered a new generation bifacial cell, Poly-crystalline, that can generate from the front side of the panel a power ranging from 350–365 W and capture up to 30% from the backside. Further, it has a low-temperature coefficient and better shading tolerance. The inverter of the PVs panels, which convert the direct current (DC) to alternating current (AC), has an efficiency of 98.6%. Initially, a 5 kW with an overall efficiency of 13.5% had been studied, and later the size was doubled to 10 kW so as to utilise the free space on the roof and maximise the generated power by PVs. The two tested sizes are expected to generate 9,124 kWh/yr and 18,248 kWh/yr, respectively. The generated energy will be connected to the controller that synchronises the PV output and the main feed to the building since no access energy can be stored or fed to the grid.
The second RET system is thermal energy that utilises solar to heat up water for domestic use. The domestic solar hot water (DSHW) is selected with 540 Litres (120 Gallons) operating at 60 °C temperature, which is the commonly used size and supply temperature, with a 4 kW electric heater as a backup. The DSHW was designed to raise the water temperature to the 65°C storage temperature of a 450-Litre tank; therefore, the size of the net heater solar collector area is 4.4 m2 with a 35-degree inclination towards the south. The manufacturer of the chosen DSHW assures efficiency of 78% for the system.
3.4.6. Integrating smart home automation system
The eco-house is also integrated with a smart home automation system (SHAS). SHAS fully controls the electrical and mechanical systems, including closed-circuit television (CCTV), heating, ventilation, air-conditioning (HVAC), and lighting. Interestingly enough, the house occupants can configure and access the SHAS from any smartphone through a locally-made phone application eHOME® (eHome Automation LLC Citation2021). Such a feature gives owners an excellent opportunity to follow their house operational conditions remotely and switch off unnecessary running systems. In this study, the actual electricity consumption will be gathered through hardwiring to a central data acquisition, and then transmitted to the cloud. The information can be accessed instantly, and users could immediately monitor in real-time the power values and cumulative power consumption in kilowatt-hours (KWh) for the day, week, month, and year. This will support the concept of design for sustainable behaviour (DfSB), while its effects on energy consumption will be considered in a separate study.
3.5. Simulation model inputs and validation
Building simulation programs are essential in the Integrated Design Process (IDP) to (re)evaluate suggested energy and water efficiency strategies (WESs) at design phases. It is also used to analyse the energy performance of new and retrofitted buildings. Many studies have successfully utilised building simulation programs such as DesignBuilder, eQuest, and DOE-2 to assess energy efficiency strategies (Ferrara et al. Citation2014; Georges, Berner, and Mathisen Citation2014; Becchio et al. Citation2014; Sadeghifam et al. Citation2015).
In this study, two house models (conventional and eco-house) were prepared using DesignBuilder (DesignBuilder Software Citation2018). The two models, inputs, conventional (base case) and eco-house used in this study are summarised in . The two models have similarities in the input data in many aspects but differ in others.
Table 1. Main model input of the conventional (base case) and eco-house
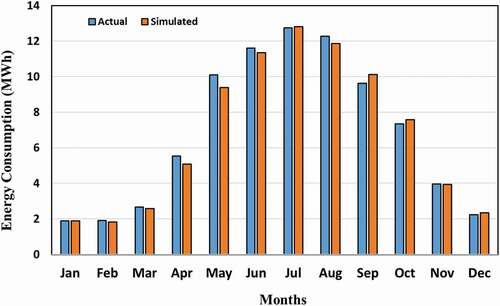
The conventional house design (base-case) has been validated against real measurement using the inputs in . The conventional model outputs have been compared to the average of real measurements taken for a typical house over several years (2014–2018). The actual measurements of the typical house have been compared with the actual floor area of the eco-house. The difference between the actual measurements and the model is less than 5%, which complies with the ASHRAE 140-guideline (ASHRAE Citation2014), see .
Figure 5. Actual versus simulated total energy consumption for model validation
4. Results and discussion
4.1. Skylight fixing disagreement
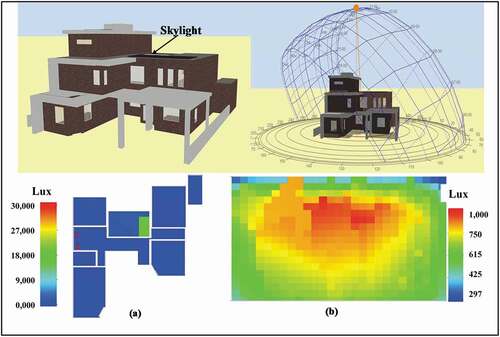
One of the first spotted controversial issues between the owner’s requirements and the design team was the inclusion of a skylight in the design. The owner wanted to improve the daylighting in the dining area. However, the design team was concerned about the extra heat that will penetrate the house through the skylight and the possibility of excess daylighting that might occur, which will cause a glaring issue. A quick annual energy and daylighting assessment using the simulation program proved that the skylight would increase the cooling load by 7 kW (two refrigeration tons) and create a local over-light spots area, as shown in . In ), the red spot shows excessive daylighting reaching 30,000 lux which will cause visual discomfort and glare issues. In ), when the skylight is removed, the annual average daylighting in the middle of the space is around 880 lux, which is under the threshold value (1000 lux). Based on this analysis, the owner was persuaded not to include the skylight in the final design, allowing for more space on the roof and providing more opportunity to increase the number of PV panels.
Figure 6. House model and daylighting analysis
4.2. HVAC capacity
Selecting a proper HVAC size is an essential step towards reducing energy consumption to the target house energy performance. Unfortunately, the most common practice is to oversized the air-conditioning system to avoid possible customer complaints regarding insufficient cooling. This is mainly due to a lack of simple and cost-effective tools that can be used to estimate the cooling load adequately for such a building (residential). In this project, the capacity was selected as the outcome of different cooling load calculation tools. The cooling load has been estimated by various team members using different methods based on each member’s expertise, namely, Hourly Analysis Program (HAP), DesignBuilder, and A/C equipment supplier as-usual-practice of sizing the equipment (the rule of thumb experience). The building simulation program (DesignBuilder) cooling load estimation was adopted with minor alteration. The total air-conditioning capacity was 50 kW (17 refrigeration tons), which is less than the same floor area’s average house capacity by 20%. One more advantage of this project’s selected HVAC system is thermal zoning, where almost every space was treated as a separate thermal zone (12 thermal zones). So each zone can be controlled without interacting with the other zones. Therefore, the cooling load capacity was calculated non-coincidentally to identify each zone peak cooling load and coincidentally to calculate the total cooling load. Such an approach would adequately specify the proper size of the indoor as well as the outdoor A/C units. The whole outdoor units capacity were multiplied by a 0.9 diversity factor as defined by the MEW/R-6/-2014 code of practice (MEW Citation2019). The capacity was selected based on the bigger magnitude of the operative and dry-bulb temperatures. The peak cooling load of coincident and non-coincident was measured to ensure occupant thermal satisfaction and reduce any unmet indoor temperature.
4.3. Peak power load
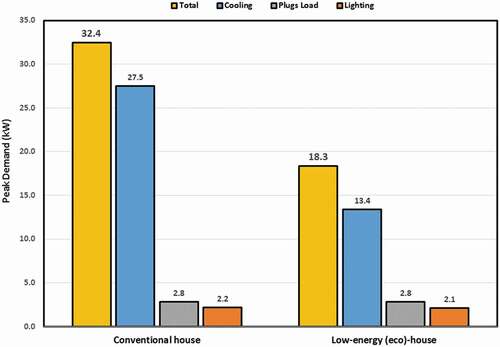
During the summer, the peak in power demand mainly comes from the buildings’ requirements, particularly the air-conditioning systems. Therefore, buildings reducing peak demand will also reduce the need to construct more new power plants to meet future demands. The conventional house’s peak electrical demand was 32.4 kW, while the proposed eco-house was only 18.3 kW (43% reduction), see . As shown in , the cooling systems’ mean demands were 27.5 and 13.4 kW for the conventional house and eco-house, respectively. These loads respectively correspond to 85% and 73% of the total house demand, while the plug loads came second for both houses by 2.8 kW, which represents 8.6 and 15.3% for the conventional house and eco-house, respectively. The third load was the lighting by 2.2 and 2.1 kW for the conventional house and eco-house (representing 6.6 and 11.6%), respectively.
Figure 7. Peak load demand of the conventional and eco-houses
4.4. The envelope performance
The envelopes of the proposed designs (eco-house) and conventional houses were analysed. While they both show a similar heat gain trend, the eco-house exhibited better performance, i.e. low heat gain into the house, see .
Figure 8. Heat gain through the envelope of the conventional (top) and eco-house (bottom)
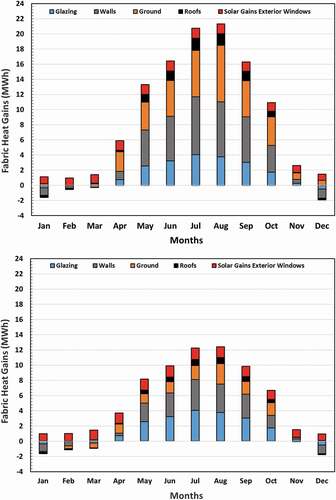
The heat gain for both houses through the envelope construction and fenestration is illustrated in . As shown in , a better envelope performance for the eco-house over the conventional house was achieved. The eco-house performed better in almost all envelope components which was much more evident on the walls and ground floor due to its high thermal mass and insulation. To be sure, this had its impact on the house energy demand and consumption.
4.5. Mechanical and electrical energy consumption analysis
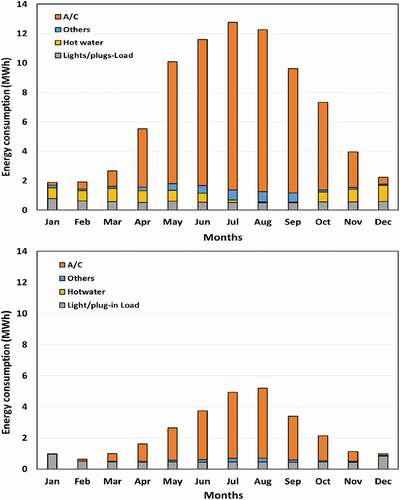
The efficient design of the envelope and fenestration contributed to reducing the house’s cooling load, which consequently reduced the energy consumption by the HVAC, as shown in . The same could be said of the efficient lighting system (LED) with control shares on saving the cooling demanded by the house. Significantly, the selected efficient HVAC system, i.e. variable refrigerant flow (VRF) with a coefficient of performance (COP) of 3.3 over the conventional, which was around 2.5, plays a significant role in reducing the energy demand by the HVAC. The above-stated reasons had effectively contributed to reducing HVAC consumption by more than 65%. It is also noted that the other energy consumption by lighting and room electricity (plug-loads), hot water, and others was slightly reduced as well, see .
Figure 9. The energy consumption of the two houses’ consuming components; (top) conventional, (bottom) eco-house
4.6. Integrating renewable energy
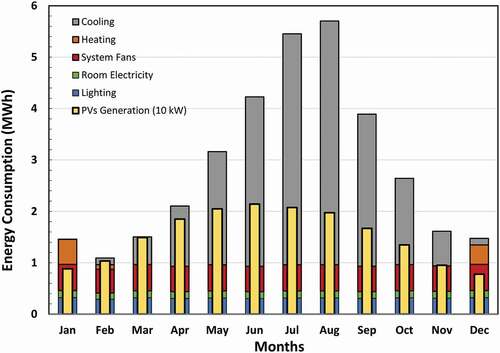
The design team evaluated the most practical renewable energy technologies for residential buildings, such as photovoltaic (PV) and domestic solar water heater (DSWH). Two PV sizes (5 and 10 kW) with 13.5% efficiency were tested, which generated 9.124 and 18.248 MWh/year, respectively. It can be seen from that PV of size 10 kW can overcome the demand of the system fans, room electricity (plugs-in load), lighting, and part of the A/C load. The freely available roof area was less than 80 m2; a larger roof area should be considered in a future design (by reducing the service section area) towards a more efficient house while moving towards a net-zero energy house (NZEH).
Figure 10. Electricity generated by 10 kW panels over the total energy consumption of the eco-house
The domestic solar hot water (DSHW) is assumed to be able to replace an electric boiler with an energy consumption of 0.333 MWh/year. The selected DSHW has a 4 kW electric heater as a backup and a circulating pump that consumes a negligible amount of energy.
4.7. Energy Use Intensity (EUI)
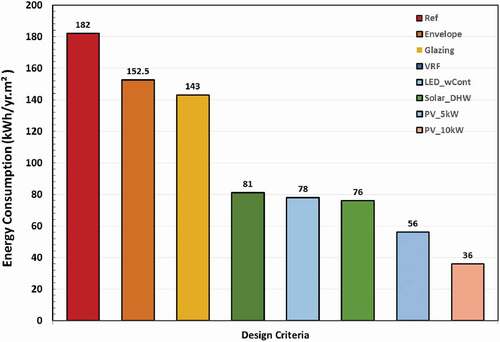
The energy use intensity (EUI) is a good performance indicator of building energy performance, measured by dividing the total annual energy consumption of a building by its total floor area. Real validated measurement of a typical residential house (villa) showed an EUI of 182 kWh/m2.year. In this study, the EUI of the conventional house used to validate the model was considered the base case, which was then compared against the proposed design (eco-house).
The house energy consumption was reduced in different proportions according to each implemented energy efficiency strategy (EES). The envelope was able to reduce energy use intensity from 182 to 152.5 kWh/m2.yr. In addition, the fenestration contributed to further lowering of the EUI to 143. The VRF air-conditioning system was able to reduce consumption significantly to 81 kWh/m2yr. The efficient lighting system (LED with control) also had a role in bringing down the EUI to 78 kWh/m2.yr. Having implanted all energy efficiency strategies (EESs), the eco-house energy consumption was reduced to an EUI value of 78 kWh/m2.year.
The renewable energy technologies used, namely domestic solar hot water (DSHW) and PV panels with 5 or 10 kW, were able to prevent the use of conventional power, which brings the EUI to 76, 56, and 36 kWh/m2yr, respectively. As shown in , the EUI is reduced from 182 to 36, equivalent to a reduction of 80%. In order to reach a net-zero energy house (NZEH), which is the building that consumes as much as what it produces on an annual basis, an additional 10 kWp PVs cells should have been installed.
Figure 11. The house energy performance indicated by EUI per each design criterion
4.8. Economic and environmental analysis
In this study, the cost analysis is based on the actual electricity cost, not the subsidised. The residents are paying only 5% of the actual cost; the tariff is 0.007 $/kWh, while the actual cost is 0.133 $/kWh. Similarly, the water tariff is 7 USD (2 KD), while the actual cost is 33 USD (10 KD) per 1000 gallons. This makes it hard to identify many energy and water efficiency strategies that can be feasible based on the subsidised tariff. It is worth noting that the government has passed a bill that allows the energy and water regulator to increase the tariff gradually towards the actual cost. In addition, the suggested energy and water efficiency strategies can be enforced through the upcoming version of the energy code. This study’s cost analysis is based on the energy and water efficiency strategies of a residential building, even though many can be implemented on any building typology.
4.8.1. Simple payback period
The most straightforward cost analysis is the simple payback period (SPP), where the energy saved cost is divided over the initial cost of the considered strategy. The economic and environmental analysis of the eco-house is summarised in . As shown there, the feasibility analysis indicated a reasonable payback period for all used technologies (less than or equal to 10 years). The most extended payback period was the PV panels; it showed a payback period of 10 years, which is considered reasonable. Additionally, the predicted cost decline and efficiency improvement of the PVs are promising; therefore, it will be more feasible in the near future. Interestingly, the water efficiency strategies (WESs) were very encouraging, all of which show a simple payback in fewer than 5 years; the greywater treatment plant, orbital head showers, and aerators are to be paid back on 3.3, 4.7, and 0.2 years, respectively, see .
Table 2. Energy efficiency strategies cost and environmental analysis of the used technologies
Table 3. Water efficiency strategies cost analysis of the used technologies
4.8.2. Life-Cycle-Cost analysis
A complete life-cycle-cost analysis is presented, including the initial cost (IC) for each implemented energy efficiency strategy and technology. The annual energy cost (EC) is obtained based on the conventional house and eco-house simulation results. In addition, the uniform series present worth (USPW) factor is used to convert all the annual energy costs to the present [37]; the relationship between these variables is defined by EquationEquation (1)(1)
(1) :
USPW is a function of both the lifetime (N) of the villa/system and the discount rate () of the economy, as stated in EquationEquation (2)
(2)
(2) :
Throughout the analysis, the lifetime is dependent on the evaluated element, and so it ranges from 4–30 years. The annual discount rate is set at 5%. A life cycle cost analysis of all considered technologies is presented in . As shown there, all energy-efficient measures and technologies indicate a better present value over the life-cycle, except for the domestic solar hot water (DSHW) where the supplier had offered a relatively costly system.
The other bright side of the eco-house project is water efficiency strategies (WESs). The eco-house has considered three technologies: greywater treatment plant, shower recycling system, and water conservation fixtures. All three technologies have shown significant impact in terms of saving on water consumption, see . The treatment plant saves 346 gallons per day which will pay its initial cost (simple payback period) in 3.3 years, while the showerhead-orbital system saves 165.5 gallons per day which will cover the initial cost within 4.7 years.
Interestingly, the lowest-cost technology, i.e. the water aerator conservation fixtures, saved around 84 gallons per day; this will pay back its initial cost within 0.2 years. However, the LCC showed the greywater station’s infeasibility due to the oversized capacity and high initial cost. Thus, the station’s initial cost can be reduced by half, and this will set its LCC at 10,707 USD which will be close to the conventional system. The showerhead technology was very close to the conventional system over the life span, while the aerators showed evident superiority over the conventional system, see . It must be noted that the cost analysis has been carried out on the basis of 33 USD (10 KD) per 1000 gallons.
4.8.3. Environmental impact
Greenhouse gasses contribute to environmental pollution. CO2 is the main contributor to global warming, and for this reason, only CO2 emissions are considered in the present work. As such, each new technology’s environmental impact is determined by the amount of CO2 emissions prevented when it is being implemented.
Similarly, prevented CO2 emissions for the solar energy system are determined, assuming that each kWh generated by the solar system makes up for each kWh produced by the conventional energy system. In this study, the estimated CO2 emission is based on a plant emission factor (Kuwait) of 870 gCO2/kWhe [33]. As shown in , the range of prevented CO2 emission is 0.4–39.5 tons annually for each energy efficiency strategy (EES). The total amount of CO2 saving is 117.6 tons annually.
5. Conclusion
The integrated design process (IDP) has proven its effectiveness in addressing the challenges faced by a project design team in terms of identifying and achieving the goals of an eco-house. The outcome is an efficient design at little or no associated incremental capital expense but with additional benefits. The eco-house analysis showed a significant reduction in energy consumption from 82 to 34 MWh/year (~58% reduction). In other words, the energy use intensity (EUI) dropped from 182 to 78 kWh/m2.year. In addition, by integrating renewable energy technologies, the eco-house will eliminate 0.33 MWh annually by replacing the conventional electrical domestic hot water with the domestic solar water heater (DSWH).
Moreover, the house will produce 18.25 MWh/yr by using 10 kWp PV panels over the available roof area (<80 m2). Including its renewable energy role, this brings the EUI down to 36 kWh/m2.year which is equivalent to an 80% reduction. If the PVs panels had been doubled to 20 kW, a net-zero energy house (NZEH) would have been achieved.
In addition, water consumption was dramatically reduced by 346 gallons/day. The three water efficiency strategies (WESs) implemented in the eco-house were greywater treatment plant, efficient showerhead system, and aerators, all of which played a significant role in reducing water consumption. That said, the most powerful is the greywater treatment plant, followed by the shower recycling system. On the other hand, the aerator has the most cost-effective value.
The payback periods of the evaluated energy technologies were less than 10 years. The life-cycle cost analysis of the implemented energy efficiency strategies (EESs) identified their feasibilities, thereby encouraging building owners and energy policy regulators to apply them widely.
Moreover, the water efficiency strategies (WESs) showed considerable savings for the eco-house. In addition, the life-cycle cost analysis performed well for all three technologies, showing feasibility in terms of the life span of each energy and water efficiency strategy (WES).
Fortunately, such achievement is also reflected in the environment, as 117.6 tons of CO₂ emission have been reduced annually because of energy reduction and renewable energy generation.
Finally, the IDP approach must encourage local authorities to put it in practice instead of the CDP. For policy makers, it could also be considered on a larger scale during urban planning of new cities.
Acronyms
Acknowledgments
The author wishes to thank all stakeholders who participated in the project for their kind contribution, collaboration, and tremendous volunteering effort that made this project a reality. Gratitude is also extended to the Project Management Office team (EnerTech Holding Company), led by Fahad Almarri, Mohammed Abdulrazaq and Abdullah Almutairi.
Disclosure Statement
No potential conflict of interest was reported by the author(s).
Additional information
Notes on contributors
Ali F. Alajmi
Ali Alajmi ·Visiting/Affiliate Professor at Portland State University, USA, 2016-Now. ·Associate Professor, at College of Technological Studies (CTS), Public Authority of Applied Education and Training· Ph.D. In Mechanical Engineering- Built Environment. Loughborough University, UK.· M.Sc. and B.Sc. In Mechanical Engineering. Kuwait University, Kuwait. Research interests: Buildings Optimization, Buildings Energy Performance, Buildings Energy Auditing, Net-zero Energy Building (NZEB). Publications: Publishes many articles in building energy performance assessments, building optimization using genetic algorithms (GAs), and Underfloor air-distributions system (UFAD).
References
- Åkerman, M., M. Halonen, and N. Wessberg. 2020. “Lost in Building Design Practices: The Intertwining of Energy with the Multiple Goals of Home Building in Finland.” Energy Research & Social Science 61 101335. ISSN 2214-6296. doi:https://doi.org/10.1016/j.erss.2019.101335.
- Alaidroos, A., and M. Krarti. 2015. “Optimal Design of Residential Building Envelope Systems in the Kingdom of Saudi Arabia.” Energy and Buildings 86: 104–117. doi:https://doi.org/10.1016/j.enbuild.2014.09.083.
- Al-Badi, A., A. Malik, and A. Gastli. 2009. “Assessment of Renewable Energy Resources Potential in Oman and Identification of Barrier to Their Significant Utilization.” Renewable and Sustainable Energy Reviews 13 (9): 2734–2739. doi:https://doi.org/10.1016/j.rser.2009.06.010.
- Al-Badi, A., A. Malik, K. Al-Areimi, and A. Al-Mamari. 2009. “Power Sector of Oman-Today and Tomorrow.” Renewable and Sustainable Energy Reviews 13 (8): 2192–2196. doi:https://doi.org/10.1016/j.rser.2009.03.010.
- Al-Odwani, A., M. Ahmed, and S. Bou-Hamad. 2007. “Carwash Water Reclamation in Kuwait.” Desalination 206 (1–3): 17–28. doi:https://doi.org/10.1016/j.desal.2006.03.560.
- Al-Saadi, S., and A. Shaaban. 2019. Zero energy building (ZEB) in a cooling dominated climate of Oman: design and energy performance analysis. Renewable and Sustainable Energy Reviews 112: 299–316. ISSN 1364–0321. doi:https://doi.org/10.1016/j.rser.2019.05.049
- Al-Sanea, S., and M. Zedan. 2011. “Improving Thermal Performance of Building Walls by Optimizing Insulation Layer Distribution and Thickness for Same Thermal Mass.” Applied Energy 88 (9): 3113–3124. doi:https://doi.org/10.1016/j.apenergy.2011.02.036.
- Al-Sanea, S., M. Zedan, and S. Al-Hussain. 2012. “Effect of Thermal Mass on Performance of Insulated Building Walls and the Concept of Energy Savings Potential.” Applied Energy 89 (1): 430–442. doi:https://doi.org/10.1016/j.apenergy.2011.08.009.
- Alsulaili, A., M. Al-Matrouk, R. Al-Baghli, and A. Al-Enezi. 2019. “Environmental and Economic Benefits of Applying Green Building Concepts in Kuwait.” Environment, Development and Sustainability 22: 3371–3387. doi:https://doi.org/10.1007/s10668-019-00352-1.
- ASHRAE. 2014. ASHRAE Guideline 14-2014 for Measurement of Energy and Demand Savings. Atlanta, GA: American Society of Heating, Refrigeration and Air Conditioning Engineers.
- ASHRAE Fundamentals Handbook (SI). 2013. Chapter 14 SI (2013): Climatic Design Information, American Society of Heating, Refrigerating and Air-Conditioning Engineers, Inc.: Atlanta, GA, USA..
- Becchio, C., P. Dabbene, E. Fabrizio, V. Monetti, and M. Filippi. 2014. “Cost Optimality Assessment of a Single Family House: Building and Technical Systems Solutions for the nZEB Target.” Energy and Buildings 90: 173–187. doi:https://doi.org/10.1016/j.enbuild.2014.12.050.
- Bocheńska-Skałecka, A., and E. Walter. 2020. “Application of the Integrated Design Process (IDP) Method to the Design of Riverside on the Example of Żmigród (Poland).” Sustainability 12 (16): 6684. doi:https://doi.org/10.3390/su12166684.
- Brambilla, A., G. Salvalai, M. Imperadori, and M. M. Sesana. 2018. “Nearly Zero Energy Building Renovation: From Energy Efficiency to Environmental Efficiency, a Pilot Case Study.” Energy and Buildings 166: 271–283. doi:https://doi.org/10.1016/j.enbuild.2018.02.002.
- Cellura, M., F. Guarino, S. Longo, and M. Mistretta. 2015. “Different Energy Balances for the Redesign of Nearly Net Zero Energy Buildings: An Italian Case Study.” Renewable and Sustainable Energy Reviews 45: 100–112. doi:https://doi.org/10.1016/j.rser.2015.01.048.
- Deng, S., A. Dalibard, M. Martin, Y. J. Dai, U. Eicker, and R. Z. Wang. 2011. “Energy Supply Concepts for Zero Energy Residential Buildings in Humid and Dry Climate.” Energy Conversion and Management 52 (6): 2455–2460. doi:https://doi.org/10.1016/j.enconman.2010.12.054.
- DesignBuilder Software. 2018. Design builder v5.5 simulation documentation. DesignBuilder Software Ltd., V5.5. Gloucestershire, UK. www.designbuilder.co.uk
- Directive (EU). 2018. 2018/844 of May 2018 amending Directive 2010/31/EU on energy performance of buildings. October 2018. https://ec.europa.eu/energy/en/topics/energy-efficiency/buildings
- DOE. 2010. “Energy Efficiency Trends in Residential and Commercial Building.” US Department of Energy. [Online] Accessed 16 April 2015. http://energy.gov/sites/prod/files/2013/11/f5/building_trends_2010.pdf
- Dong, B., S. Lee, and M. Sapar. 2005. “A Holistic Utility Bill Analysis Method for Baselining Whole Commercial Building Energy Consumption in Singapore.” Energy and Buildings 27 (2): 167–174. doi:https://doi.org/10.1016/j.enbuild.2004.06.011.
- eHome Automation LLC. 2021. “Home Automation, Alghanim Engineering.” Accessed February 2021. https://www.alghanimeg.com/en/home-solutions/smart-homes
- Elsarrag, E., and Y. Alhorr. 2012. “Modelling the Thermal Energy Demand of a Passive-House in the Gulf Region: The Impact of Thermal Insulation.” International Journal of Sustainable Built Environment 1 (1): 1–15. doi:https://doi.org/10.1016/j.ijsbe.2012.07.002.
- Energy Star. 2019. “US Environmental Protection Agency and US Department of Energy.” Accessed 4 June 2019. https://www.energystar.gov/products
- Evola, G., G. Margani, and L. Marletta. 2014. “Cost-effective Design Solutions for Low-rise Residential Net ZEBs in Mediterranean Climate.” Energy and Buildings 68: 7–18. doi:https://doi.org/10.1016/j.enbuild.2013.09.026.
- Feng, K., W. Lu, and Y. Wang. 2019. “Assessing Environmental Performance in Early Building Design Stage: An Integrated Parametric Design and Machine Learning Method.” Sustainable Cities and Society 50 101596. Article 101596. doi:https://doi.org/10.1016/jscs.2019.101596.
- Ferrara, M., F. Fabrizio, J. Virgone, and M. Filippi. 2014. “A Simulation-based Optimization Method for Cost-optimal Analysis of Nearly Zero Energy Buildings.” Energy and Buildings 84: 442–457. doi:https://doi.org/10.1016/j.enbuild.2014.08.031.
- Georges, L., M. Berner, and H. Mathisen. 2014. “Air Heating of Passive Houses in Cold Climates: Investigation Using Detailed Dynamic Simulations.” Building and Environment 74: 1–12. doi:https://doi.org/10.1016/j.buildenv.2013.12.020.
- Gercek, M., and Z. D. Arsan. 2019. “Energy and Environmental Performance Based Decision Support Process for Early Design Stages of Residential Buildings under Climate Change.” Sustainable Cities and Society 48: 101580. doi:https://doi.org/10.1016/j.scs.2019.101580.
- Hample Middle East. 2014. Energy Saving Study of Contex Thermoguard Products. WSP Middle East, Dubai, UAE.
- Ihm, P., and M. Krarti. 2012. “Design Optimization of Energy Efficient Residential Buildings in Tunisia.” Building and Environment 2012 58 81–90. doi:https://doi.org/10.1016/j.buildenv.2012.06.012.
- International pluming code (IPC). 2018. International Code Council, Building Officials and Code Administrators International. Falls Church, VA.
- Jalaei, F., F. Jalaei, and S. Mohamaddi. 2019. “An Integrated BIM-LEED Application to Automate Sustainable Design Assessment Framework at the Conceptual Stage of Building Projects.” Sustainable Cities and Society 53. Article 101979. doi:https://doi.org/10.1016/j.erss.2019.101335.
- Kani-Sanchez, C., and R. Richman. 2017. “Incorporating Variable Refrigerant Flow (VRF) Heat Pump Systems in Whole Building Energy Simulation – Detailed Case Study Using Measured Data.” Journal of Building Engineering 12: 314–324. doi:https://doi.org/10.1016/j.jobe.2017.06.016.
- Kazem, H. 2011. “Renewable Energy in Oman: Status and Future Prospects.” Renewable and Sustainable Energy Reviews 15 (8): 3465–3469. doi:https://doi.org/10.1016/j.rser.2011.05.015.
- Krarti, M., and P. Ihm. 2016. “Evaluation of Net-zero Energy Residential Buildings in the MENA Region.” Sustainable Cities and Society 22: 116–125. doi:https://doi.org/10.1016/j.scs.2016.02.007.
- Larsson, N. 2009. “The Integrated Design Process: History and Analysis.” International Initiative for a Sustainable Built Environment.
- MEW. 2019. Energy conservation code of practice, MEW/R-6/2018. Ministry of Electricity and Water, Kuwait, R6-2018.
- Najjar, M., K. Figueiredo, A. Hammad, and A. Haddad. 2019. “Integrated Optimization with Building Information Modelling and Life-cycle Assessment for Generating Energy Efficient Buildings.” Applied Energy 250: 1366–1382. doi:https://doi.org/10.1016/j.apenergy.2019.05.101.
- Noris, F., E. Musall, J. Salom, B. Berggren, S. O. Jensen, and K. Lindberg. 2014. “Implications of Weighting Factors on Technology Preference in Net Zero Energy Buildings.” Energy and Buildings 82: 250–262. doi:https://doi.org/10.1016/j.enbuild.2014.07.004.
- Sadeghifam, A., S. Zahraee, M. Meynagh, and I. Kiani. 2015. “Combined Use of Design of Experiment and Dynamic Building Simulation in Assessment of Energy Efficiency in Tropical Residential Buildings.” Energy and Buildings 86: 525–533. doi:https://doi.org/10.1016/j.enbuild.2014.10.052.
- Taleb, H. 2014. “Using Passive Cooling Strategies to Improve Thermal Performance and Reduce Energy Consumption of Residential Buildings in UAE Buildings.” Frontiers of Architectural Research 3 (2): 154–165. doi:https://doi.org/10.1016/j.foar.2014.01.002.
- United Nations Environment Programme (UNEP). 2009. Building and Climate Change: Summary for Decision-Makers. UNEP Sustainable Buildings and Climate Initiative, Paris.
- Vilūnė, L., and M. Violeta. 2021. “Integrated Building Design Technology Based on Quality Function Deployment and Axiomatic Design Methods: A Case Study.” Sustainable Cities and Society 65 102631. ISSN 2210-6707. doi:https://doi.org/10.1016/j.scs.2020.102631.
- Zhou, Z., L. Feng, S. Zhang, C. Wang, G. Chen, and T. Du. 2016. “The Operational Performance of “Net Zero Energy Building”: A Study in China.” Applied Energy 177: 716–728. doi:https://doi.org/10.1016/j.apenergy.2016.05.093.