
 ?Mathematical formulae have been encoded as MathML and are displayed in this HTML version using MathJax in order to improve their display. Uncheck the box to turn MathJax off. This feature requires Javascript. Click on a formula to zoom.
ABSTRACT
The manufacturing sector is now facing the challenge of complying with strict environmental regulations due to global warming, lack of natural resources, and waste management issues. Increased environmental problems and awareness lead to the implementation of green production practices by manufacturers worldwide. Green manufacturing (GM) activities form the basis of green and environmentally friendly goods production. There are, however, several possible indicators for GM implementation. There has been some good research on GM indicators, but little research in the Indian automotive industry has to date been undertaken on GM. In this analysis, the Fuzzy Analytical Hierarchy (F-AHP) method is incorporated into the Elimination Et Choix Traduisant La Realite (ELECTRE-I) procedure to define and rank the six main indicators as well as rank the case company’s three plants for GM implementation. The proposed framework is accredited by a leading factory manufacturer of steering systems in India. This study shows that Efficiency of Environmental Management System and Hazardous Waste Management are the leading indicators for GM, and plant P1 is the best alternative for the six indicators among the three plants. Our research will support the priority setting of key indicators influencing green manufacturing practices in the automotive industry.
1. Introduction
Manufacturing plays a critical role in developing economies. The development has played a significant role in improving the quality and economy of life in the Indian manufacturing sector in recent decades. Environmental awareness among businesses and consumers has grown worldwide over the last three decades (Tol Citation2018). Consumers today want to satisfy their needs and desires at the highest level and be environmentally sustainable. Green Manufacturing (GM) provides local and global leader in sustainable development (Pathak et al. Citation2021). GM is generally defined as ‘production practices that do not harm the environment at any stage of their journey’ (Srivastava Citation2007). Manufacturers want to fulfil their responsibilities and prioritise sustainable GM production in their competitive market environments (Linke, Huang, and Dornfeld Citation2012).
Industries are prone to green working conditions and are prepared to manufacture green products; adapt to recycling and clean deliverable sustainability mechanisms (Moldavska and Welo Citation2017). Thakur and Mangla (Citation2019) observe that GM is a comprehensive framework for implementation that can guide the workplace and introduce a fresh approach to the enterprise. GM operations strategically allow businesses to make full use of resources and obtain value from waste (Rehman, Seth, and Shrivastava Citation2016).
India needs to overcome the recession due to Covid 19 and give a significant impetus to new industrial growth opportunities (Chaudhary, Sodani, and Das Citation2020). Therefore, industries in India need to address various challenges related to GM (Bagri, Garg, and Agarwal Citation2021). Managers must identify and prioritise key GM indicators to address this issue (Dabbagh and Aga Poor Asbag Citation2020). The automotive industry is a significant producer in India and responsible for introducing green and intelligent manufacturing technologies (Mathiyazhagan, Sengupta, and Poovazhagan Citation2018). Recent environmental awareness trends show that the production philosophy must be changed and the fundamental changes in the current production system reinforced. In India, the awareness of customers in green practices chosen by producers has been increased by introducing new laws, guidelines, and standards by the Ministry of Environment and Forests (MOEF).
As for environmental concern in the manufacturing industry, the study needs to investigate the degree of GM adoption and implementation among India’s manufacturing industries (Toke and Kalpande Citation2017). The manufacturing industry is a significant source of industrial pollution (Walheer and He Citation2020). Because of new technologies having been introduced (electric cars and other solutions for energy efficiency). A dynamic market that has tremendous opportunities for changing environmental conditions while at the same time creating more efficient use of resources. Thus, it is urgently necessary to review the indicators in the Indian context. This study seeks to identify these indicators using the proposed novel framework model of FAHP, and ELECTRE I is a leading manufacturer of steering systems. This study aims to help automakers enhance their competitive position and improve their environmental awareness. This paper’s practical applications will include developing a model for the automotive industry and promoting valid decision frameworks for GM.
1.1. Research objective
The study tries to address the following research questions:
(1) What are the indicators in India for GM implementation in the automotive industry?
(2) How to prioritise important indicators for GM implementation?
(3) How do the results help industrial managers to formulate GM strategies?
This research has undertaken the following objectives to address the above research questions:
(1) Identify the GM indicators for auto industry implementation.
(2) Rank three plants of the case company based on their GM implementation practices using FAHP and ELECTRE-I techniques
(3) Recommend theoretical and management implications in the automobile industry for the implementation of GM.
The case study is organised as follows. Section 2 provides a literature review to explore the research already undertaken on this paper’s key objectives, existing gaps, and relevant research points. Section 3 explains the Framework and Method proposed. Section 4 sets out the nature of the case firm and the application of the proposed framework. Section 5 outlines the discussion and the implications of the results. Section 6 addresses the conclusion and the scope for the future.
2. Literature review
2.1. Green manufacturing
Studies in GM can be viewed worldwide since the 1980s. Nonetheless, ‘Green Manufacturing’ released by the Society of Manufacturing Engineers (SME) in 1996, systematically increased the GM’s definitions, connotation and basic ideas and later released ‘Green Manufacturing Trends’. (Rong and Ling Citation2012). GM is a production method that minimises natural resources as input, minimises energy and cost processes and produces finished goods to minimise pollution and waste (Setyaningsih et al. Citation2019). GM pays attention to environmental issues like wastewater management and supply, regulatory compliance, wastewater recycling, and other waste issues (Logesh and Balaji Citation2021). The core principle of green manufacturing is to implement advanced technologies to control pollution to increase resource efficiency and save the environment while using resources more productively (Omoush Citation2021).
Some definitions of GM from the literature are given in .
Table 1. GM definitions from literature
Critical factors should be defined, and procedures laid to ensure effective implementation of GM (Ninlawan et al. Citation2010). Several types of research indicated various factors defining possible paths for a GM method. Sarkis and Rasheed (Citation1995) proposed to define the green characteristics of the production system in four ways (reduction, remanufacturing, recycling, and reuse). For companies building their GM systems, Mohanty and Deshmukh (Citation1998) proposed four phases: foundation, waste minimisation, assessment, and eco-efficiency. Indicators play a crucial role in implementing environmental technologies, such as GM procedures, organisational capital, organisational creativity, and organisational management systems (Gunasekaran and Spalanzani Citation2012). Lun (Citation2011) analysed the components of GM activities and their effect on the organisation’s efficiency.
Daily and Huang (Citation2001) outlined the human resource-related factors for implementing environmental programmes as; high-level management support, training, satisfaction and incentive systems, and environmental training. Wee and Quazi (Citation2005) also validate Top-level commitment, employee training & involvement, supplier management, and green process design. Zutshi and Sohal (Citation2004) narrowly categorised EMS’s critical success factor into four categories: learning and training, management support, sustainability, and internal analysis. Zhou et al. (Citation2008) defined a green product using six attributes: design, production, packaging, transportation and selling, usage and maintenance, and recycling. Several researchers investigated the factors behind GM in various countries, including India (Mittal and Sangwan Citation2014; Govindan, Diabat, and Shankar Citation2015), the USA (Yi Citation2014), Turkey (Agan, Acar, and Borodin Citation2013), Sweden (Ammenberg and Sundin Citation2005), Spain (Santolaria et al. Citation2011) and Bangladesh (Moktadir et al. Citation2018).
Through the above status review of extant literature and corporate practices, we can infer that analysts and researchers have paid considerable attention to introducing GM, where specific steps have been taken. Although GM literature technically focuses on key problems, including the implementation process and the knowledge support network, and quantitative researchers empirically delivered on some evidence in surveys, there are still many difficulties in GM when it comes to the status quo worldwide (Huang and Zhu Citation2014). Green manufacturing plays a critical role in sustainable growth. Leaning Thinking and Green production parallels are Green Manufacturing’s strong base in the automotive industry.
2.2. Application of multi-criteria decision making (MCDM) techniques
MCDM is an analytical process aimed at providing decision-makers with well-informed advice among the finite set of alternatives while being assessed from various perspectives (Chai, Liu, and Ngai Citation2013). MCDM can be characterised as analysing methods and procedures by which concerns about several conflicting criteria can be formally integrated into the management planning process.
Researchers have integrated MCDM tools, especially in green strategies, in their problem studies. Several researchers developed and applied specific MCDM techniques for GM, such as the Analytic Network Process (ANP), The Analytic Hierarchy Process (AHP), the Preference Ranking Organization Method for the Enrichment of Evaluations (PROMETHEE), and the Decision-Making Trial and Evaluation Laboratory (DEMETAL), the Technique for Order of Preference (TOPSIS). Büyüközkan and Çifçi (Citation2012) used fuzzy DEMATEL, fuzzy ANP, and fuzzy TOPSIS approaches to solve the problem of green supplier selection or to provide a new approach to green factor assessments. The DEMATEL approach was used by Govindan, Diabat, and Shankar (Citation2015) to analyse green drivers and verify the results obtained by sensitivity analysis. For the evaluation of lean and GM factors in Indian small and medium-sized enterprises, Gandhi, Thanki, and Thakkar (Citation2018) applied the fuzzy TOPSIS method to compare the assessment results with the fuzzy Simple Additives Weighting (SAW) and Borda coefficients in the ranking of green drivers and found three methods to be similar. Majumdar and Sinha (Citation2019) applied ISM to analysed the barriers of green textile supply chain management. Mathiyazhagan, Sengupta, and Poovazhagan (Citation2018) adopted a case study approach to finding the challenges in implementing environmentally sustainable manufacturing in the Indian automobile firms using DEMATEL. Karuppiah et al. (Citation2020) modelled thirty barriers to GM implementation using multicriteria decision-making techniques. Musaad et al. (Citation2020) generated an integrated green-adoption barriers framework in the Saudi Arabian SMEs using multicriteria decision-making techniques.
2.3. Research observation and gap
While the literature review indicates that GM has become an important tool to tackle environmental and social sustainability in manufacturing sectors, there are still many concerns that require more study. The following findings and gaps are noted.
The manufacturing sector is making the transition to GM seriously.
AHP, ANP, DEMATEL, ISM is some of the MCDM approaches which many researchers have used.
There has been some research on GM indicators, but little research has been carried out in the Indian automobile industry to date on GM.
Fuzzy AHP and ELECTRE-I are yet to be used to the best of our knowledge to analyse GM implementation indicators in the Indian automobile industry.
This work explores the research gaps using the Fuzzy AHP and ELECTRE-I hybrid approaches.
2.4. Indicators to GM implementation
Databases such as Scopus, Science’s Web, Emerald Insights, etc., were searched to identify indicators with keywords such as ‘Green Manufacturing Drivers; Green Manufacturing Criteria; Green Manufacturing Enablers’, etc. A list of events was drawn up from a literature review. A team of six experts was formed to identify critical indicators from this list. The experts’ team consisted of three plant managers, working with automotive original equipment manufacturers having not less than 12 years of experience and three academicians having not less than ten years of experience. Based on the opinions of the experts, six indicators for this study have been considered critical and finalised and presented in .
Table 2. Indicators to GM
3. Methodology and method
Increasing pressure from regulatory bodies, customers, competitiveness, and so forth has led to Indian organisations adopt environmentally friendly manufacturing practices (Mathiyazhagan, Govindan, and Haq Citation2014). Many researchers and practitioners subsequently played their part in the Indian industry through studies on GM.
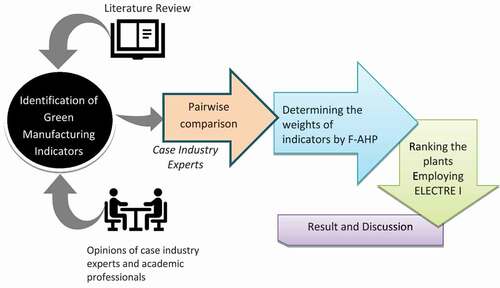
The literature review indicates that the combined Fuzzy AHP and ELECTRE-I technology are yet to be utilised to analyse GM in Indian automotive industries. Therefore, this study proposes a novel Fuzzy AHP-ELECTRE -I framework for determining and prioritising indicators with a significant impact on GM implementation. The methodology includes identifying individual weights of the six indicators using F-AHP and the classification of the case firm’s three plants accordingly. ELECTRE-I methodology is then used to achieve a personalised plant rating and to compare results with those weights. shows the methodology for this study, which usually consists of three phases. The first phase involves identifying indicators based on published literature and expert opinion. The F-AHP is used in the next step to determine the weights of critical indicators from the respondents’ point of view. Finally, in stage three, ELECTRE- I use the weights obtained in the second stage to rank the case firm’s plants and discuss the results. This study is based on the inputs of three plant managers of a case firm that works on the GM pathway.
Figure 1. Methodology
3.1. Method
This study allows the company to define key GM implementation indicators through hybrid MCDA, F-AHP, and ELECTRE-I. Both are commonly used MCDM approaches in different fields. Nonetheless, there are some limitations in the implementation of the Saaty AHP system (Yang and Chen Citation2004; Boutkhoum et al. Citation2015b) as (1) The AHP method addresses the quite unbalanced scale of decision and (2) the classification of the AHP method is very vague and easy and quick to use the discrete AHP scale without considering the complexities of human mapping opinion to any degree. FAHP has become an effective method for resolving human understanding and judgement, uncertainty and multiple parameters in multi-criterion real-world decision-making (Somsuk and Laosirihongthong Citation2014; Chen, Hsieh, and Do Citation2015; Sharma, Kumar, and Meena Citation2021). In this analysis, we suggest using the FAHP methodology to assess the weights of selected indicators. On the other hand, ELECTRE-I was chosen because it relates to alternative MCDM issues. ELECTRE-I is another kind of MCDM method that began in the mid-1960s, calling it ‘Elimination Et Choix Traduisant la REalité’ by three French researchers Roy, Benayoun and Sussmann and means ‘elimination and the choice Translating Reality’. This approach also reflects the importance of parameter comparisons by explicit comparisons with decision-makers bias (Pang, Zhang, and Chen Citation2011). Therefore the strengths of the approaches F-AHP and ELECTRE-I can be combined with a suitable decision support method to test GM indicators and linking potential alternatives (3 plants) to the respective indicators by decision matrix. Ajwinder Singh (Citation2019) applied F-AHP and ELECTRE towards hospital ranking. S. Uddin et al. (Citation2019) used this approach to evaluate barriers to green supply chain management in the leather industry. Ayyildiz, Taskin Gumus, and Erkan (Citation2020) applied this approach to individual credit rankings. This approach was applied by Ali, Gunawan, and Adi (Citation2021) to identify the most suitable farmland for organic rice production from several options.
4. Case study and the application of the proposed method
This case study motivates various stakeholders, especially the automotive industry in India, to be concerned about climate change and environmental pollution. A leading steering system manufacturer (called ABC) is a real example of how the proposed hybrid technology, which combines F-AHP and ELECTRE-I, helps make decisions presented here. ABC Steering Systems Ltd. was founded in India in 1985. The company agreed with XYZ Corporation Japan to manufacture steering column assemblies and manual steering gear assemblies. It is involved in the design/manufacture, supply and sale of steering systems, in particular. Steering gears, columns and RPS assemblies, axle assemblies and other automotive supports to almost all Indian passenger car and utility vehicle manufacturers. ABC Steering Systems now operates three plants, P1, P2 and P3, in India’s NCR region. The annual turnover of the company is 6 Billion (INR) and 200 employees work in the industry.
The environmental achievements of the company are Operation of Effluent treatment plant (ETP), Operation of sewage treatment plant (STP), Operation of hazardous waste collection pit, Greening of un-covered area, Operation of rainwater harvesting pit for recharging groundwater, Metal cladding and roofing of scrap yard to prevent land contamination, Acoustic enclosures for DG House, Incinerator for Hazardous waste Incineration, Solar water heater for washing of utensils in the canteen area, Bio Gas Plant for utilisation of canteen food waste, and Solar power plant installation.
ABC has also identified the environmental aspects of all operations, goods and services. Within the Environmental Management System (EMS) stated scope and estimate their respective impacts for meaning assessment, for appropriate action. The company has a core group of management representatives to identify and evaluate environmental aspects and implement GM.
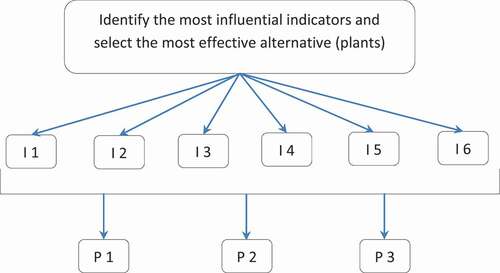
Our study includes various ABC plants as alternatives. Plants P1, P2 and P3, are various alternatives to the condition that one is best in GM. The indicators considered in this study scope are already presented in . shows the main selection problem using multi-criteria decision-making for the related company.
Figure 2. Decision hierarchy
4.1. F-AHP method to find out the weights of the indicators
F-AHP integrates Fuzzy theory into the basic theoretical hierarchy. Basic AHP doesn’t include personal judgement vagueness. Using the fuzzy logic approach, it was improved. The process reveals FAHP ‘s application in deciding the company’s three plants’ weight as GM indicators. In FAHP, both indicators and alternatives are compared in pairs through linguistic variables represented by triangular numbers. See .
Table 3. Fuzzy triangular scale
The steps involved in fuzzy AHP are as follows:
Step 1:
The pairwise contribution matrices, via scale and fuzzy triangular numbers, based on the decision maker’s observations of i th indicator over j th indicator are shown in .
Table 4. Pair-wise comparison fuzzy matrix based on FTN
Step 2:
The aggregate mean of the fuzzy comparison value is determined for each indicator.
The vector sum of all the respective GM values of li’s, mi’s and ri’s is calculated. Where li, mi, and wi stand for the lower, middle, and upper values of the fuzzy weight of the i-th criterion, respectively.
The reverse power i.e power of (−1) of the respective vector sum is determined and arranged to increase order. Refer to .
Table 5. The geometric mean of fuzzy comparison values
Step 3:
Each value of GM is multiplied with the respective reverse of vector sum.
Each indicator’s fuzzy weight is calculated by multiplying each GM value by the corresponding reverse power element, which keeps increasing order. Refer to .
Table 6. Relative fuzzy weight of each indicator
Step 4:
Now the row-wise sum of each respective criteria is calculated to get the average relative fuzzy weight i.e. Mi. Refer to .
Normalised Fuzzy weights are calculated using Equationequation (1)
(1)
Table 7. Average and normalised fuzzy weights of each criterion
After achieving normalised fuzzy weights for each indicator, we apply the same process to achieve normalised fuzzy weights for each alternative (three plants) for each indicator. This means that alternatives compared with each of the six indicators selected. Due to a large number of tables, these calculations are not shown here. shows the aggregated fuzzy weight of each alternative for each indicator.
Table 8. Weight of each alternative for indicator
4.2. ELECTRE – I method to find out the ranking of plants
To rank three plants, ELECTRE-I is applied. shows the normalised fuzzy weight vector and selected three plant values for the respective indicators calculated using F-AHP.
Table 9. Weights of the plants for the indicators
ELECTRE-I ranking steps are as follows.
Step 1. Determine normalised matrix.
The normalised Rij = [rij] matrix is calculated using Equationequation 2(2)
(2) and shown in .
Table 10. Normalised matrix
Step 2. Determine the weighted matrix.
It is given by Vij = R X W, where W is the weight of the indicators. It is shown in .
Table 11. Weighted matrix
Step 3. Concordance and discordance interval set.
The decision rules are based on sets of intervals of concordance and discordance, and these rules are used to acquire the sets of attributes. Let A = {a, b, c, … } specify a finite set of alternatives, separate attribute sets in two distinct concordance sets (Cab), and discordance set (Dab). The set of concordance intervals describes the dominance query with the following condition:
When Cab is complemented, EquationEquation 4(4)
(4) provides the discordance interval (Dab) set.
Step 4. Obtaining concordance interval matrix.
The concordance interval index (Cab) between Aa and Ab is obtained using EquationEquation 5(5)
(5) based on decision-makers preferences for alternatives.
The concordance index indicates approval of the proposition ‘A outranks B’. indicates the matrix for the concordance interval.
Table 12. Concordance matrix
Step 5. Obtaining discordance interval matrix.
Next, the d (a, b) discordance index is considered, which can be interpreted as a preference for dissatisfaction in the scheme a decision rather than scheme b.
Here m and n help quantify the normalised value of any alternatives. Therefore, using its index sets, we can set the interval matrix of discordance. shows the discordance interval matrix.
Table 13. Discordance matrix
Step 6. Obtaining a concordance index matrix
The matrix for the concordance index can be as follows:
Where denotes average concordance index value. Dominance index boolean matrix (E) as shown below,
The concordance index matrix for the problem is shown in (Obtained from ).
Table 14. Concordance index matrix
Step 7. Obtaining discordance index matrix
The choice of discontent can be calculated by the discordance index, as shown below:
Based on the previously stated discordance index, the discordance index matrix (F) is given by
The discordance index matrix for the problem is shown in . (Obtained from ).
Table 15. Discordance index matrix
Step 8. Obtaining the general matrix
The general matrix G shall be calculated by multiplying matrix E and matrix F peer-to-peer elements. The general matrix is shown in .
Table 16. General matrix
5. Discussions
This case study attempts to explore various indicators involved in GM implementation in the automotive sector. This research paper is based on applying the proposed integrated F- AHP and ELECTRE-I methodology to three case firm plants working on the GM implementation path. This study focuses on six indicators and three plants in the hierarchical model. The hierarchical structure adopted is shown in . Key indicators were derived through extensive investigation and consultation with ABC automotive case firm’s experts. Indicators are coded as Ii with the number of relevant indicators shown in . Three plants P1, P2 and P3, are hierarchical alternatives.
First, the F-AHP technology was used to identify the most significant indicators. show the weights obtained for six indicators and three alternatives for six indicators using F-AHP. assigns ‘Hazardous Waste Management’ (I4) and Efficiency of Environmental Management System (I3) to the highest weight. Ming-Lang Tseng (Citation2013) proposes a novel approach in which fuzzy set theory and interpretive structural modelling are used to model indicators of sustainable production, and the results indicate that hazardous waste is an important indicator of sustainable production. Kanwal, Zeng, and Li (Citation2021) demonstrate how cultural, political, and economic behaviour varies in an anthropogenic system using the Drivers-Pressures-State-Impact-Response (DPSIR) framework for hazardous waste management. Dukmasova et al. (Citation2017) demonstrated through regression and correlation analysis that environmental management systems provide a significant additional competitive advantage to those who adopt them.
The final result is I4 > I3 > I2 > I6 > I1> I5. The GM indicator rankings allow the respective organisations to choose their approaches to apply GM successfully. Furthermore, GM implementation rankings show the respondents’ observations on their importance and can help organisations determine their strengths for continuous improvement.
ELECTRE-I is applied to obtain the ranking of the three plants to implement GM. First, as shown in , the weighted normalised matrix has been developed. The matrices of concordance and discordance indexes of the three plants were calculated using the index of concordance intervals and the index interval of discordance (see tables A12 and A13). The matrices for concordance and discordance (Boolean matrices) are given in . We added those two boolean matrices to obtain the general matrix (E). The built general matrix is illustrated in . The three plants’ final sequence towards GM implementation comes from Matrix E, as shown in .
shows that P1 is preferred with the ELECTRE formulation, and P2 is preferred to P3, and P1 and P3 are not compared. From the above conclusions, it is clear that P1 is the preferred plant, followed by P2 and P3. The final order is, therefore, P1 > P2 > P3. This order found that plant 1 (P1) was recognised as the most effective way of implementing GM.
The results obtained from the proposed method were provided for consideration and approval by the experts of these identified results’ case organisation. After an in-depth analysis of the results, experts approved and proposed some suggestions, i.e. plant managers should pay more attention to GM indicators. A better understanding of the GM will benefit the case organisation concerning environmental initiatives with policies, information, and programs to make it more compatible with the case organisation’s needs. The indicators can be used in both industries and to design GM’s operations. This is especially true for industries that haven’t thought about systematically measuring sustainability. The indicators outlined in this research have good relevance for industry, which must be empirically confirmed.
6. Conclusion
This study attempts to react to the requirements of GM in the automotive industries of an emerging economy. The proposed framework would strengthen the sustainable practices of professionals in the automotive industry. This research aims to identify, classify and prioritise GM implementation indicators and propose a solution in the case of enterprise for successful GM implementation. In the three manufacturing facilities of ABC organisation, an attempt is made to quantify these indicators using the novel systemic hybrid fuzzy AHP – ELECTRE I approach. The case analysis is presented to verify whether the proposed framework is applicable and feasible. The application case considers three plants (P1, P2 and P3) as an alternative and compares them to the six GM implementation indicators, respectively. Hazardous Waste Management (I4) (0.376), Efficiency of Environmental Management System (I3)(0.203), Pressure from Local NGOs (I2) (0.182), Energy Consumption (I6) (0.100), Necessary tools, management skill and commitment (I1) (0.089), Efficiency of Plant (I5)(0.050) are the weight of indicators using AHP in decreasing order. The results of ELECTRE imply that P1 is the best alternative to six indicators among all three plants. We can conclude that plant 1 outperforms the other plant by the above six indicators regarding plants with the best results in green manufacturing.
The research findings are generic and can be adopted by other companies in the automotive sector or other industrial sectors. Although the study was conducted in India, it adopts a broad framework developed for the study and can be utilised for similar studies worldwide. However, the study may or may not be appropriate for each country, depending on environmental conditions and resource availability. More industries from other sectors can be considered in future to analyse GM implementation indicators. Other MCDM techniques can also be used in future work.
Disclosure statement
No potential conflict of interest was reported by the author(s).
Additional information
Notes on contributors
Vikrant Sharma
Vikrant Sharma is working as an Assistant Professor in the Department of Mechanical Engineering, Mody University of Science and Technology, Lakshmangarh, Rajasthan. India. In 2004, he received his bachelor's degree in production engineering from the University of Pune. In 2007, he earned a Master's degree in Manufacturing System Engineering from MNIT Jaipur. He has submitted his PhD. He has 14 years of research and teaching experience, as well as 17 publications in prestigious international journals. His interests include green manufacturing, multi-criteria decision making, and lean manufacturing.
Vikram Sharma
Vikram Sharma is currently serving as an Associate Professor of Mechanical-Mechatronics Engineering at the LNM Institute of Information Technology (LNMIIT), Jaipur, India. He has over 19 years of teaching and research experience. He has presented several papers in international conferences and journals. His current research interests include lean and green manufacturing “.
Kritika Karwasra
Kritika Karwasra is a PhD student at IIT Bombay's IEOR Department.
References
- Agan, Y., M. F. Acar, and A. Borodin. 2013. “Drivers of Environmental Processes and Their Impact on Performance: A Study of Turkish SMEs.” Journal of Cleaner Production 51: 23–33. doi:https://doi.org/10.1016/j.jclepro.2012.12.043.
- Ali, I., V. Gunawan, and K. Adi. 2021. “Land-use Suitability Evaluation for Organic Rice Cultivation Using fuzzy-AHP ELECTRE Method.” Register: Jurnal Ilmiah Teknologi Sistem Informasi 7 (1): 1–15. doi:https://doi.org/10.26594/register.v7i1.2080.
- Ammenberg, J., and E. Sundin. 2005. “Products in Environmental Management Systems: Drivers, Barriers and Experiences.” Journal of Cleaner Production 13: 405–415. doi:https://doi.org/10.1016/j.jclepro.2003.12.005.
- Avila, M., J. Gardner, C. Reich-Weiser, A. Vijayaraghavan, S. Tripathi, and D. Dornfeld. 2005. “Burr Minimization Strategies and Cleanability in the Aerospace and Automotive Industry.” SAE International Journal of Aerospace 114 (1): 1073–1082.
- Ayyildiz, E., A. Taskin Gumus, and M. Erkan. 2020. “Individual Credit Ranking by an Integrated Interval Type-2 Trapezoidal Fuzzy Electre Methodology.” Soft Computing 24: 16149–16163. doi:https://doi.org/10.1007/s00500-020-04929-1.
- Bagri, G. P., D. Garg, and A. Agarwal. 2021. “Study of Key Issues, Their Measures and Challenges to Implementing Green Practice in Coal Mining Industries in Indian Context.” In Advances in Manufacturing and Industrial Engineering. Lecture Notes in Mechanical Engineering, edited by R. M. Singari, K. Mathiyazhagan, and H. Kumar, 109–122. Singapore: Springer. doi:https://doi.org/10.1007/978-981-15-8542-5_10.
- Boks, C., J. Nilsson, K. Masui, K. Suzuki, C. Rose, and B. Lee, 1998. “An International Comparison of Product End-of- Life Scenarios and Legislation for Consumer Electronics.” Proceedings from the IEEE Symposium on Electronics and the Environment, 19–24, Oak Brook, IL.
- Boutkhoum, O., M. Hanine, T. Agouti, and A. Tikniouine. 2015. “An Improved Hybrid Multi-criteria/multidimensional Model for Strategic Industrial Location Selection: Casablanca Industrial Zones as a Case Study.” Springer Plus 4 (1). doi:https://doi.org/10.1186/s40064-015-1404-x.
- Büyüközkan, G., and G. Çifçi. 2012. “A Novel Hybrid MCDM Approach Based on Fuzzy DEMATEL, Fuzzy ANP and Fuzzy TOPSIS to Evaluate Green Suppliers.” Expert Systems With Applications 39: 3000–3011. doi:https://doi.org/10.1016/j.eswa.2011.08.162.
- Chai, J., J. N. Liu, and E. W. Ngai. 2013. “Application of Decision-making Techniques in Supplier Selection: A Systematic Review of Literature.” Expert Systems with Applications 40 (10): 3872–3885. doi:https://doi.org/10.1016/j.eswa.2012.12.040.
- Chaudhary, M., P. R. Sodani, and S. Das. 2020. “Effect of COVID-19 on Economy in India: Some Reflections for Policy and Programme.” Journal of Health Management 22 (2): 169–180. doi:https://doi.org/10.1177/0972063420935541.
- Chen, J. F., H. N. Hsieh, and Q. H. Do. 2015. “Evaluating Teaching Performance Based on Fuzzy AHP and Comprehensive Evaluation Approach.” Applied Soft Computing 28: 100–108. doi:https://doi.org/10.1016/j.asoc.2014.11.050.
- Dabbagh, R., and S. Aga Poor Asbag. 2020. “A Suitable Decision-Making Approach to Select Green Manufacturing Practices for Bonab Sanat Steel Complex.” Journal of Industrial Engineering Research in Production Systems 8 (16): 57–75. doi:https://doi.org/10.22084/ier.2020.20991.1935.
- Daily, B. F., and S.-C. Huang. 2001. “Achieving Sustainability through Attention to Human Resource Factors in Environmental Management.” International Journal of Operations & Production Management 21 (12): 1539–1552. doi:https://doi.org/10.1108/01443570110410892.
- Dashore, K., and N. Sohani. 2013. “Green Supply Chain Management – Barriers & Drivers: A Review.” International Journal of Engineering Research & Technology 2 (4): 2021–2030.
- Dukmasova, N., I. Ershova, I. Plastinina, and A. Boyarinov. 2017. “Economic Efficiency of Environmental Management System Operation in Industrial Companies.” IOP Conference Series: Earth and Environmental Science 72: 012001. doi:https://doi.org/10.1088/1755-1315/72/1/012001.
- Gandhi, N. S., S. J. Thanki, and J. J. Thakkar. 2018. “Ranking of Drivers for Integrated Lean-green Manufacturing for Indian Manufacturing SMEs.” Journal of Cleaner Production 171: 675–689. doi:https://doi.org/10.1016/j.jclepro.2017.10.041.
- Ganiyusufoglu, Ö. S. 2013. “Chinese Approach to Sustainable Manufacturing.” In: G. Seliger, editor. Proceedings of the 11th Global Conference on Sustainable Manufacturing - Innovative Solutions, Germany, TU Berlin, September 23–25.
- Glavic, P., and L. Rebeka. 2007. “Review of Sustainability Terms and Their Definitions.” Journal of Cleaner Production 15 (18): 1875–1885. doi:https://doi.org/10.1016/j.jclepro.2006.12.006.
- Govindan, K., A. Diabat, and K. M. Shankar. 2015. “Analyzing the Drivers of Green Manufacturing with Fuzzy Approach.” Journal of Cleaner Production 96: 182–193. doi:https://doi.org/10.1016/j.jclepro.2014.02.054.
- Gunasekaran, A., and A. Spalanzani. 2012. “Sustainability of Manufacturing and Services: Investigations for Research and Applications.” International Journal of Production Economics 140 (1): 35–47. doi:https://doi.org/10.1016/j.ijpe.2011.05.011.
- Hallam, C. R., and C. Contreras 2016. “The Interrelation of Lean and Green Manufacturing Practices: A Case of Push or Pull in Implementation.” In Proceedings of the 2016 Portland International Conference on Management of Engineering and Technology (PICMET), Honolulu, HI, USA, 4–8 September 2016; Institute of Electrical and Electronics Engineers (IEEE): Piscataway, NJ, USA, 2016; 1815–1823.
- Henriques, J., and J. Catarino. 2016. “Motivating Towards Energy Efficiency in Small and Medium Enterprises.” Journal of Cleaner Production 139: 42–50. doi:https://doi.org/10.1016/j.jclepro.2016.08.026.
- Huang, J. Y., and H. Y. Zhu. 2014. “Analysis of Implementation the Key Technologies of Green Manufacturing.” Applied Mechanics and Materials 522–524: 787–790. https://doi.org/10.4028/www.scientific.net/AMM.522-524.787
- Kanwal, Q., X. Zeng, and J. Li. 2021. “Drivers-pressures-state-impact-response Framework of Hazardous Waste Management in China.” Critical Reviews in Environmental Science and Technology 1–32. doi:https://doi.org/10.1080/10643389.2021.1902225.
- Karuppiah, K., B. Sankaranarayanan, S. M. Ali, P. Chowdhury, and S. Paul. 2020. “An Integrated Approach to Modeling the Barriers in Implementing Green Manufacturing Practices in SMEs.” Journal of Cleaner Production 265: 12173. doi:https://doi.org/10.1016/j.jclepro.2020.121737.
- Linke, B., Y. C. Huang, and D. Dornfeld. 2012. “Establishing Greener Products and Manufacturing Processes.” International Journal of Precision Engineering and Manufacturing 13 (7): 1029–1036. doi:https://doi.org/10.1007/s12541-012-0134-z.
- Logesh, B., and M. Balaji. 2021. “Experimental Investigations to Deploy Green Manufacturing through Reduction of Waste Using Lean Tools in Electrical Components Manufacturing Company.” International Journal of Precision Engineering and Manufacturing-Green Technology 8: 365–374. doi:https://doi.org/10.1007/s40684-020-00216-4.
- Lun, Y. H. 2011. “Green Management Practices and Firm Performance: A Case of Container Terminal Operations.” Resources, Conservation and Recycling 55 (6): 559–566. doi:https://doi.org/10.1016/j.resconrec.2010.12.001.
- Majumdar, A., and S. K. Sinha. 2019. “Analyzing the Barriers of Green Textile Supply Chain Management in Southeast Asia Using Interpretive Structural Modeling.” Sustainable Production and Consumption 17: 176–187. doi:https://doi.org/10.1016/j.spc.2018.10.005.
- Mangla, S., P. Kumar, and M. K. Barua. 2014a. “An Evaluation of Attribute for Improving the Green Supply Chain Performance via DEMATEL Method.” International Journal of Mechanical Engineering & Robotics Research 1 (1): 30–35.
- Massoud, M. A., R. Fayad, M. El-Fadel, and R. Kamleh. 2010. “Drivers, Barriers and Incentives to Implementing Environmental Management Systems in the Food Industry: A Case of Lebanon.” Journal of Cleaner Production 18 (3): 200–209. doi:https://doi.org/10.1016/j.jclepro.2009.09.022.
- Mathiyazhagan, K., K. Govindan, and A. N. Haq. 2014. “Pressure Analysis for Green Supply Chain Management Implementation in Indian Industries Using Analytic Hierarchy Process.” International Journal of Production Research 52 (1): 188–202. doi:https://doi.org/10.1080/00207543.2013.831190.
- Mathiyazhagan, K., S. Sengupta, and L. Poovazhagan. 2018. “A Decision Making Trial and Evaluation Laboratory Approach to Analyse the Challenges to Environmentally Sustainable Manufacturing in Indian Automobile Industry.” Sustainable Production and Consumption 16: 58–67. doi:https://doi.org/10.1016/j.spc.2018.05.007.
- Mittal, V. K., and K. S. Sangwan. 2014. “Prioritizing Drivers for Green Manufacturing: Environmental, Social and Economic Perspectives.” Procedia CIRP 15: 135–140. doi:https://doi.org/10.1016/j.procir.2014.06.038.
- Mohanty, R. P., and S. G. Deshmukh. 1998. “Managing Green Productivity: Some Strategic Directions.” Journal: Production Planning & Control 9: 624–633.
- Moktadir, M. A., T. Rahman, M. H. Rahman, S. M. Ali, and S. K. Paul. 2018. “Drivers to Sustainable Manufacturing Practices and Circular Economy: A Perspective of Leather Industries in Bangladesh.” Journal of Cleaner Production 174: 1366–1380. doi:https://doi.org/10.1016/j.jclepro.2017.11.063.
- Moldavska, A., and T. Welo. 2017. “The Concept of Sustainable Manufacturing and Its Definitions: A Content-analysis Based Literature Review.” Journal of Cleaner Production 166: 744–755. doi:https://doi.org/10.1016/j.jclepro.2017.08.006.
- Musaad, O., A. Sultan, Z. Zhuo, A. O. Musaad O, Z. A. Siyal, H. Hashmi, and S. A. A. Shah. 2020. “A Fuzzy Multi-Criteria Analysis of Barriers and Policy Strategies for Small and Medium Enterprises to Adopt Green Innovation.” Symmetry 12: 116. doi:https://doi.org/10.3390/sym12010116.
- Ninlawan, C., P. Seksan, K. Tossapol, and W. Pilada. (2010). “The Implementation of Green Supply Chain Management Practices in Electronics Industry.” Proceedings of the International Multi Conference of Engineers and Computer Scientists 2010 VolIII, IMECS 2010, Hong Kong, March 17–19.
- Omoush, M. 2021. “The Impact of Green Productivity Strategy on Environmental Sustainability through Measurement of the Management Support: A Field Study in Industry Sector in Jordan.” Management Science Letters 11 (3): 737–746. doi:https://doi.org/10.5267/j.msl.2020.10.033.
- Pang, J., G. Zhang, and G. Chen. 2011. “ELECTRE I Decision Model of Reliability Design Scheme for Computer Numerical Control Machine.” JSoftware 6 (5): 894–900. doi:https://doi.org/10.4304/jsw.6.5.894-900.
- Pathak, S. K., K. Karwasra, V. Sharma, and V. Sharma. 2021. “Analysis of Barriers to Green Manufacturing Using Hybrid Approach: An Investigatory Case Study on Indian Automotive Industry.” Process Integration and Optimization for Sustainability. doi:https://doi.org/10.1007/s41660-021-00160-z.
- Qin, J., X. Liu, and W. Pedrycz. 2017. “An Extended TODIM Multi-criteria Group Decision Making Method for Green Supplier Selection in Interval Type-2 Fuzzy Environment.” European Journal of Operational Research 258 (2): 626–638. doi:https://doi.org/10.1016/j.ejor.2016.09.059.
- Rehman, M. A., D. Seth, and R. L. Shrivastava. 2016. “Impact of Green Manufacturing Practices on Organisational Performance in Indian Context: An Empirical Study.” Journal of Cleaner Production 137: 427–448. doi:https://doi.org/10.1016/j.jclepro.2016.07.106.
- Rong, J. Q., and L. Ling. 2012. “Research on Green Manufacturing Model for Circular Economy.” Applied Mechanics and Materials 201–202: 967–970. https://doi.org/10.4028/www.scientific.net/amm.201-202.967
- Santolaria, M., J. Oliver-Solà, C. M. Gasol, T. Morales-Pinzón, and J. Rieradevall. 2011. “Eco-design in Innovation Driven Companies: Perception, Predictions and the Main Drivers of Integration. The Spanish Example.” Journal of Cleaner Production 19: 1315–1323. doi:https://doi.org/10.1016/j.jclepro.2011.03.009.
- Sarkis, J., and A. Rasheed. 1995. “Greening the Manufacturing Function.” Business Horizons 38: 17–27. doi:https://doi.org/10.1016/0007-6813(95)90032-2.
- Setyaningsih, I., W. Slamet Ciptono, N. Indarti, and N. Iman Vidya Kemal. 2019. “What Is Green Manufacturing? A Quantitative Literature Review.” E3S Web of Conferences 120: 01001. doi:https://doi.org/10.1051/e3sconf/201912001001.
- Sharma, V., S. Kumar, and M. L. Meena. 2021. “Key Criteria Influencing Cellular Manufacturing System: A Fuzzy AHP Model.” Journal of Business Economics. doi:https://doi.org/10.1007/s11573-021-01043-y.
- Singh, A. 2019. “An Integrated Approach Towards Ranking Hospitals Using Fuzzy AHP and ELECTRE-I Technique.” International Journal of Healthcare Management. doi:https://doi.org/10.1080/20479700.2019.1665881.
- Somsuk, N., and T. Laosirihongthong. 2014. “A Fuzzy AHP to Prioritize Enabling Factors for Strategic Management of University Business Incubators: Resource-based View.” Technological Forecasting and Social Change 85: 198–210. doi:https://doi.org/10.1016/j.techfore.2013.08.007.
- Srivastava, S. K. 2007. “Green Supply Chain Management: A State of the Art Literature Review.” International Journal of Management Reviews 9 (1): 53–80. doi:https://doi.org/10.1111/j.1468-2370.2007.00202.x.
- Thakur, V., and S. K. Mangla. 2019. “Change Management for Sustainability: Evaluating the Role Ofhuman, Operational and Technological Factors in Leading Indian Firms in Home Appliances Sector.” Journal of Cleaner Production 213: 847–862. doi:https://doi.org/10.1016/j.jclepro.2018.12.201.
- Toke, L. K., R. C. Gupta, and M. Dandekar. 2012. “An Empirical Study of Green Supply Chain Management in Indian Perspective.” International Journal of Applied Sciences and Engineering Research 1 (2): 372–383.
- Toke, L. K., and S. D. Kalpande. 2017. “A Framework of Enabler’s Relationship for Implementation of Green Manufacturing in Indian Context.” International Journal of Sustainable Development & World Ecology. doi:https://doi.org/10.1080/13504509.2017.1393635.
- Tol, R. S. 2018. “The Economic Impacts of Climate Change.” Review of Environmental Economics and Policy 12 (1): 4–25. doi:https://doi.org/10.1093/reep/rex027.
- Tseng, M.-L. 2013. “Modeling Sustainable Production Indicators with Linguistic Preferences.” Journal of Cleaner Production 40: 46–56. doi:https://doi.org/10.1016/j.jclepro.2010.11.019.
- Uddin, S., S. M. Ali, G. Kabir, S. A. Suhi, R. Enayet, and T. Haque. 2019. “An AHP-ELECTRE Framework to Evaluate Barriers to Green Supply Chain Management in the Leather Industry.” International Journal of Sustainable Development & World Ecology 26: 732–751. doi:https://doi.org/10.1080/13504509.2019.1661044.
- Walheer, B., and M. He. 2020. “Technical Efficiency and Technology Gap of the Manufacturing Industry in China: Does Firm Ownership Matter?” World Development 127: 104769. doi:https://doi.org/10.1016/j.worlddev.2019.104769.
- Wee, Y. S., and H. A. Quazi. 2005. “Development and Validation of Critical Factors of Environmental Management.” Industrial Management & Data Systems 105 (1): 96–114. doi:https://doi.org/10.1108/02635570510575216.
- Xu, L., K. Mathiyazhagan, K. Govindan, A. Noorulhaq, N. V. Ramachandran, and A. Ashokkumar. 2013. “Multiple Comparative Studies of Green Supply Chain Management: Pressures Analysis.” Resources, Conservation and Recycling 78: 26–35. doi:https://doi.org/10.1016/j.resconrec.2013.05.005.
- Yang, C. C., and B. S. Chen. 2004. “Key Quality Performance Evaluation Using Fuzzy AHP.” Journal of the Chinese Institute of Industrial Engineers 21 (6): 543–550.
- Yi, H. 2014. “Green Businesses in a Clean Energy Economy: Analyzing Drivers of Green Business Growth in U.S. States.” Energy 68: 922–929. doi:https://doi.org/10.1016/j.energy.2014.02.044.
- Zheng, D., and M. Shi. 2017. “Multiple Environmental Policies and Pollution Haven Hypothesis: Evidence from China’s Polluting Industries.” Journal of Cleaner Production 141: 295–304. doi:https://doi.org/10.1016/j.jclepro.2016.09.091.
- Zhou, X., Q. S. Zhang, M. Zhang, and X. Li 2008. “Research on Evaluation and Development of Green Product Design Project in Manufacturing Industry.” 2008 International Conference on Wireless Communications, Networking and Mobile Computing, Crete, Greece, August 6–8, 1–5
- Zutshi, A., and A. S. Sohal. 2004. “Adoption and Maintenance of Environmental Management Systems: Critical Success Factors.” Management of Environmental Quality: An International Journal 15 (4): 399–419. doi:https://doi.org/10.1108/14777830410540144.