
 ?Mathematical formulae have been encoded as MathML and are displayed in this HTML version using MathJax in order to improve their display. Uncheck the box to turn MathJax off. This feature requires Javascript. Click on a formula to zoom.
ABSTRACT
The growing concerns about the Earth’s climate system and the increasing importance of saving raw materials are critical challenges that supply chain members mostly face, leading companies to sustainability and ‘going green’ missions. Environmentally friendly inventory management is one of the most crucial and key decisions that creates innovative methodologies to achieve green growth. Hence, in this study, we analyse a newsvendor problem among manufacturers and retailers under random demand to facilitate sustainable and green growth approaches. In our analytical model, two ways are considered to meet the needs of retailers. In the first case, the retailer orders before the sales season, so the remanufacturer will have enough time to remanufacture returned products and provide the retailer’s needs with recycled materials. In the second case, the retailer will re-order after the start of the sales season in the face of a shortage. So, the remanufacturer will not have enough time to supply the retailer with returned materials, and the retailer’s order will be met with new products using raw materials. The model intends to study the effects of carbon footprint constraints, vertical integration, buyback contract, and retailer’s sales effort on inventory control systems with remanufacturers. Furthermore, sensitivity analysis is performed, and conclusions and future research directions are provided.
1. Introduction
The climactic ever-increasing trend of industrialisation, and population, as well as the growing use of natural resources have led to ascending greenhouse gas emissions, which results in increased global warming and environmental, ecological changes (Liu, Leat, and Smith Citation2011). As environmental consciousness grows across the world, businesses face severe pressures from a variety of stakeholders, namely the government and customers, to eliminate their detrimental and harmful impact on the environment (Luthra, Garg, and Haleem Citation2016). Hence, environmental protection and related strategies became a top priority as organisational innovation. In addition, many countries have enacted legislation or designed mechanisms to control the total amount of carbon emissions (Thamsatitdej et al. Citation2017), and firms responding to the intimidation of this legislation or concerns raised by their consumers or governments are taking initiatives to reduce their carbon footprint. Hence, not only should organisations pay painstaking attention to profitability and competitive advantages, but they also require to eliminate or minimise their environmental impacts. In such circumstances, in order to alleviate these environmental concerns, that lead to significant changes in the Earth’s climate system, topics and concepts such as Sustainable Supply Chain Management (SSCM) and Green Supply Chain Management (GSCM) had emerged as a prominent topic in supply chain management and immediately drew everyone’s attention (Toke and Kalpande Citation2019). GSCM refers to incorporating environmental concerns into the organisation’s traditional supply chain to achieve sustainable development. GSCM can be adopted to alleviate environmental degradation and to control various types of pollution through the utilisation of green strategies in business activities. By examining the meaning of sustainability and going green, we find that economic, social, and environmental factors should be satisfied to achieve sustainability and green goals. In other words, GSCM and SSCM look at the long-term effectiveness and continuity of the supply chain, given the history of the supply chain and its future growth path. This allows supply chain members to look beyond the present while making policy decisions.
Customers’ attention to environmental issues, gaining public image, adapting to a competitive market, and increasing regulatory requirements for social responsibilities are the most critical factors in managing and creating business in the global marketplace. According to Testa and Iraldo (Citation2010), there is a direct link between implementing GSCM techniques and improving an organisation’s reputation and brand image. Therefore, competent managers focus on creating sustainability and increasing their environmental performance alongside gaining more profits. For instance, Wal-Mart managers adopted green packaging strategies which not only resulted in preventing millions of pounds of waste from reaching landfills, but also reduced roughly 213,000 trucks for transportation, thereby saving 67 million gallons of diesel as well as 324,000 tons of coal yearly. In this regard, some essential initiatives to put GSCM into practice to promote superior environmental sustainability comprise purchasing green materials that are renewable or need less energy to harvest and develop, reusing and recycling of products, reverse logistics, and providing green training to employees (Narayanan and Thirunavukkarasu Citation2021). Among these principles, recycling, remanufacturing, and reusing of returned products are the most prominent success factors that play a crucial role in achieving broader goals of GSCM (Sazvar et al. Citation2021). By remanufacturing and recycling returned flows, the consumption of raw materials is significantly reduced. Also, the remanufacturing cycle can be much shorter than the initial production cycle. This approach aims to achieve a green product and reduce environmental pollution. However, organisations rarely use remanufacturing and recycling capabilities and many firms have not yet adopted these practices due to barriers hindering their implementation. Some of the major obstacles include lack of government cooperation, expensive recycling technologies, insufficient funds, lack of top management commitment, poor company knowledge about the type of contracts and cooperation through which supply chain members can achieve their green goals, and the need for more detailed and complex planning for recycling and remanufacturing apart from just using raw materials (Rahman et al. Citation2020). Therefore, governments and legislatures must introduce laws in this regard or consider the benefits of encouraging firms to produce green products and increase their low-carbon preference and environmental performance. However, in practice, deciding a proper mechanism for reducing carbon can be tough and difficult, a difficulty that stems from the inherent fluctuations in the demand and supply of products. This, in turn, makes it troublous for both companies and policymakers to conveniently evaluate the effects of carbon emission considerations. Thus, if supply chain managers exert the appropriate method to improve their carbon performance among a variety of approaches, namely cap-and-trade or a carbon tax, the efficiency of the supply chain and social welfare can be enhanced.
Nevertheless, green supply chain strategies are impossible to be employed without the actual participation of all members. In better words, the prosperity and success of GSCM practices hinge on the adoption of sustainable procedures throughout the entire supply chain. Lack of coordination between all supply chain members can dramatically intensify the overall carbon footprint (Lee and Chu Citation2005). In this regard, inventory management systems are joint initiatives that have been theoretically and experimentally proven to enhance supply chain performance and responsiveness (Radfar and Mohammaditabar Citation2019). Inventory management systems have been developed to overcome a number of issues concerning the amount of space required on retail shelves, the quantity of stock to be stored on hand, inventory obsolescence and replenishment, and the management of returned products, which can greatly reduce overall environmental impacts if wise decisions are made about them (Fakhrzad and Lotfi Citation2018). Such risks of overstocking or understocking virtually emerge as a result of the randomness of demand, unreliable planning and forecasting, and poor purchasing methods. To alleviate these kinds of risks coordination mechanisms have been suggested (Parthasarathi, Sarmah, and Jenamani Citation2011). Since supply chain contracts play a significant role in the better coordination of members, some influential and effective contracts have been applied to enhance member interaction as well as to increase profits. Thus, the main objective of this research is to reduce the risks faced by supply chains, which are caused due to the random nature of the retail demand, by providing an inventory system to analyse a newsvendor problem with coordination among manufacturers and retailers to facilitate decision-making for sustainable and green growth approaches. To attain this goal, this study examines the following main research questions:
What effects does the addition of environmental restrictions (carbon footprint) have on whole supply chain planning?
How to analyse the manufacturer’s profit in the model?
What is the role of the vertical integration approach in the coordination of a centralised inventory control system?
What is the role of the buyback contract in the coordination of a decentralised inventory control system?
What is the role of the retailer’s effort and Sales Reward and Penalty (SRP) contract in the total profit of the supply chain?
To answer the above questions, this paper studies a newsvendor problem with coordination among suppliers and retailers under 6 distinct models with various features to facilitate decision-making for sustainable and green growth approaches in different market conditions and under different contracts.
The remainder of this study is arranged as follows. In section 2, a review of relevant studies is provided. Section 3 explains the developed models and the equilibrium equations of the models. In Section 4, computational results and numerical illustrations are reported. Finally, Section 5 draws managerial insights, conclusions, and future research directions.
2. Literature review
Inventory management and supply chain practices can be divided into diverse categories, and recently, the topics have been raised on GSCM. In this section, first, we will provide an overview of research on GSCM and environmental concerns. Then, we will discuss recent studies on marketing effort, return policy, and the Revenue Sharing Contract (RSC), that maximise the profits of all components of the supply chain.
Recently, the concept of environmental sustainability and the ‘going green’ mission has attracted the attention of researchers (Bansal and Roth Citation2000). A review of the literature revealed that virtually all works in this field can be classified into two categories: GSCM and environmentally friendly inventory management. Supply chains significantly impact environmental concerns, including carbon emission, pollutions, and ecological balance. Mawandiya, Jha, and Thakkar (Citation2017) developed a two-echelon closed-loop production-inventory model to adopt an optimal policy for the players by minimising the joint total cost. Moghadam, Aghsami, and Rabbani (Citation2021) proposed a closed-loop supply chain network based on the e-commerce context. A supply chain configuration model for a green product was formulated by Hong et al. (Citation2018) to optimise the service time and option selection decisions in order to minimise overall costs. Dey, Roy, and Saha (Citation2019) analysed the impact of strategic inventory on the development of green products under different procurement approaches. In another study, Mohtashami, Aghsami, and Jolai (Citation2020) designed a green closed-loop supply chain considering a queuing system to minimise environmental impacts caused by transportation and loading in collection centres. However, the growing importance of GSCM is not just about being environment-friendly; it is also about higher profits and beneficial business sense (Liu Citation2019). There are several proper and lucrative strategies to pursue this aim along with boosting green performance. One of the essential ways to achieve this goal is to form a proper reverse system, which causes quite a few old or outdated products to be reprocessed and then reused. This consequently reduces the consumption of raw material resources. Roy and Whelan (Citation1992) discussed effective recycling through value-chain collaboration. Analysing the impact of the returned material on inventory control was addressed by Fleischmann and Kuik (Citation2003). The work of Kainuma and Tawara (Citation2006) extended the scope of the supply chain to include reuse and recycling throughout the life cycle of products and services. They addressed lean and green multiple utility theory to evaluate green supply chain efficiency from an environmental performance standpoint. Shaharudin et al. (Citation2019) discussed the mediating effects of product returns on the environmental sustainability of a firm. Another effective way is to use green sourcing approaches; which, according to Min and Galle (Citation2001), promotes waste reduction by enhancing recycling, remanufacturing, and other green activities. Malekkhouyan, Aghsami, and Rabbani (Citation2021) developed a novel integrated multi-stage model for a comprehensive e-waste management problem in three levels of vehicle routing, disassembly sequence scheduling, and allocation of vehicles for transporting components. Zailani et al. (Citation2015) emphasised that eco-friendly sourcing has a favourable impact on firms’ operational and environmental performance. Yang et al. (Citation2010) categorised green ordering and purchasing into five main facets and highlighted that green sourcing activities could enhance a company’s overall performance. Green sourcing is a proven method to reduce waste as well as air and water pollution in corporate operations.
Additionally, growing concerns about the Earth’s climate system and carbon footprint have led governments and policymakers to propose legislation and agreements. For instance, the carbon cap policy was proposed by the congressional budget office, congress of the United States, as an alternative to diminishing carbon emission. The carbon cap determines the acceptable amount of carbon dioxide that can be released by a firm per year. The European Union emissions trading scheme is another case in point that serves as a cap-and-trade system for energy-intensive industries. Hence, with the growing concerns about carbon emissions, numerous studies have been conducted on tracking the carbon footprint caused by an industrial organisation or product over the past decades. A study of the literature revealed that there exist several ways to deal with the carbon footprint issue. The consequences of carbon emissions can be included in financial objectives as in carbon tax and cap-and-trade systems, or in constraints as an obligatory limit on carbon emission, or in cost objectives as emission penalty (Arıkan and Jammernegg Citation2014). In this regard, Hua, Cheng, and Wang (Citation2011) presented an analytical model that examines the operations decisions in inventory management with a sight of managing a firm’s carbon footprints under carbon trading mechanisms. They derived that the lack of coordination among the entire supply chain can dramatically increase the overall carbon footprint. The presence of emission regulation can remarkably increase the value of supply chain collaboration as well (Benjaafar, Li, and Daskin Citation2012). In another study, a newsvendor inventory control system is examined by Song and Leng (Citation2012), considering a mandatory capacity for carbon emissions as well as a cap-and-trade system. Rezaei, Aghsami, and Rabbani (Citation2021) studied a supplier selection and order allocation problem considering disruption and environmental risks in a centralised supply chain. Lamba, Singh, and Mishra (Citation2019) proposed a mixed-integer nonlinear programming (MINLP) model for supplier selection to reduce the overall carbon footprint and costs of a supply chain. Zanoni, Mazzoldi, and Jaber (Citation2014) presented a single product model for a vendor-managed inventory system, taking into account emission costs as well as penalties paid for exceeding the emission quota. Rong and Xu (Citation2020) presented a model with carbon footprint constraints to study the impact of pure RSC and RSC through a bargaining contract on the green level improvement of manufacturers. Wang and Hui (Citation2020) presented a manufacturer-retailer supply chain that aims to investigate the effect of joint carbon emission decline on the income of the retailer and the manufacturer.
Several papers in the supply chain literature have been dedicated to the study of the economic advantages due to implementing partnerships. Coordination among manufacturers and retailers in the area of newsvendor problems with effort is one of the topics in the literature. One of the first attempts to examine supply chain coordination is related to Taylor (Citation2002). The work of He et al. (Citation2009) is an example of coordinating a supply chain with effort to meet stochastic demand. Considering simultaneous sensitivity to the sale effort and retail price as well as exploring a variety of contract types in an analytical method are the characteristics of their work. Yu, Zeng, and Zhao (Citation2009) evaluated vendor-managed inventory partnership applying evolutionary game theory and revealed that partnership and collaboration could benefit the entire chain through raising the transaction quantity. They also indicated that it is essential for retailers to share profit with suppliers to cover later losses and to sustain long-term benefits. Yang et al. (Citation2015) studied a newsvendor-modelling framework to analyse coordination issues, while the manufacturer offers mail-in rebates directly to consumers, and the retailer exerts promotional efforts to stimulate further consumer demand. Yan and Zaric (Citation2016) studied a supply chain in the presence of retailer effort. Classifying all possible coordinating contracts for the model with promotional effort and comparing the retailer-effort and dual-effort models are among the contributions of their work. Also, various researchers have studied the area of newsvendor problem with advertising. For example, Li and Li (Citation2018) considered Nash’s bargaining fairness concerns and sales efforts to design a combined contract, containing sales reward, buyback, and penalty contracts, to solve the problem.
According to the above discussion, the literature demonstrates that despite its functional significance, the impacts of adding environmental constraints on the whole chain are rarely addressed in supply chain planning. There are few papers that studied the role of retailer’s effort in total profit. Besides, there is no previous study on manufacturer’s profit analysis. Furthermore, none of them investigated the role of vertical integration approach and buyback contract in coordinating a centralised inventory control system.
To overcome these shortcomings and fulfill these gaps in the literature, this paper analyzes a newsvendor problem with coordination among manufacturers and retailers to facilitate decision-making for sustainable and green growth approaches. In our analytical model, the retailer (newsvendor) encounters random demand; hence, deciding about its order quantity can be arduous. Two ways are considered to supply retailer’s orders. In the first case, the retailer orders before the sales season, so the manufacturer has enough time for remanufacturing operations and provides the retailer with products made from recycled materials. In the second case, the retailer will re-order after the start of the sales season and facing a shortage. However, in this situation, the manufacturer will not have enough time to supply all retailer’s demands with recycled materials, hence, the manufacturer will satisfy part of the retailer’s order with raw materials. The main contributions and intentions of the model are to: (1) study the total profit of two members of the supply chain in a retailer inventory control system with and without the remanufacturing ability of the manufacturer, (2) investigate the coordination of inventory control system with remanufacturing channel under vertical integration (centralised) and carbon footprint constraint, (3) investigate the coordination of centralised inventory control system under buyback contract, and (4) survey the coordination of centralised inventory control system under retailer’s sales effort and SRP contract. Eventually, equilibrium results and optimal values are obtained for the stated decision models based on K.K.T conditions.
3. Inventory control with environmental concerns
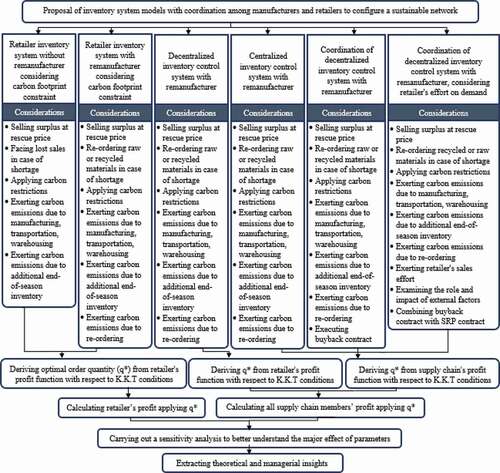
Inventory policies under different inventory systems are provided in this section. The framework of the research problem, including all proposed models and their features, is depicted in .
Figure 1. Framework of the present research
3.1. Retailer inventory system without remanufacturer considering carbon footprint constraint
In this section, we study the classical newsvendor problem by considering the overall carbon footprint. In this regard, a comprehensive description of the classical single-sourcing newsvendor problem without remanufacturing can be found in Wang et al. (Citation2019). The expected retailer’s profit is calculated by EquationEquation (1)(1)
(1) , where the retailer orders q units, which are produced by the manufacturer with the production cost c and the wholesale price b per unit. The retail price is p per unit, and the additional inventory in the retailer will be sold to customers at price s (rescue price) per unit.
The resulted emissions from manufacturing, transportation, and warehousing (), and the remainder at the end of the sales season (
) are considered as two different sources of emissions in this single sourcing model (Choi and Chiu Citation2012). If q is the order quantity, the total expected emissions are:
is a non-decreasing convex function of q since the first and second derivatives of
with respect to q satisfy
and
, respectively.
With respect to the work of Arıkan and Jammernegg (Citation2014), the retailer wants to keep the average emissions per ordered unit below the target level e. The target level e can be interpreted as a product carbon footprint benchmark per unit, e.g. from an industry standard or derived from a carbon capacity constraint. In detail, we suppose that the retailer is restricted by a mandatory upper emission limit on its carbon emission, known as the carbon cap. The carbon cap can be enforced by government organisations as a carbon regulatory policy or can be imposed by the company itself to attain the green objectives of the company (Chen, Benjaafar, and Elomri Citation2013). So, the newsvendor problem is to find the order quantity which maximises
subject to the constraint on total carbon emissions:
Where B(q) stands for the total benchmark emissions from ordering q units, i.e.:
With respect to K.K.T conditions to find the optimal point of the constrained problem, the optimal order quantity of this problem is obtained from the solution of the following equations:
3.2. Retailer inventory system with remanufacturer considering carbon footprint constraint
A significant amount of old or returned used products can be reprocessed and then be reused. In this section, we consider an inventory system with only one initial manufacturer, where returned products can be remanufactured. In this regard, the manufacturer with raw materials is expensive but fast, while the orders from the reproduction channel, will be cheap but slow. In such a situation, the retailer orders in advance, before the start of the sales season, and the demand is random. The manufacturer has enough time at this stage to reproduce the returned products and sell them to the retailer. After the start of the sales season and the finalisation of demand, the retailer reorders the products in the case of stock shortages. At this stage, the manufacturer is able to provide only part of the order from recycled materials due to lack of time. Therefore, the surplus should be made from raw materials. Thus, the classical single-sourcing system transforms into a three-source system. It is appropriate to imagine that there are three sources for products. One of them only provides utterly intact and new products. In contrast, the other two reproduce old and returned products and sell them to the retailer after reprocessing, however, one of them is ordered at orderly times and the other in emergencies.
In this problem, we assume that the remanufacturer has no capacity limit to meet the order before the start of the sales season. In such a system, products are sold at the same sale price of p per unit, but the procurement prices of manufacturers are different. Denote the procurement price from the remanufacturing channel as while the procurement price from the manufacturer with raw materials as
. As stated, the procurement price from the manufacturer with recycled materials (remanufacturer) is less than the manufacturer with virgin material:
. In addition, as in problem 3.1, it is assumed that
.
If the retailer’s order quantity before the start of the sales season is indicated by , and R represents the manufacturer’s capacity to meet the demand by recycled materials in times of emergency, the retailer’s profit function in terms of the order quantity is equal to
Then, the expected retailer’s profit is:
Using EquationEquation (8)
(8)
(8) is simplified to
The first and second derivatives of EquationEquation (9)(9)
(9) with respect to
are:
Based on the above assumption, it is clear that the second derivative of the profit function (EquationEquation (11)(11)
(11) ) is non-positive, so the function is concave and has a relative maximum.
If represents order quantity,
represents carbon emitted by re-ordering virgin material, and
represents carbon emitted by re-ordering recycled material, then the total expected emissions are:
So, the order quantity before the sales season () which maximises
subject to the constraint on total carbon emissions, is obtained by:
Where B () represents the total benchmark emissions from ordering
units, i.e.
.
With respect to K.K.T conditions to find the optimal point of the constrained problem, the optimal order quantity of this problem is obtained by solving the following equations.
3.3. Decentralised inventory control system with remanufacturer
If the production costs of products with recycled materials and ones with virgin materials are denoted as and
, respectively, for ordering quantity as much as
the manufacturer’s profit is equal to:
Then, the expected manufacturer’s profit is:
After simplifying, the above equation is equivalent to
Equation (7) represents the retailer’s profit function in the case of a manufacturer with recycled materials for units of the order quantity. On the other hand, the value
is calculated from Equation (15). Therefore, the expected manufacturer’s profit in a decentralised state is calculated through EquationEquation (19)
(19)
(19) .
The entire supply chain’s expected profit will be the total profit of the two members of the supply chain:
So, the total profit of the supply chain based on the optimal retailer order () is equal to:
3.4. Centralised inventory control system with remanufacturer
In vertical integration, the manufacturer and the retailer meet the same market. In other words, the manufacturer and the retailer are managed by a centralised decision-maker. In this case, the retailer’s order quantity is calculated by maximising the total profit of the supply chain. As stated in the previous section, the total supply chain profit is calculated by EquationEquation (21)(21)
(21) . Also, the first and second derivatives of EquationEquation (21)
(21)
(21) with respect to
are:
Given the , EquationEquation (23)
(23)
(23) is always negative, as a result, EquationEquation (21)
(21)
(21) has absolute maximum. Also, the expected emitted carbon level is calculated in terms of the retailer’s order quantity from EquationEquation (12)
(12)
(12) . Therefore, the order quantity before the sales season (
), which maximises
subject to the constraint on total carbon emissions is obtained:
Due to the K.K.T conditions to find the optimal point of the constrained problem, the optimal order quantity of this problem is obtained by solving the following equations.
3.5. Coordination of decentralised inventory control system with remanufacturer
The role of buyback contracts to achieve channel coordination was established by Pasternack (Citation2008) in a single-period, multi-retailer inventory model. To achieve channel coordination, one of the two autonomous decision-makers, i.e. the manufacturer and the retailer, should act in harmony in a way to maximise the supply chain’s total profit. Since the retailer always prefers to order less than (a quantity that is optimal for the whole supply chain), which results from the case that the manufacturer prefers a higher wholesale price than
, it is impossible in our problem to maximise the supply chain total profit. This is referred to as double marginalisation. Due to double marginalisation, a wholesale contract cannot coordinate the supply chain. Buyback contracts provide the retailer and the manufacturer with mechanisms to share the inherent risks in the supply chain. Wholesale price (
) and buyback price (B) for each unsold unit are determined by the manufacturer in the supply chain. Additionally, the value of redeemed goods for the manufacturer is considered as
, where
is the rate of decline in the value of goods.
In the buyback contract, the retailer’s profit function with respect to
and B leads to:
Moreover, in the buyback contract, the retailer’s expected profit is:
Also, the manufacturer’s profit function in terms of
and B is:
Then, the expected manufacturer’s profit is:
The expected profit of the supply chain derives from the sum of the profit of two chain members. Therefore, with respect to EquationEquation (28)(28)
(28) and EquationEquation (30)
(30)
(30)
The first and second derivatives of EquationEquation (31)(31)
(31) with respect to
are:
The EquationEquation (33)(33)
(33) is always negative, which indicates that the EquationEquation (31)
(31)
(31) is concave, so we are able to calculate the optimal order quantity from the perspective of the entire supply chain (through EquationEquation (32)
(32)
(32) ), as follow:
By solving EquationEquation (34)(34)
(34) , the optimal order quantity in buyback contract (
) is calculated in terms of the wholesale price (
).
The minimum redeemable price should be determined in such a way as to increase the retailer’s profit, compared to before the buyback contract. In other words, the retailer’s profit after the buyback contract, which is calculated from EquationEquation (28)(28)
(28) , must be higher than the maximum retailer’s profit in the decentralised state (EquationEquation (9)
(9)
(9) ), which was previously calculated. Also, the maximum redeemable price must be set so that the manufacturer does not be deprived of, from before the buyback contract.
Therefore, condition 35 (determines the minimum return price ) and condition 36 (determines the maximum return price
) must be established.
If the interval [,
] is non-empty, then the fair amount of this range may be chosen based on the bargaining power of both sides to coordinate the supply chain. The wholesale price is also calculated based on the redemption price using EquationEquation (34)
(34)
(34) .
3.6. Coordination of decentralised inventory control system with remanufacturer and considering retailer’s effort on demand’s amount
Promotional effort can affect random demand, which usually challenges retailers. To achieve the best performance of the whole supply chain, the supply chain members should know the characteristics of demand, and they need to set a contract format. Also, the retailer determines the order quantity and effort level. Market demand, a continuous random variable with distribution and density, is sensitive to the promotional effort exerted by the retailer. Promotional effort induces higher demand, and we use it as the final market demand under the retailer effort level (k). The purpose of supply chain coordination is to maximise the entire supply chain’s profit. To authorise a benchmark for the comparative analysis, we start our analysis with the whole supply chain. To make an applicable contract for the system, the optimal solution to the channel profit produces the guidelines for us. Moreover, the sale effort cost is calculated as , where h is the cost coefficient of sale effort level per unit (Ranjan and Jha Citation2019). Thus, the integrated supply chain’s profit can be expressed as follows:
Where is a non-negative random variable that represents the role and impact of other external factors (besides effort, such as economic, social, and cultural conditions) on customers’ demand.
To address the problem, we use a method that is discussed in the work of Li and Li (Citation2018). We add SRP contract into a buyback contract. In the combined contract, manufacturers and retailers first set the contract in the form of a repurchase contract (, B). The reward and punishment mechanism can monitor the retailer’s sales efforts by setting a target sales volume. Therefore, this paper applies a combined contracting strategy (T, τ): combining a buyback contract with a rewards and punishments contract to coordinate the supply chain, which means that supply chain members set the target sale quantity (T) at the beginning. If retail sales are beyond the target T, the retailer will get a reward of τ for per unit product sold above T. Otherwise, the retailer will need to pay the manufacturer a payment τ for each unit of product unsold below T. Therefore, based on the designed content of the above combined contract, the profit function of the supply chain and each member can be obtained as follows:
The expected retailer’s profit is:
Using , the EquationEquation (38)
(38)
(38) is simplified to:
Then, the expected manufacturer’s profit is:
Therefore, the expected total profit of the supply chain is equal to
the first and second derivatives of EquationEquation (41)(41)
(41) with respect to
and k are:
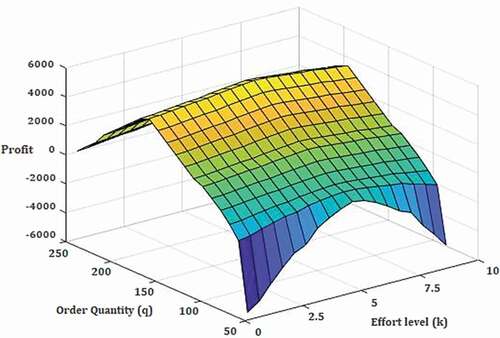
Given that calculating the unmixed and mixed second-order partial derivatives of the supply chain profit function and determining their sign in the Hessian matrix are so complicated, to prove that the profit function is concave, the numerical analysis is applied to characterise the supply chain profit’s behaviour. The concavity of the profit function is revealed by plotting the fluctuation of the profit function based on the changes in order quantity and effort level in the numerical analysis section.
4. Computational results
In this section, to achieve a better understanding of the model presented in the previous sections, some numerical experiments are provided. Typical data are selected from Wang et al. (Citation2019) paper and are presented in .
Table 1. Base case parameters
4.1. Analysing the effect of carbon footprint constraint
In this section, the newsvendor model calculates the optimal amount of ordering and retailer profit in the presence of carbon footprint constraints and without any constraint, and the results are compared. The optimal order quantity in the absence of constraints with respect to EquationEquation (1)(1)
(1) is equal to:
.
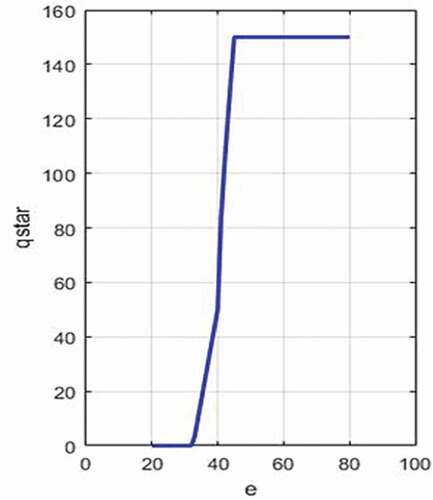
On the other hand, the optimal order quantity considering carbon footprint constraints and through EquationEquations (2)(2)
(2) , (Equation5
(5)
(5) ), and (Equation6
(6)
(6) ), concerning the allowable amount of carbon produced per unit product (e) has shown in . As shows, the ordering value before reaching the optimum order quantity without limiting the produced carbon depends on the allowed amount of carbon. After that, an increase in the allowable amount of carbon will not affect the optimal solution.
Figure 2. Optimal order quantity according to the amount of carbon production
displays the trade-off and compromise between two values of the allowable amount of carbon emission and the amount of profit, which provides decision-makers or experts with the opportunity to select the best pair of profit value and allowable carbon emission based on their preference and utility.
Table 2. The trade-off between allowable carbon emission and profit
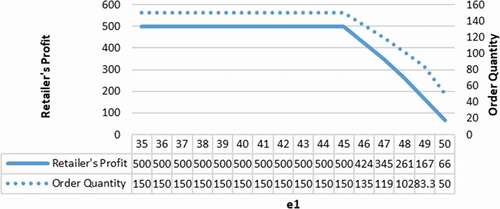
is devoted to an analysis of the amount of carbon emissions from manufacturing, transportation, and warehousing processes () that have a significant impact on the model. As can be seen, increasing
, and keeping other parameters including benchmark emission fixed, do not initially affect retailer’s order decisions, but after a while, when the amount of emission reaches a great rate, the situation becomes acute. Therefore, the retailer is forced to reduce its order quantity so that the amount of carbon emitted from supply chain activities does not exceed the allowable amount. In addition, since the order quantity influences the retailer’s profit, the profit declines dramatically when orders decrease.
Figure 3. Alteration of order and profit according to increases in the carbon emission from supply chain processes
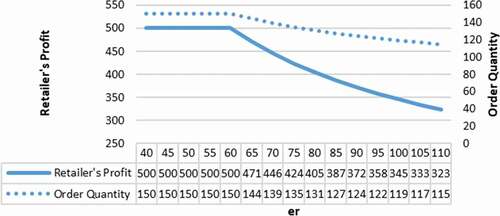
The impact of the parameter of carbon emissions from the remainder of products at the end of the sales season () on the research problem is investigated in . The behaviour of the profit and order of the retailer due to the fluctuation of
is similar to the previous case, except that the slope of the changes in the prior case was very steep. As well, in this case, the total profit is reduced to a much smaller amount. In better words, the variation of
is much more influential in retailer’s decision-making and profit than is
.
Figure 4. Alteration of optimal values according to increases in the carbon emission from end-of-season goods
exposes the fluctuation of the order quantity and profit of the retailer due to the variation of the rescue price (s). reveals that as the rescue price increases, so does the order quantity, because in this case, the retailer is less afraid of facing excess inventory due to the higher rescue price, therefore, takes more risk in placing an order. Subsequently, by increasing the rescue price, if the supply outpaces the demand and the stock amount exceeds the projected demand, the retailer can sell the excess inventory to customers at a better rescue price, which raises the retailer’s profit.
Figure 5. Alteration of order quantity and profit according to the rescue price increase
4.2. Analysing the importance of remanufacturing ability
We examine the order quantity and the expected profit of the classical single period inventory system with and without the remanufactured channel.
Varying the procurement price (order cost) from the manufacturer with virgin materials (), and keeping other parameters fixed, is provided. As displays, the higher
, the greater the retailer’s order before the sales season, because if the retailer encounters a shortage during the sales season, the needed products must be purchased at much higher prices. In better words, the situation becomes difficult and strict for the retailer, since in order to avoid shortages, the retailer has to increase the order quantity which may lead to excess inventory and consequently less profit. Therefore, as
increases and the conditions become severe, the profit of the retailer declines. Another important point is that when
decreases until it equals the procurement price from the remanufacturing channel with recycled materials (
), the retailer prefers to order at the lowest possible amount (50 products) because, in case of shortage, the retailer can meet the demand by purchasing products at the same price.
Figure 6. Fluctuation of order quantity and profit according to increases in the order cost of products with virgin materials
illustrates the impacts of order cost from the remanufacturing channel () on order quantity and profit. The higher
, the more the retailer refrains from ordering a large number of products before the sales season. As
increases and approaches the cost of ordering products from raw materials (
), in order to prevent surplus, the retailer prefers to place fewer orders and purchase products during the sales season only when facing deficiency. Moreover, the retailer’s profit decreases because of the increase in order cost. However, the retailer’s profit is always higher than the case without remanufacturing channel, that is, section 4.1 with order quantity:
and profit:
. We claim that not only are the remanufactured products which are sold to the retailer beneficial to environmental protection, but they also make the retailer’s expected profit increase.
Figure 7. Results of optimal values due to the increases in order cost of products with recycled materials
illustrates the fluctuations of the order quantity and profit due to the variation of the manufacturer’s capacity to meet the demand by recycled materials in times of emergency (R). According to , the more the manufacturer is capable of providing products from recycled materials during the sales season, the less the retailer orders before the sales season. In such circumstances, the retailer orders far more safely during the sales season because the shortage of products can be compensated by purchasing lower-price products produced by recycled materials from the manufacturer. The retailer’s profit also increases slightly since the retailer does not order large quantities before the sales season, ensuring that the manufacturer is able to remanufacture more products with recycled materials during the sales season. By so doing, the surplus of stock will not be large if the demand is slight, and as a result, the lower the extra inventory, the greater the profit of the retailer.
Figure 8. Optimal values under changing manufacturer’s capacity for recycling products
4.3. Analysing Centralised and Decentralised inventory systems
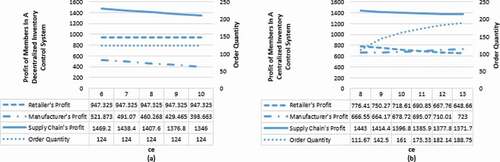
In this section, the order amount in centralised and decentralised decision-making is calculated, and the total supply chain profits are compared. In comparison of the two models, due to the fluctuation of the rescue price (s), in all cases, the use of a centralised supply chain increases the total profit (). As can be seen, the higher the rescue price, the better the situation for the entire supply chain, because the surplus products are sold at a better price in this case. Therefore, the retailer’s order also increases due to not worrying about facing excess inventory. This increase in order quantity leads to an increase in the manufacturer’s profit in both inventory systems. On the contrary, in the centralised system, in order to increase the profit of the whole chain, the retailer is forced to order more than the order amount of the decentralised system (where only the retailer’s profit is considered to determine the optimal order quantity), which causes the retailer’s profit to decline in the centralised inventory system.
Figure 9. Profits and order quantity vs. the rescue price ((a), Decentralised System; (b), Centralised System)
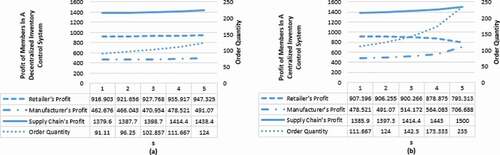
represents the changes in order and profit due to the variation of the procurement price of products from virgin materials (). The amounts of retailer’s order and profit in the decentralised inventory system are exactly the same as the values in section 4.2. Besides, since the retailer’s order and
increase, the profit of the manufacturer rises significantly, however, the entire supply chain’s profit increases slightly, due to the retailer’s profit reduction. While in the centralised inventory system, the order quantity and the total profit of the supply chain do not change with the fluctuations of
, and the losses and gains due to price changes are divided between the retailer and the manufacturer. In this way, as
increases, the retailer’s profit gradually diminishes and is added to the manufacturer’s profit.
Figure 10. Profits and order quantity vs. the order cost of products with virgin materials ((a), Decentralised System; (b), Centralised System)
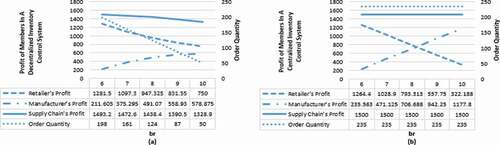
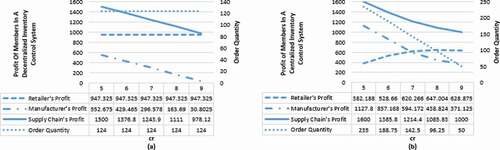
The changes in profit for each member and order quantity against procurement price from the remanufacturing channel () is shown in . According to , with the increase in
, in the decentralised system, the retailer’s order and profit are the same as in section 4.2. In addition, the manufacturer’s profit increases due to the growth in the order cost and the fact that the retailer is forced to buy products made from raw materials at a higher price during the sales season in the event of a shortage. However, since the order quantity drops sharply in this case and the retailer’s profit greatly reduces, the profit of the entire supply chain decreases as
increases. In the centralised inventory system, however, an increase in the order cost from the remanufacturing channel has no effect on the optimal order quantity and the overall profit of the supply chain. As in the previous case, in this case, the price growth is detrimental to the retailer’s profit, while it benefits the manufacturer’s profit.
Figure 11. Optimal values vs. the order cost of products with recycled materials ((a), Decentralised System; (b), Centralised System)
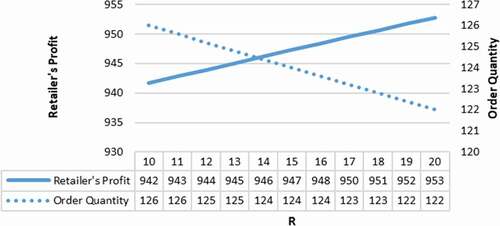
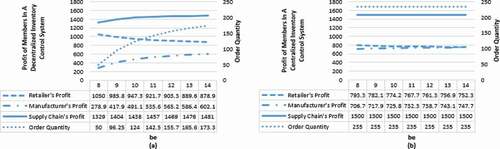
indicates the optimal values under the variation of the manufacturer’s capacity to meet the demand by recycled materials in times of emergency (R). By increasing R in both inventory systems, the order quantity decreases because in such cases, more recycled products can be purchased after facing a shortage. By so doing, the surplus is prevented as well. Thus, the retailer’s profit increases slightly due to the lack of large orders and the prevention of excess inventory. However, due to the reduction of the retailer’s order, the manufacturer’s profit decreases. Also, in the decentralised system, the retailer’s profit is always higher than in the centralised system, conversely, the supply chain’s profit is always lower. Additionally, with the increase in , the total profit in the centralised system is always constant and maximum, however, it increases partially in the decentralised system.
Figure 12. Profits and order quantity vs. the manufacturer’s capacity for remanufacturing products ((a), Decentralised System; (b), Centralised System)
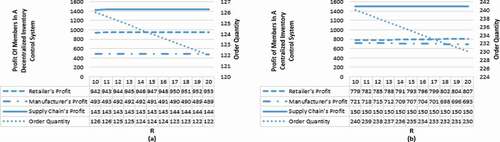
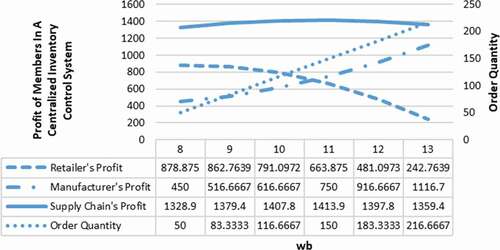
reveals the trend of changing the value of order and profits by increasing the cost of producing one unit with virgin materials (). A glance at this figure displays that in the decentralised system, the variation in
has no effect on the retailer’s ordering decisions; therefore, the retailer’s profit is always constant and maximum. On the other hand, due to the increase in production cost, the manufacturer incurs more production costs and gains less profit, as a result, the profit of the entire supply chain decreases. While, in the centralised system, the retailer’s order from the manufacturer rises in order to prevent a sharp decline in the total profit due to the reduction of the manufacturer’s profit. Thus, the manufacturer’s profit enhances and instead the retailer’s profit diminishes due to ordering more than its needs (the optimised amount that maximises the retailer’s profit, such as in the decentralised system). In this way, the profit of the whole supply chain is reduced to a lesser extent than in the decentralised inventory system.
Figure 13. Optimal values vs. production cost with virgin materials ((a), Decentralised System; (b), Centralised System)
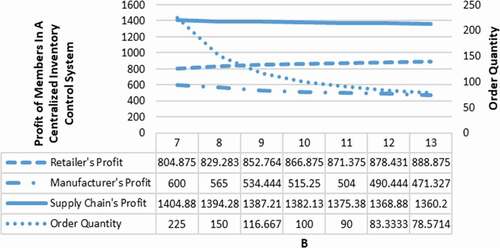
illustrates the fluctuations of optimal order and profits due to the variation of the production cost of a unit of product with recycled materials (. By increasing
, the fluctuations in the decentralised system are almost similar to the previous case. In this case, however, since nearly large amounts of retail order is before the sales season and is from the recycled products, by increasing the remanufacturing cost, the profits of the manufacturer and whole supply chain decline to a further amount than the prior case. Also, in the centralised system, the order quantity of recycled products before the sales season is drastically reduced due to the increase in
. Hence, the manufacturer’s profit reduces dramatically less than in the decentralised system. In contrast, the retailer’s profit initially increases significantly, which can be due to the approach of the order quantity to the optimal order for the retailer (124 products). This increase in the retailer’s profit continues until the order amount reaches the optimal value, but after a while, when the order quantity becomes much less than the optimal amount of the retailer’s order, a decline in the retailer’s profit is observed.
Figure 14. Optimal values vs. production cost with recycled materials ((a), Decentralised System; (b), Centralised System)
4.4. Analysing buyback contract
The analysis of the impacts of the buyback contract on the research problem and member’s decisions is investigated in this section.
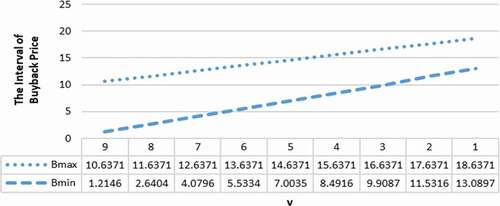
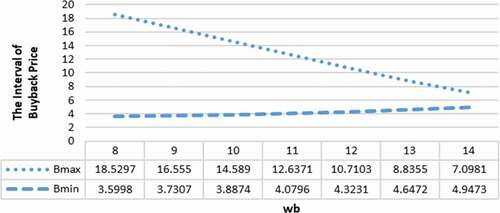
reveals the trend of changing the buyback price interval [,
] by increasing the value of redeemed goods for the manufacturer (
). As v decreases and redeemed goods become more valuable to the manufacturer, the optimal buyback prices for both members (
and
) rise, however, the price growth is greater for the retailer. In this case, since the redeemed products are of greater importance to the manufacturer, the more the value of v, the greater the minimum redemption price (
) that the retailer can bargain for. Contrary, the maximum redeemable price (
) increases with a gentler slope since the retailer has a greater relative capacity to compel or secure agreement and exert influence over the manufacturer. Hence, the higher v, the narrower the buyback price interval and the fewer the bargaining options.
Figure 15. Performance of the buyback price interval under fluctuation in the decline rate of the redeemed goods value
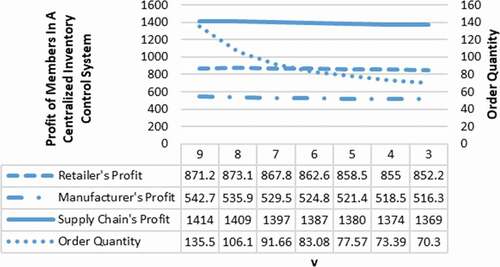
Since the buyback price range changes with the fluctuation of v (the decline rate of the value of redeemed goods), for each v the average of the buyback price interval (where neither member is superior to the other) is considered in order to obtain the fluctuation of order quantity and profits owing to the changes in v (). In such a situation, since with the decline in v, the redeemable price increases to a great extent, the manufacturer’s risk of accepting product return increases, that is, the manufacturer must pay a higher redemption price (B) to take the products back from the retailer. This causes the order quantity to decrease so that the risk-aversion of members reduces. Then, as a result of the reduction in order quantity, the profit of each member and consequently the total profit negligibly decrease.
Figure 16. Results of optimal values due to the decreases in the decline rate of redeemed goods value
illustrates the fluctuations in the buyback price interval [,
] due to the variation of the wholesale price (
). In this case, with the increment in
, as the conditions become more complicated for the retailer and more favourable for the manufacturer, the retailer refuses to withdraw from its optimal conditions (
). Thus, the retailer’s minimum redeemable price does not change much; however, the maximum redemption price (
) at which the manufacturer does not be deprived of before the buyback contract reduces. To clarify, by increasing the wholesale price, the manufacturer can achieve the desired profit in the buyback contract with a lower amount of redeemable price.
Figure 17. Alteration of buyback price interval according to increases in the wholesale price
displays the behaviour of the profit functions and order quantity due to the alteration of the wholesale price (). The diagram demonstrates that by increasing
, the order quantity value grows with a steady slope. Since if the order quantity diminishes due to wholesale price growth, this reduction decreases the manufacturer’s profit owing to the decline in retailer’s order, also the retailer’s profit alleviates due to the increase in costs, so the total profit will significantly decrease. Moreover, the chart shows that as
increases, the retailer’s profit decreases slightly at first. However, after a while, the retailer suffers a significant loss compared to the conditions where
was lower. In this situation, having to place more orders to enhance the entire supply chain profit, the retailer faces excess inventory during the sales season, which, with the growth of the wholesale price, leads to a sharp drop in the retailer’s profit. Nevertheless, announcing a higher wholesale price is in the manufacturer’s interest. According to , the model initially behaves in a manner that raises the total profit due to the increased manufacturer’s profit. Then, the performance of the model changes significantly with a decline in total profit due to the remarkable loss of the retailer.
Figure 18. Alteration of profits and order according to an increase in the wholesale price
reveals the trend of changing in optimal order quantity and profits by increasing the buyback price (B). A glance at this figure displays that as B grows, the retailer’s order decreases since if the retailer imposes more orders, the manufacturer has to pay greater for returned products in the case of facing surplus, which causes severe damages to the manufacture. Furthermore, as is evident, the greater the buyback price, the higher the retailer’s profit, as for each ordered unit that exceeds the demand amount, the manufacturer buys the excess inventory back at a better price from the retailer, whereas, the manufacturer’s profit is getting worse values. Nevertheless, the total profit negligibly reduces, since the buyback contract is a contract between the retailer and the manufacturer to share the inherent risks in the supply chain and this diminution is only due to the reduction of the order quantity.
In such cases, the manufacturer prefers the lowest possible buyback price, while the retailer tends to choose the highest value. Thus, determining the amount of buyback cost is based on the bargaining power of both sides. If the manufacturer has more bargaining power, the buyback price will be low, otherwise, it will be high.
Figure 19. Optimal values according to the buyback price
4.5. Analysing retailer’s sales effort and SRP contract
reveals the nature and concavity of the supply chain profit function. Hence, given that the profit function is concave, the supply chain can be coordinated if q and k satisfy the conditions of EquationEquations (42)(42)
(42) and (Equation43
(43)
(43) ) simultaneously. In this way, the profit of the supply chain system can reach the maximum value.
Figure 20. Graph of profit changes according to order quantity and effort level
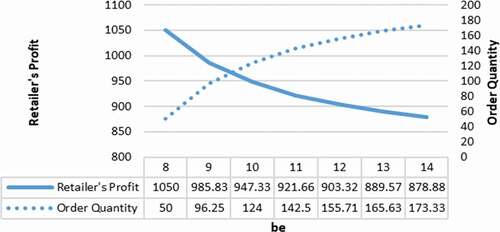
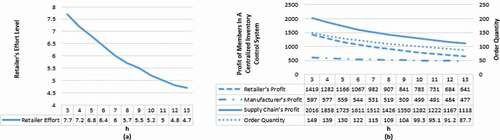
This section is devoted to the analysis of the sales effort cost coefficient (h), which affects the main parameters and decisions of the chain members. reveals that as the cost of effort grows, the level of effort decreases because the retailer has to pay more per level of effort. For instance, by increasing advertising cost, the retailer is forced to advertise less. This, in turn, reduces the impact of retailer’s actions on customer’s demand, and consequently, the retailer’s order declines due to the higher probability of having low demand. Therefore, as the order quantity reduces, the profits of the manufacturer and the retailer diminish, however, this reduction is greater in the retailer’s profit. The reason for these changes is that because of decreasing in the retailer’s effort, the retail sale becomes less than the target value, so the retailer is required to pay the manufacturer a payment (τ) for unsold products below the target value (T) according to the SRP contract.
Figure 21. Optimal values according to the sales effort cost coefficient ((a), Retailer’s Effort Level; (b), Optimal Order Quantity and Profits)
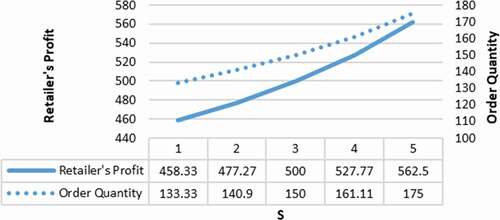
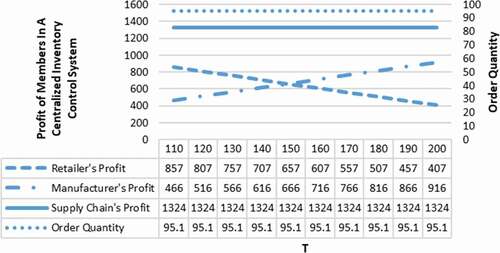
investigates the impacts of the target sales value (T) on the order quantity and member’s profit. Changes in T do not affect the effort level () and order of the retailer. This means that the retailer should only focus on the influential external factors and effort-related costs. Nevertheless, as the target value increases, the retailer’s profit decreases due to the growth in the number and consequently payment cost of unsold products according to the SRP contract, which results in an increment in the manufacturer’s profit. Hence the total profit will not change.
Figure 22. Fluctuation of order quantity and profit according to increases in the target sales value
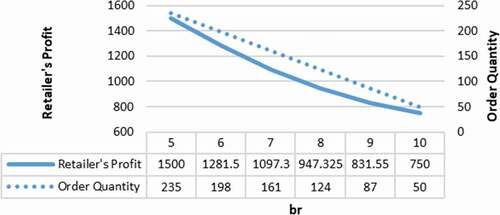
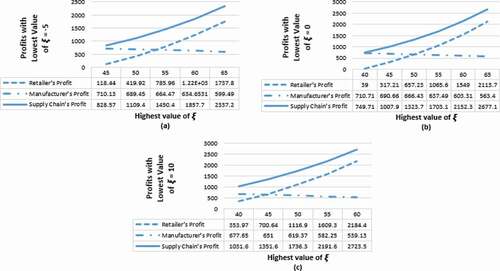
and present the fluctuations of the variables due to the variation of the impact of other external factors (e.g. economic, social, cultural conditions) on customers’ demand () which follows a uniform distribution. As is obvious, the more conducive and positive the impact of conditions on demand, the greater the effort retailer makes to attract customers. Thereafter, the demand increases and this increment promotes the retailer to raise the order quantity, which leads to a significant rise in the retailer’s and supply chain’s profit. However, as the retailer’s sales gradually exceed the target amount, the manufacturer’s profit decreases since the manufacturer has to pay the retailer more rewards.
Table 3. Results of optimal effort level and order quantity for the retailer due to the uniform distribution for
According to , in all cases, as conditions get better, the retailer’s profit increases exponentially since the retailer has to pay less penalty to the manufacturer on the sale quantity below the target. Also, after a while, the retailer receives a reward from the manufacturer due to improving the situation and selling more than the target. On the other hand, the manufacturer’s profit decreases owing to the reward being paid to the retailer. In addition, as shown in and (c), for the same values of the upper limit of , in a situation where the external factors are able to reduce demands to zero () (e.g. crises such as the Corona virus that caused many businesses to lose all their demand), the retailer makes less promotional effort to encourage customers to buy products, which has an undesirable impact on demand. As a result, the retailer’s profit is lower than when there is still demand for that particular product (). Similarly, according to , when external factors cause negative demand (return of products), such as when all the products of a brand are collected due to a flaw/malfunction, the condition becomes worse than the previous two cases, and retailer’s sales and profit wane. Also, since the retailer’s sales decline further in this case, the SRP contract is much more unpleasant to the retailer than in the previous two cases. Therefore, in such situations, it is a misconception that the retailer can overcome the bad situations by increasing the effort level, whereas this only increases the retailer’s costs and cause a further drop in the retailer’s profit.
Figure 23. Fluctuation of profits according to increases in the highest value of ((a), Lowest value of
; (b), Lowest value of
; (c), Lowest value of
)
5. Discussion and managerial insights
Based on this research, some practical and managerial insights are obtained to improve the literature of SSCM. A significant number of studies such as Wang et al. (Citation2019) and Hua, Cheng, and Wang (Citation2011) have investigated inventory management considering green growth perspectives. While in this study, greening is examined from a new point of view, which distinguishes this research from previous ones. This distinction is gained by considering the possibility of meeting the retailer’s needs with recycled materials before the sales season. Also, the retailer can re-order the manufacturer during the sales season and facing of shortage, which is one of the remarkable points of this study, while the shortage of retailers is not addressed in most studies. Another advantage of this study is the analysis of the effects of carbon footprint constraint, vertical integration approach, buyback contract, SRP contract, and retailer’s effort policy on inventory control systems with the remanufacturing channel. The presented model provides the managerial vision for supply chain managers through the following goals
Green image, responsibility, and environmental performance are important factors in gaining public image and attracting customers. However, as the numerical analysis of section 4.1 revealed, production, transportation, and warehousing operations have more serious impacts on carbon emissions compared to end-of-season goods. Hence, supply chain managers must strive to minimise the destructive effects of these activities. For instance, the use of renewable energies, fuel-efficient vehicles, green technologies, and energy-efficient warehouses can help managers achieve eco-friendly industrial processes that are beneficial to environmental protection and no longer detrimental to the order quantity and profit of the chain.
Based on the results from section 4.2, managers can invest more in the remanufacturing sector and increase this sector’s capacity, which leads to a reduction in environmental impacts and an increase in retailer’s profits.
Despite strategic decisions, tactical decisions related to supply chain flows, especially replenishment of inventory, play a pivotal role in reducing costs as well as increasing customers’ satisfaction. Thus, managers need to properly plan supply chain decisions to minimise their inventory costs. The proposed inventory management increases the knowledge of retailer managers to adopt appropriate ordering decisions and replenishment policies, to keep their market shares by enhancing customer loyalty. For instance, at higher rescue prices, retail managers can place more orders with less risk.
From the numerical experiments, it can be concluded that a centralised supply chain always leads to higher profit for the entire supply chain while retailer’s profit is always lower than a decentralised system. Hence, retailers may object to supply chain centralisation and not share their information. Therefore, incentive mechanisms should be considered between members so that members of the chain ignore their independence and self-interest to increase the supply chain’s overall profit and create a win-win condition for each member.
Market conditions are not always monotonous. Factors such as introducing a new product, changes in raw material prices, or shift in customers’ tastes can dramatically change the demand rate. Hence, managers should execute contracts to share risks in unfavourable economic conditions to cope with market shocks without serious harm to the overall profit of the supply chain, and buyback contracts are a case in point. However, each member must be fully aware of how each contract can benefit or harm them.
Based on the findings (section 4.5), external factors (e.g. crises such as the Corona virus that caused many businesses to lose all their demand) have significant impacts, even beyond the level of effort, on sales and profits of the supply chain networks. Thus, managers should always try to alleviate the adverse effects of these events by increasing their business resilience.
The importance of the retailer’s efforts in attracting customers is undeniable. Therefore, retail managers need to adopt proper policies to identify what programmes they need to do to attract more customers (e.g. word of mouth advertising, neuro-linguistic programming) and determine the effort level required according to the existing economic conditions and the costs of implementing each plan.
6. Conclusion
The current study focused on the classical newsvendor problem with coordination between supply chain members to provide inventory policies and facilitate decision-making under risks of demand randomness for sustainable and green growth approaches based on the inventory system. For this purpose, we analyse the proposed problem under two conditions of supplying products to the retailers in the analytical model. In the first case, the retailer orders before the sales season, and the manufacturer provides the retailer’s needs with recycled materials. In the second case, the retailer re-orders the manufacturer after starting the sales season and facing a shortage, so the manufacturer will not have enough time to remanufacture products and use virgin materials. The model aims to study the total profit of supply chain members by considering carbon footprint constraints.
In addition, the centralised inventory control system’s coordination with the remanufacturing channel is examined under vertical integration, buyback contract, and retailer’s sales effort. According to the results, a comparison of models with and without carbon footprint constraints reveals that in the presence of the carbon limitation, the order quantity strongly depends on the allowable amount of carbon until it reaches the optimum order quantity in the absence of carbon footprint constraint. Also, as the numerical analysis revealed, activities such as production, transportation, and warehousing have more serious impacts on carbon emissions than end-of-season goods, demonstrating that companies need to pay more attention to the destructive effects of these activities in order to increase environmental performance. Moreover, the sensitivity analysis proved that considering remanufacturing is beneficial to environmental protection and makes the retailer’s expected profit increase. In other words, more investment in the remanufacturing department can lead to substantial gains in both social responsibility and profits.
In the current competitive market, sudden changes have increased companies’ pressures, so they cannot afford to handle all aspects of their business alone. Therefore, decisions and activities at the company level have now moved to the supply chain level. As the results showed, centralised decision-making helps to gain more economic goals. However, since centralised decision-making is not always suitable for retailers, incentive mechanisms can be considered to motivate them to cooperate with other members. Besides, it is observed that buyback contracts provide mechanisms to share the inherent risks and challenges between members without intensely affecting the total profit of the supply chain. This study precisely offers advice on under what terms and conditions each contract can be beneficial or detrimental to either party. Finally, it can be seen that the retailer’s sales effort can directly affect the main decision variables and profits of all supply chain members. According to the results, under the high pressure of external factors affecting business, more effort level only exacerbates the situation and raises the costs imposed. Thus, the presented model helps managers determine their optimum effort level based on the economic conditions and severity of external factors.
However, there exist some limitations to this study that should be considered when setting directions for future research. For instance, our model overlooked multiple alternatives for choosing among various brands of manufacturers with different qualities, prices, and degrees of greenness in the supply chain. It is possible to consider a brand-differentiated supply chain and decide to maintain each brand’s inventory according to the tastes and interests of customers. Also, our study only examined single-period inventory systems, which cannot assess the dynamic nature of some parameters and decisions in supply chains (e.g. fluctuation in the intensity and magnitude of damaging external factors over time and their influences on organisational decisions). Therefore, the future extension may include the development of a periodic model for inventory decision-making of companies. Additionally, this research proposed deterministic models without considering any uncertainties, such as the uncertainty of demand or manufacturer’s capacity. Hence, uncertain parameters can be applied to cover the limitations of the designed model.
Acknowledgments
The authors would like to thank the editor-in-chief and the anonymous reviewers for their valuable comments and helpful suggestions on a previous draft of this paper to improve its quality.
Disclosure statement
No potential conflict of interest was reported by the author(s).
Additional information
Notes on contributors
Mahsa Zokaee
Mahsa Zokaee is currently an MSc student of Industrial Engineering at the School of Industrial and Systems Engineering, College of Engineering, University of Tehran. His main scientific interests include operations research, mathematical modelling and supply chain coordination.
Alireza Nazari
Alireza Nazari is currently an MSc student of Industrial Engineering at the School of Industrial and Systems Engineering, College of Engineering, University of Tehran. His main scientific interests include operations research, inventory control and green supply chain management.
Amir Aghsami
Amir Aghsami is currently a Ph.D. candidate in Industrial Engineering at the School of Industrial Engineering, Khaje Nasir Toosi University of Technology. He received his MS in Industrial engineering from University of Tehran, Iran. He has published many papers in the proceedings of international conferences and international professional journals such as Quality Technology & Quantitative Management, Journal of Cleaner Production, Socio-economic planning science, Journal of Humanitarian Logistics and Supply Chain Management, etc. His main scientific interests include operations research, supply chain management, stochastic process, queueing systems, mathematical modeling, disaster management, and inventory control.
Fariborz Jolai
Fariborz Jolai is a Professor of Industrial Engineering at the School of Industrial and Systems Engineering, College of Engineering, University of Tehran. He has published more than 200 papers in international journals, such as European Journal of Operational Research, International Journal of Production Research, International Journal of Production Economics, Journal of Cleaner Production, Applied Mathematical Modelling, Journal of Humanitarian Logistics and Supply Chain Management, etc. His current research interests are Supply chain management, Scheduling, transportation optimization, stochastic process, queueing systems, humanitarian logistics, supply chain management, and production planning optimization problems.
References
- Arıkan, E., and W. Jammernegg. 2014. “The Single Period Inventory Model under Dual Sourcing and Product Carbon Footprint Constraint.” International Journal of Production Economics 157: 15–23.
- Bansal, P., and K. Roth. 2000. “Why Companies Go Green: A Model of Ecological Responsiveness.” Academy of Management Journal 43 (4): 717–736.
- Benjaafar, S., Y. Li, and M. Daskin. 2012. “Carbon Footprint and the Management of Supply Chains: Insights from Simple Models.” IEEE Transactions on Automation Science and Engineering 10 (1): 99–116.
- Chen, X., S. Benjaafar, and A. Elomri. 2013. “The Carbon-constrained EOQ.” Operations Research Letters 41 (2): 172–179.
- Choi, T. M., and C. H. Chiu. 2012. “Mean-downside-risk and Mean-variance Newsvendor Models: Implications for Sustainable Fashion Retailing.” International Journal of Production Economics 135 (2): 552–560.
- Dey, K., S. Roy, and S. Saha. 2019. “The Impact of Strategic Inventory and Procurement Strategies on Green Product Design in a Two-period Supply Chain.” International Journal of Production Research 57 (7): 1915–1948.
- Fakhrzad, M. B., and R. Lotfi. 2018. “Green Vendor Managed Inventory with Backorder in Two Echelon Supply Chain with Epsilon-constraint and NSGA-II Approach.” Journal of Industrial Engineering Research in Production Systems 5 (11): 193–209.
- Fleischmann, M., and R. Kuik. 2003. “On Optimal Inventory Control with Independent Stochastic Item Returns.” European Journal of Operational Research 151 (1): 25–37.
- He, Y., X. Zhao, L. Zhao, and J. He. 2009. “Coordinating a Supply Chain with Effort and Price Dependent Stochastic Demand.” Applied Mathematical Modelling 33 (6): 2777–2790.
- Hong, Z., W. Dai, H. Luh, and C. Yang. 2018. “Optimal Configuration of a Green Product Supply Chain with Guaranteed Service Time and Emission Constraints.” European Journal of Operational Research 266 (2): 663–677.
- Hua, G., T. C. E. Cheng, and S. Wang. 2011. “Managing Carbon Footprints in Inventory Management.” International Journal of Production Economics 132 (2): 178–185.
- Kainuma, Y., and N. Tawara. 2006. “A Multiple Attribute Utility Theory Approach to Lean and Green Supply Chain Management.” International Journal of Production Economics 101 (1): 99–108.
- Lamba, K., S. P. Singh, and N. Mishra. 2019. “Integrated Decisions for Supplier Selection and Lot-sizing considering Different Carbon Emission Regulations in Big Data Environment.” Computers & Industrial Engineering 128: 1052–1062.
- Lee, C. C., and W. H. J. Chu. 2005. “Who Should Control Inventory in a Supply Chain?” European Journal of Operational Research 164 (1): 158–172.
- Li, X., and J. Li 2018, August. “Combine Contract Model for Two-level Supply Chain considering Nash Bargaining Fairness Concerns and Sales Effort”. 2018 8th International Conference on Logistics, Informatics and Service Sciences (LISS), IEEE, 1–6, Toronto, ON, Canada.
- Liu, P. 2019. “Pricing and Coordination Strategies of Dual-channel Green Supply Chain considering Products Green Degree and Channel Environment Sustainability.” International Journal of Sustainable Engineering 12 (6): 404–414.
- Liu, S., M. Leat, and M. H. Smith. 2011. “State-of-the-art Sustainability Analysis Methodologies for Efficient Decision Support in Green Production Operations.” International Journal of Sustainable Engineering 4 (3): 236–250.
- Luthra, S., D. Garg, and A. Haleem. 2016. “The Impacts of Critical Success Factors for Implementing Green Supply Chain Management Towards Sustainability: An Empirical Investigation of Indian Automobile Industry.” Journal of Cleaner Production 121: 142–158.
- Malekkhouyan, S., A. Aghsami, and M. Rabbani. 2021. “An Integrated Multi-stage Vehicle Routing and Mixed-model Job-shop-type Robotic Disassembly Sequence Scheduling Problem for E-waste Management System.” International Journal of Computer Integrated Manufacturing 1–26.
- Mawandiya, B. K., J. K. Jha, and J. Thakkar. 2017. “Production-inventory Model for Two-echelon Closed-loop Supply Chain with Finite Manufacturing and Remanufacturing Rates.” International Journal of Systems Science: Operations & Logistics 4 (3): 199–218.
- Min, H., and W. P. Galle. 2001. “Green Purchasing Practices of US Firms.” International Journal of Operations & Production Management 21 (9): 1222-1238. doi:https://doi.org/10.1108/EUM0000000005923
- Moghadam, S. S., A. Aghsami, and M. Rabbani. 2021. “A Hybrid NSGA-II Algorithm for the Closed-loop Supply Chain Network Design in E-commerce.” RAIRO-Operations Research 55 (3): 1643–1674.
- Mohtashami, Z., A. Aghsami, and F. Jolai. 2020. “A Green Closed Loop Supply Chain Design Using Queuing System for Reducing Environmental Impact and Energy Consumption.” Journal of Cleaner Production 242: 118452.
- Narayanan, P. T. V., and R. Thirunavukkarasu. 2021. “Environmental Drivers on Green Supply Chain Practices.” International Research Journal of Business Studies 13 (3): 269–283.
- Parthasarathi, G., S. P. Sarmah, and M. Jenamani. 2011. “Supply Chain Coordination under Retail Competition Using Stock Dependent Price-setting Newsvendor Framework.” Operational Research 11 (3): 259–279.
- Pasternack, B. A. 2008. “Optimal Pricing and Return Policies for Perishable Commodities.” Marketing Science 27 (1): 133–140.
- Radfar, A., and D. Mohammaditabar. 2019. “Bi-Objective Optimization of Vendor Managed Inventory Problem in a Mult Echelon Green Supply Chain.” Journal of Industrial Management Perspective 9 (3 Autumn 2019): 109–134.
- Rahman, T., S. M. Ali, M. A. Moktadir, and S. Kusi-Sarpong. 2020. “Evaluating Barriers to Implementing Green Supply Chain Management: An Example from an Emerging Economy.” Production Planning & Control 31 (8): 673–698.
- Ranjan, A., and J. K. Jha. 2019. “Pricing and Coordination Strategies of a Dual-channel Supply Chain considering Green Quality and Sales Effort.” Journal of Cleaner Production 218: 409–424.
- Rezaei, A., A. Aghsami, and M. Rabbani. 2021. “Supplier Selection and Order Allocation Model with Disruption and Environmental Risks in Centralized Supply Chain.” International Journal of System Assurance Engineering and Management 1–37. doi:https://doi.org/10.1007/s13198-021-01164-1
- Rong, L., and M. Xu. 2020. “Impact of Revenue-sharing Contracts on Green Supply Chain in Manufacturing Industry.” International Journal of Sustainable Engineering 13 (4): 316–326.
- Roy, R., and R. C. Whelan. 1992. “Successful Recycling through Value-chain Collaboration.” Long Range Planning 25 (4): 62–71.
- Sazvar, Z., M. Zokaee, R. Tavakkoli-Moghaddam, S. A. S. Salari, and S. Nayeri. 2021. “Designing a Sustainable Closed-loop Pharmaceutical Supply Chain in a Competitive Market considering Demand Uncertainty, Manufacturer’s Brand and Waste Management.” Annals of Operations Research 1–32. doi: https://doi.org/10.1007/s10479-021-03961-0
- Shaharudin, M. R., K. C. Tan, V. Kannan, and S. Zailani. 2019. “The Mediating Effects of Product Returns on the Relationship between Green Capabilities and Closed-loop Supply Chain Adoption.” Journal of Cleaner Production 211: 233–246.
- Song, J., and M. Leng. 2012. “Analysis of the Single-period Problem under Carbon Emissions Policies.” In Handbook of Newsvendor Problems, 297–313, edited by Choi TM. New York, NY: Springer. doi:https://doi.org/10.1007/978-1-4614-3600-3_13
- Taylor, T. A. 2002. “Supply Chain Coordination under Channel Rebates with Sales Effort Effects.” Management Science 48 (8): 992–1007.
- Testa, F., and F. Iraldo. 2010. “Shadows and Lights of GSCM (Green Supply Chain Management): Determinants and Effects of These Practices Based on a Multi-national Study.” Journal of Cleaner Production 18 (10–11): 953–962.
- Thamsatitdej, P., S. Boon-Itt, P. Samaranayake, M. Wannakarn, and T. Laosirihongthong. 2017. “Eco-design Practices Towards Sustainable Supply Chain Management: Interpretive Structural Modelling (ISM) Approach.” International Journal of Sustainable Engineering 10 (6): 326–337.
- Toke, L. K., and S. D. Kalpande. 2019. “Critical Success Factors of Green Manufacturing for Achieving Sustainability in Indian Context.” International Journal of Sustainable Engineering 12 (6): 415–422.
- Wang, L., and M. Hui. 2020. “Research on Joint Emission Reduction in Supply Chain Based on Carbon Footprint of the Product.” Journal of Cleaner Production 263: 121086.
- Wang, Q., J. Wu, N. Zhao, and Q. Zhu. 2019. “Inventory Control and Supply Chain Management: A Green Growth Perspective.” Resources, Conservation and Recycling 145: 78–85.
- Yan, X., and G. S. Zaric. 2016. “Families of Supply Chain Coordinating Contracts in the Presence of Retailer Effort.” International Journal of Production Economics 175: 213–225.
- Yang, C. L., S. P. Lin, Y. H. Chan, and C. Sheu. 2010. “Mediated Effect of Environmental Management on Manufacturing Competitiveness: An Empirical Study.” International Journal of Production Economics 123 (1): 210–220.
- Yang, S., C. L. Munson, B. Chen, and C. Shi. 2015. “Coordinating Contracts for Supply Chains that Market with Mail-in Rebates and Retailer Promotions.” Journal of the Operational Research Society 66 (12): 2025–2036.
- Yu, H., A. Z. Zeng, and L. Zhao. 2009. “Analyzing the Evolutionary Stability of the Vendor-managed Inventory Supply Chains.” Computers & Industrial Engineering 56 (1): 274–282.
- Zailani, S., K. Govindan, M. Iranmanesh, M. R. Shaharudin, and Y. S. Chong. 2015. “Green Innovation Adoption in Automotive Supply Chain: The Malaysian Case.” Journal of Cleaner Production 108: 1115–1122.
- Zanoni, S., L. Mazzoldi, and M. Y. Jaber. 2014. “Vendor-managed Inventory with Consignment Stock Agreement for Single Vendor–single Buyer under the Emission-trading Scheme.” International Journal of Production Research 52 (1): 20–31.